
Key Insights
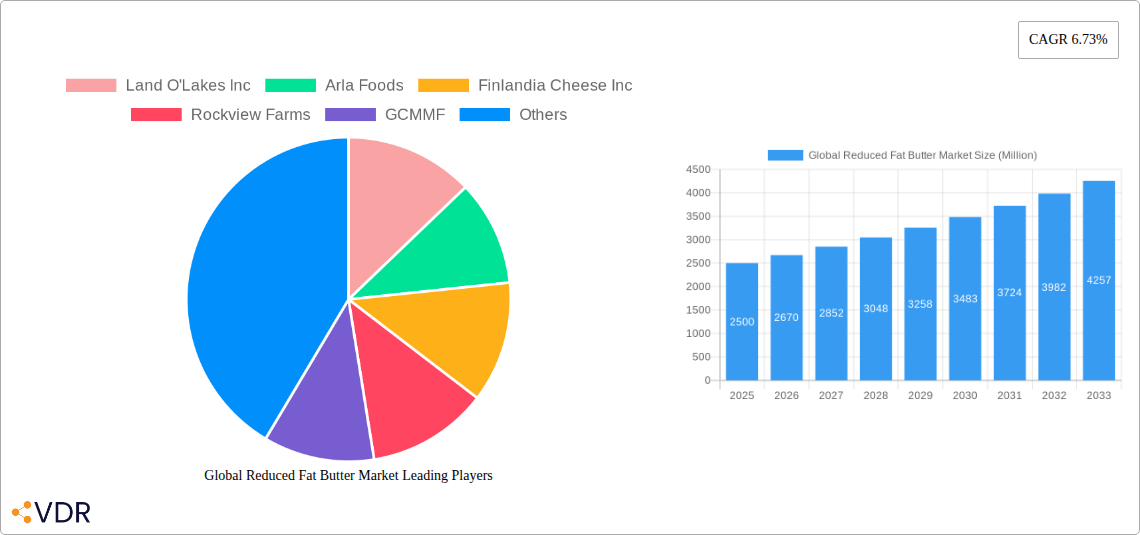
The global reduced-fat butter market, valued at approximately $2.5 billion in 2025, is projected to experience robust growth, driven by increasing consumer health consciousness and demand for lower-calorie dairy alternatives. A Compound Annual Growth Rate (CAGR) of 6.73% from 2025 to 2033 indicates a significant expansion, reaching an estimated market value exceeding $4 billion by 2033. This growth is fueled by several key factors. The rising prevalence of obesity and related health issues globally is pushing consumers towards healthier dietary choices, with reduced-fat butter presenting a palatable compromise between taste and health. Furthermore, the increasing availability of reduced-fat butter across various distribution channels, including supermarkets, convenience stores, and online retailers, enhances market accessibility. The market is segmented by form (spreadable and non-spreadable), distribution channel, and type (salted and unsalted), allowing manufacturers to tailor their offerings to specific consumer preferences. While challenges exist, such as fluctuating dairy prices and potential consumer perceptions regarding taste compromises, the overall market trajectory remains positive, propelled by innovation in product formulation and marketing strategies emphasizing the health benefits of reduced-fat butter. Major players, including Land O'Lakes, Arla Foods, and Unilever (Upfield), are actively investing in research and development to enhance product quality and expand their market share. Regional growth will vary, with North America and Europe maintaining significant market share due to established consumer preferences and high per capita consumption of dairy products. However, emerging markets in Asia-Pacific are expected to witness notable growth driven by rising disposable incomes and changing dietary habits.
The competitive landscape is characterized by both established dairy giants and smaller regional players. Successful strategies will involve a focus on product innovation, such as the development of novel formulations with enhanced taste and texture, as well as targeted marketing campaigns highlighting the health benefits and versatility of reduced-fat butter in culinary applications. Strategic partnerships with retailers and online platforms will be crucial for increasing market penetration and brand visibility. Furthermore, sustainable and ethical sourcing practices are gaining importance, reflecting growing consumer concerns regarding environmental impact and animal welfare. Companies are likely responding by promoting responsibly sourced ingredients and transparent supply chains. The overall outlook for the global reduced-fat butter market is optimistic, with continuous growth anticipated throughout the forecast period driven by the interplay of health trends, consumer preferences, and the dynamic efforts of market participants.
This comprehensive report provides an in-depth analysis of the global reduced fat butter market, encompassing market dynamics, growth trends, regional performance, key players, and future outlook. The study period spans from 2019 to 2033, with 2025 serving as the base and estimated year. The report segments the market by form (spreadable, non-spreadable), distribution channel (supermarkets/hypermarkets, convenience stores, online retailers, other), and type (salted, unsalted), offering a granular understanding of this dynamic industry. The market size is valued in million units.
Global Reduced Fat Butter Market Dynamics & Structure
The global reduced fat butter market is characterized by a moderately concentrated landscape with key players like Land O'Lakes Inc, Arla Foods, Finlandia Cheese Inc, Rockview Farms, GCMMF, Ornua Co-operative Limited, Raisio Group plc, Unilever (Upfield), SAVENCIA SA, and Saputo Inc. The market exhibits moderate growth, driven by increasing health consciousness among consumers and the rising demand for healthier alternatives to full-fat butter. However, intense competition and fluctuating dairy prices present ongoing challenges. Technological innovations in processing and packaging are also shaping the market dynamics.
- Market Concentration: xx% of the market is controlled by the top 5 players in 2025.
- Technological Innovation: Focus on improving taste and texture of reduced-fat butter remains a key driver of innovation.
- Regulatory Framework: Government regulations concerning fat content and labeling significantly impact market dynamics. Variations in regulations across regions influence market growth and product formulations.
- Competitive Product Substitutes: Margarine, plant-based spreads, and other dairy alternatives pose a competitive threat.
- End-User Demographics: The primary consumer base comprises health-conscious individuals and families seeking healthier alternatives to traditional butter.
- M&A Trends: The past five years have seen xx M&A deals within the reduced-fat butter sector.
Global Reduced Fat Butter Market Growth Trends & Insights
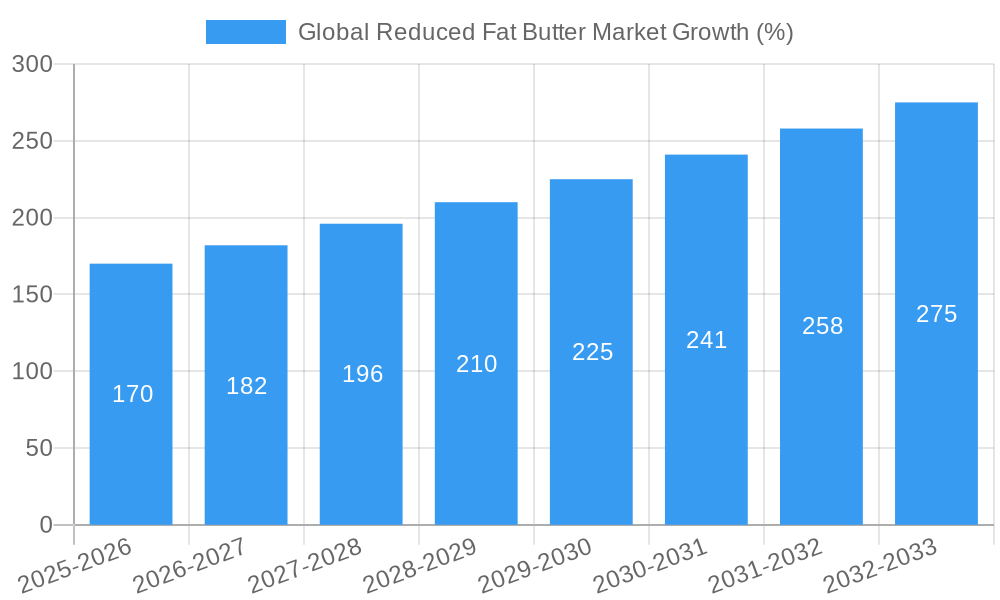
The global reduced fat butter market experienced a CAGR of xx% during the historical period (2019-2024) and is projected to maintain a CAGR of xx% during the forecast period (2025-2033). Market size reached xx million units in 2024 and is estimated at xx million units in 2025. The growth is fueled by increasing consumer awareness about heart health and the rise in demand for low-fat dairy products. Technological advancements in reducing fat content without compromising taste and texture play a significant role. Consumer preference shifts towards convenient packaging and online purchasing contribute further to market growth. However, fluctuating raw material prices and consumer skepticism regarding the taste of reduced-fat products pose challenges to sustained growth.
Dominant Regions, Countries, or Segments in Global Reduced Fat Butter Market
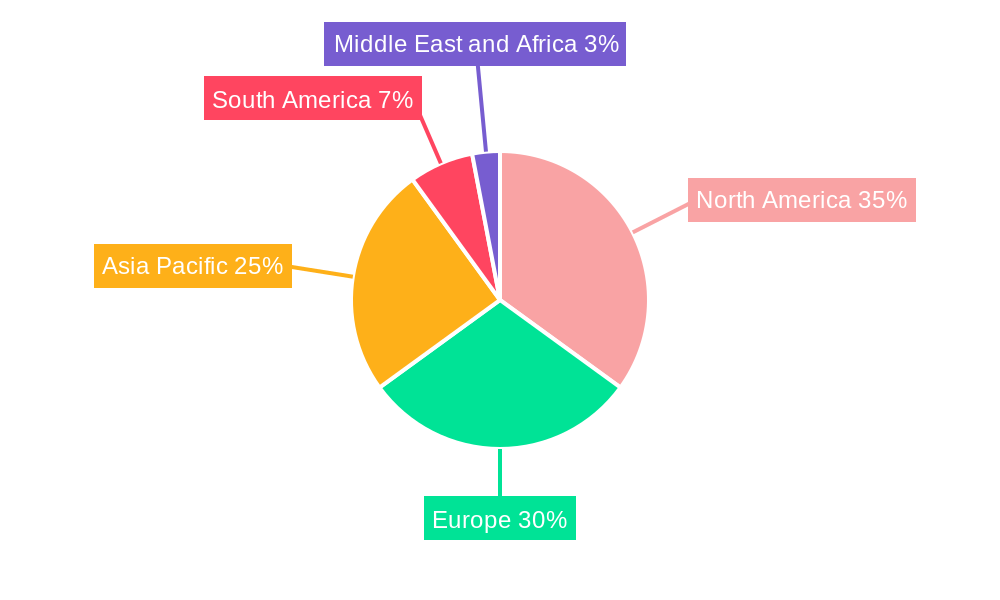
North America currently holds the largest market share in the global reduced-fat butter market, followed by Europe. Within these regions, the spreadable segment holds a dominant position, driven by consumer convenience. Supermarkets/hypermarkets remain the primary distribution channel, though online retailers are witnessing significant growth.
- North America: Strong consumer demand for healthy alternatives, coupled with established distribution networks, contributes to market dominance.
- Europe: High dairy consumption and growing health awareness drive substantial market growth.
- Asia-Pacific: This region shows high growth potential due to increasing disposable incomes and changing dietary habits.
- By Form: Spreadable butter holds the largest market share owing to its convenience and versatility.
- By Distribution Channel: Supermarkets/hypermarkets remain the dominant channel due to wide reach and established consumer habits.
- By Type: Salted reduced-fat butter holds a larger market share compared to unsalted variants due to established consumer preference.
Global Reduced Fat Butter Market Product Landscape
Reduced-fat butter products are increasingly offered in diverse forms, including tubs, sticks, and pouches, to cater to varied consumer needs and preferences. Technological advancements focus on improving the spreadability and taste profiles of reduced-fat butter to enhance consumer acceptance. Unique selling propositions often emphasize lower fat content without compromising taste or flavor.
Key Drivers, Barriers & Challenges in Global Reduced Fat Butter Market
Key Drivers:
- Growing health consciousness among consumers
- Increasing demand for healthier alternatives to full-fat butter
- Technological advancements in manufacturing processes
Challenges & Restraints:
- Fluctuations in raw material prices
- Intense competition from substitutes like margarine and plant-based spreads
- Consumer perception of reduced-fat butter as inferior in taste and texture
Emerging Opportunities in Global Reduced Fat Butter Market
Emerging opportunities lie in tapping into untapped markets in developing economies, where rising disposable incomes are driving demand for healthier food options. Innovation in flavors and functional attributes (e.g., added probiotics) can further enhance product appeal. Focusing on sustainable sourcing and eco-friendly packaging can attract environmentally conscious consumers.
Growth Accelerators in the Global Reduced Fat Butter Market Industry
Strategic partnerships and collaborations between dairy producers and food technology companies can accelerate innovation. Expansion into new geographic markets and the introduction of value-added products, such as flavored reduced-fat butter, can drive market growth.
Key Players Shaping the Global Reduced Fat Butter Market Market
- Land O'Lakes Inc
- Arla Foods
- Finlandia Cheese Inc
- Rockview Farms
- GCMMF
- Ornua Co-operative Limited
- Raisio Group plc
- Unilever (Upfield) [Unilever]
- SAVENCIA SA
- Saputo Inc
Notable Milestones in Global Reduced Fat Butter Market Sector
- 2021: Unilever launches a new line of reduced-fat butter with improved taste and texture.
- 2022: Arla Foods invests in a new production facility to increase capacity.
- 2023: Several key players initiate sustainable sourcing initiatives to address consumer demand.
- 2024: A major merger takes place among two of the smaller players.
In-Depth Global Reduced Fat Butter Market Outlook
The global reduced fat butter market is poised for continued growth over the forecast period, driven by sustained consumer demand for healthier food choices. Strategic investments in research and development, coupled with innovative product launches and expansion into new markets, will be key to capturing the emerging opportunities within this competitive landscape. The market's future hinges on successful innovation to overcome taste and texture barriers, which can be achieved through a continuous effort by major players toward better taste-enhanced products.
Global Reduced Fat Butter Market Segmentation
-
1. Type
- 1.1. Salted
- 1.2. Unsalted
-
2. Form
- 2.1. Spreadable
- 2.2. Non-spreadable
-
3. Distribution Channel
- 3.1. Supermarkets/Hypermarkets
- 3.2. Convenience Stores
- 3.3. Online Retailers
- 3.4. Other Distribution Channels
Global Reduced Fat Butter Market Segmentation By Geography
-
1. North America
- 1.1. United States
- 1.2. Canada
- 1.3. Mexico
- 1.4. Rest of North America
-
2. Europe
- 2.1. Spain
- 2.2. United Kingdom
- 2.3. Germany
- 2.4. France
- 2.5. Italy
- 2.6. Russia
- 2.7. Rest of Europe
-
3. Asia Pacific
- 3.1. China
- 3.2. Japan
- 3.3. India
- 3.4. Australia
- 3.5. Rest of Asia Pacific
-
4. South America
- 4.1. Brazil
- 4.2. Argentina
- 4.3. Rest of South America
-
5. Middle East and Africa
- 5.1. South Africa
- 5.2. Saudi Arabia
- 5.3. Rest of Middle East and Africa
Global Reduced Fat Butter Market REPORT HIGHLIGHTS
| Aspects | Details |
|---|---|
| Study Period | 2019-2033 |
| Base Year | 2024 |
| Estimated Year | 2025 |
| Forecast Period | 2025-2033 |
| Historical Period | 2019-2024 |
| Growth Rate | CAGR of 6.73% from 2019-2033 |
| Segmentation |
|
Table of Contents
- 1. Introduction
- 1.1. Research Scope
- 1.2. Market Segmentation
- 1.3. Research Methodology
- 1.4. Definitions and Assumptions
- 2. Executive Summary
- 2.1. Introduction
- 3. Market Dynamics
- 3.1. Introduction
- 3.2. Market Drivers
- 3.2.1. Increasing application of Gelatin in healthcare and pharmaceutical sector
- 3.3. Market Restrains
- 3.3.1. Rising demand for clean label products
- 3.4. Market Trends
- 3.4.1. Surge in Demand for Low Fat and Low Calorie Food Products
- 4. Market Factor Analysis
- 4.1. Porters Five Forces
- 4.2. Supply/Value Chain
- 4.3. PESTEL analysis
- 4.4. Market Entropy
- 4.5. Patent/Trademark Analysis
- 5. Global Reduced Fat Butter Market Analysis, Insights and Forecast, 2019-2031
- 5.1. Market Analysis, Insights and Forecast - by Type
- 5.1.1. Salted
- 5.1.2. Unsalted
- 5.2. Market Analysis, Insights and Forecast - by Form
- 5.2.1. Spreadable
- 5.2.2. Non-spreadable
- 5.3. Market Analysis, Insights and Forecast - by Distribution Channel
- 5.3.1. Supermarkets/Hypermarkets
- 5.3.2. Convenience Stores
- 5.3.3. Online Retailers
- 5.3.4. Other Distribution Channels
- 5.4. Market Analysis, Insights and Forecast - by Region
- 5.4.1. North America
- 5.4.2. Europe
- 5.4.3. Asia Pacific
- 5.4.4. South America
- 5.4.5. Middle East and Africa
- 5.1. Market Analysis, Insights and Forecast - by Type
- 6. North America Global Reduced Fat Butter Market Analysis, Insights and Forecast, 2019-2031
- 6.1. Market Analysis, Insights and Forecast - by Type
- 6.1.1. Salted
- 6.1.2. Unsalted
- 6.2. Market Analysis, Insights and Forecast - by Form
- 6.2.1. Spreadable
- 6.2.2. Non-spreadable
- 6.3. Market Analysis, Insights and Forecast - by Distribution Channel
- 6.3.1. Supermarkets/Hypermarkets
- 6.3.2. Convenience Stores
- 6.3.3. Online Retailers
- 6.3.4. Other Distribution Channels
- 6.1. Market Analysis, Insights and Forecast - by Type
- 7. Europe Global Reduced Fat Butter Market Analysis, Insights and Forecast, 2019-2031
- 7.1. Market Analysis, Insights and Forecast - by Type
- 7.1.1. Salted
- 7.1.2. Unsalted
- 7.2. Market Analysis, Insights and Forecast - by Form
- 7.2.1. Spreadable
- 7.2.2. Non-spreadable
- 7.3. Market Analysis, Insights and Forecast - by Distribution Channel
- 7.3.1. Supermarkets/Hypermarkets
- 7.3.2. Convenience Stores
- 7.3.3. Online Retailers
- 7.3.4. Other Distribution Channels
- 7.1. Market Analysis, Insights and Forecast - by Type
- 8. Asia Pacific Global Reduced Fat Butter Market Analysis, Insights and Forecast, 2019-2031
- 8.1. Market Analysis, Insights and Forecast - by Type
- 8.1.1. Salted
- 8.1.2. Unsalted
- 8.2. Market Analysis, Insights and Forecast - by Form
- 8.2.1. Spreadable
- 8.2.2. Non-spreadable
- 8.3. Market Analysis, Insights and Forecast - by Distribution Channel
- 8.3.1. Supermarkets/Hypermarkets
- 8.3.2. Convenience Stores
- 8.3.3. Online Retailers
- 8.3.4. Other Distribution Channels
- 8.1. Market Analysis, Insights and Forecast - by Type
- 9. South America Global Reduced Fat Butter Market Analysis, Insights and Forecast, 2019-2031
- 9.1. Market Analysis, Insights and Forecast - by Type
- 9.1.1. Salted
- 9.1.2. Unsalted
- 9.2. Market Analysis, Insights and Forecast - by Form
- 9.2.1. Spreadable
- 9.2.2. Non-spreadable
- 9.3. Market Analysis, Insights and Forecast - by Distribution Channel
- 9.3.1. Supermarkets/Hypermarkets
- 9.3.2. Convenience Stores
- 9.3.3. Online Retailers
- 9.3.4. Other Distribution Channels
- 9.1. Market Analysis, Insights and Forecast - by Type
- 10. Middle East and Africa Global Reduced Fat Butter Market Analysis, Insights and Forecast, 2019-2031
- 10.1. Market Analysis, Insights and Forecast - by Type
- 10.1.1. Salted
- 10.1.2. Unsalted
- 10.2. Market Analysis, Insights and Forecast - by Form
- 10.2.1. Spreadable
- 10.2.2. Non-spreadable
- 10.3. Market Analysis, Insights and Forecast - by Distribution Channel
- 10.3.1. Supermarkets/Hypermarkets
- 10.3.2. Convenience Stores
- 10.3.3. Online Retailers
- 10.3.4. Other Distribution Channels
- 10.1. Market Analysis, Insights and Forecast - by Type
- 11. North America Global Reduced Fat Butter Market Analysis, Insights and Forecast, 2019-2031
- 11.1. Market Analysis, Insights and Forecast - By Country/Sub-region
- 11.1.1 United States
- 11.1.2 Canada
- 11.1.3 Mexico
- 11.1.4 Rest of North America
- 12. Europe Global Reduced Fat Butter Market Analysis, Insights and Forecast, 2019-2031
- 12.1. Market Analysis, Insights and Forecast - By Country/Sub-region
- 12.1.1 Spain
- 12.1.2 United Kingdom
- 12.1.3 Germany
- 12.1.4 France
- 12.1.5 Italy
- 12.1.6 Russia
- 12.1.7 Rest of Europe
- 13. Asia Pacific Global Reduced Fat Butter Market Analysis, Insights and Forecast, 2019-2031
- 13.1. Market Analysis, Insights and Forecast - By Country/Sub-region
- 13.1.1 China
- 13.1.2 Japan
- 13.1.3 India
- 13.1.4 Australia
- 13.1.5 Rest of Asia Pacific
- 14. South America Global Reduced Fat Butter Market Analysis, Insights and Forecast, 2019-2031
- 14.1. Market Analysis, Insights and Forecast - By Country/Sub-region
- 14.1.1 Brazil
- 14.1.2 Argentina
- 14.1.3 Rest of South America
- 15. Middle East and Africa Global Reduced Fat Butter Market Analysis, Insights and Forecast, 2019-2031
- 15.1. Market Analysis, Insights and Forecast - By Country/Sub-region
- 15.1.1 South Africa
- 15.1.2 Saudi Arabia
- 15.1.3 Rest of Middle East and Africa
- 16. Competitive Analysis
- 16.1. Market Share Analysis 2024
- 16.2. Company Profiles
- 16.2.1 Land O'Lakes Inc
- 16.2.1.1. Overview
- 16.2.1.2. Products
- 16.2.1.3. SWOT Analysis
- 16.2.1.4. Recent Developments
- 16.2.1.5. Financials (Based on Availability)
- 16.2.2 Arla Foods
- 16.2.2.1. Overview
- 16.2.2.2. Products
- 16.2.2.3. SWOT Analysis
- 16.2.2.4. Recent Developments
- 16.2.2.5. Financials (Based on Availability)
- 16.2.3 Finlandia Cheese Inc
- 16.2.3.1. Overview
- 16.2.3.2. Products
- 16.2.3.3. SWOT Analysis
- 16.2.3.4. Recent Developments
- 16.2.3.5. Financials (Based on Availability)
- 16.2.4 Rockview Farms
- 16.2.4.1. Overview
- 16.2.4.2. Products
- 16.2.4.3. SWOT Analysis
- 16.2.4.4. Recent Developments
- 16.2.4.5. Financials (Based on Availability)
- 16.2.5 GCMMF
- 16.2.5.1. Overview
- 16.2.5.2. Products
- 16.2.5.3. SWOT Analysis
- 16.2.5.4. Recent Developments
- 16.2.5.5. Financials (Based on Availability)
- 16.2.6 Ornua Co-operative Limited
- 16.2.6.1. Overview
- 16.2.6.2. Products
- 16.2.6.3. SWOT Analysis
- 16.2.6.4. Recent Developments
- 16.2.6.5. Financials (Based on Availability)
- 16.2.7 Raisio Group plc*List Not Exhaustive
- 16.2.7.1. Overview
- 16.2.7.2. Products
- 16.2.7.3. SWOT Analysis
- 16.2.7.4. Recent Developments
- 16.2.7.5. Financials (Based on Availability)
- 16.2.8 Unilever (Upfield)
- 16.2.8.1. Overview
- 16.2.8.2. Products
- 16.2.8.3. SWOT Analysis
- 16.2.8.4. Recent Developments
- 16.2.8.5. Financials (Based on Availability)
- 16.2.9 SAVENCIA SA
- 16.2.9.1. Overview
- 16.2.9.2. Products
- 16.2.9.3. SWOT Analysis
- 16.2.9.4. Recent Developments
- 16.2.9.5. Financials (Based on Availability)
- 16.2.10 Saputo Inc
- 16.2.10.1. Overview
- 16.2.10.2. Products
- 16.2.10.3. SWOT Analysis
- 16.2.10.4. Recent Developments
- 16.2.10.5. Financials (Based on Availability)
- 16.2.1 Land O'Lakes Inc
List of Figures
- Figure 1: Global Global Reduced Fat Butter Market Revenue Breakdown (Million, %) by Region 2024 & 2032
- Figure 2: Global Global Reduced Fat Butter Market Volume Breakdown (K Units, %) by Region 2024 & 2032
- Figure 3: North America Global Reduced Fat Butter Market Revenue (Million), by Country 2024 & 2032
- Figure 4: North America Global Reduced Fat Butter Market Volume (K Units), by Country 2024 & 2032
- Figure 5: North America Global Reduced Fat Butter Market Revenue Share (%), by Country 2024 & 2032
- Figure 6: North America Global Reduced Fat Butter Market Volume Share (%), by Country 2024 & 2032
- Figure 7: Europe Global Reduced Fat Butter Market Revenue (Million), by Country 2024 & 2032
- Figure 8: Europe Global Reduced Fat Butter Market Volume (K Units), by Country 2024 & 2032
- Figure 9: Europe Global Reduced Fat Butter Market Revenue Share (%), by Country 2024 & 2032
- Figure 10: Europe Global Reduced Fat Butter Market Volume Share (%), by Country 2024 & 2032
- Figure 11: Asia Pacific Global Reduced Fat Butter Market Revenue (Million), by Country 2024 & 2032
- Figure 12: Asia Pacific Global Reduced Fat Butter Market Volume (K Units), by Country 2024 & 2032
- Figure 13: Asia Pacific Global Reduced Fat Butter Market Revenue Share (%), by Country 2024 & 2032
- Figure 14: Asia Pacific Global Reduced Fat Butter Market Volume Share (%), by Country 2024 & 2032
- Figure 15: South America Global Reduced Fat Butter Market Revenue (Million), by Country 2024 & 2032
- Figure 16: South America Global Reduced Fat Butter Market Volume (K Units), by Country 2024 & 2032
- Figure 17: South America Global Reduced Fat Butter Market Revenue Share (%), by Country 2024 & 2032
- Figure 18: South America Global Reduced Fat Butter Market Volume Share (%), by Country 2024 & 2032
- Figure 19: Middle East and Africa Global Reduced Fat Butter Market Revenue (Million), by Country 2024 & 2032
- Figure 20: Middle East and Africa Global Reduced Fat Butter Market Volume (K Units), by Country 2024 & 2032
- Figure 21: Middle East and Africa Global Reduced Fat Butter Market Revenue Share (%), by Country 2024 & 2032
- Figure 22: Middle East and Africa Global Reduced Fat Butter Market Volume Share (%), by Country 2024 & 2032
- Figure 23: North America Global Reduced Fat Butter Market Revenue (Million), by Type 2024 & 2032
- Figure 24: North America Global Reduced Fat Butter Market Volume (K Units), by Type 2024 & 2032
- Figure 25: North America Global Reduced Fat Butter Market Revenue Share (%), by Type 2024 & 2032
- Figure 26: North America Global Reduced Fat Butter Market Volume Share (%), by Type 2024 & 2032
- Figure 27: North America Global Reduced Fat Butter Market Revenue (Million), by Form 2024 & 2032
- Figure 28: North America Global Reduced Fat Butter Market Volume (K Units), by Form 2024 & 2032
- Figure 29: North America Global Reduced Fat Butter Market Revenue Share (%), by Form 2024 & 2032
- Figure 30: North America Global Reduced Fat Butter Market Volume Share (%), by Form 2024 & 2032
- Figure 31: North America Global Reduced Fat Butter Market Revenue (Million), by Distribution Channel 2024 & 2032
- Figure 32: North America Global Reduced Fat Butter Market Volume (K Units), by Distribution Channel 2024 & 2032
- Figure 33: North America Global Reduced Fat Butter Market Revenue Share (%), by Distribution Channel 2024 & 2032
- Figure 34: North America Global Reduced Fat Butter Market Volume Share (%), by Distribution Channel 2024 & 2032
- Figure 35: North America Global Reduced Fat Butter Market Revenue (Million), by Country 2024 & 2032
- Figure 36: North America Global Reduced Fat Butter Market Volume (K Units), by Country 2024 & 2032
- Figure 37: North America Global Reduced Fat Butter Market Revenue Share (%), by Country 2024 & 2032
- Figure 38: North America Global Reduced Fat Butter Market Volume Share (%), by Country 2024 & 2032
- Figure 39: Europe Global Reduced Fat Butter Market Revenue (Million), by Type 2024 & 2032
- Figure 40: Europe Global Reduced Fat Butter Market Volume (K Units), by Type 2024 & 2032
- Figure 41: Europe Global Reduced Fat Butter Market Revenue Share (%), by Type 2024 & 2032
- Figure 42: Europe Global Reduced Fat Butter Market Volume Share (%), by Type 2024 & 2032
- Figure 43: Europe Global Reduced Fat Butter Market Revenue (Million), by Form 2024 & 2032
- Figure 44: Europe Global Reduced Fat Butter Market Volume (K Units), by Form 2024 & 2032
- Figure 45: Europe Global Reduced Fat Butter Market Revenue Share (%), by Form 2024 & 2032
- Figure 46: Europe Global Reduced Fat Butter Market Volume Share (%), by Form 2024 & 2032
- Figure 47: Europe Global Reduced Fat Butter Market Revenue (Million), by Distribution Channel 2024 & 2032
- Figure 48: Europe Global Reduced Fat Butter Market Volume (K Units), by Distribution Channel 2024 & 2032
- Figure 49: Europe Global Reduced Fat Butter Market Revenue Share (%), by Distribution Channel 2024 & 2032
- Figure 50: Europe Global Reduced Fat Butter Market Volume Share (%), by Distribution Channel 2024 & 2032
- Figure 51: Europe Global Reduced Fat Butter Market Revenue (Million), by Country 2024 & 2032
- Figure 52: Europe Global Reduced Fat Butter Market Volume (K Units), by Country 2024 & 2032
- Figure 53: Europe Global Reduced Fat Butter Market Revenue Share (%), by Country 2024 & 2032
- Figure 54: Europe Global Reduced Fat Butter Market Volume Share (%), by Country 2024 & 2032
- Figure 55: Asia Pacific Global Reduced Fat Butter Market Revenue (Million), by Type 2024 & 2032
- Figure 56: Asia Pacific Global Reduced Fat Butter Market Volume (K Units), by Type 2024 & 2032
- Figure 57: Asia Pacific Global Reduced Fat Butter Market Revenue Share (%), by Type 2024 & 2032
- Figure 58: Asia Pacific Global Reduced Fat Butter Market Volume Share (%), by Type 2024 & 2032
- Figure 59: Asia Pacific Global Reduced Fat Butter Market Revenue (Million), by Form 2024 & 2032
- Figure 60: Asia Pacific Global Reduced Fat Butter Market Volume (K Units), by Form 2024 & 2032
- Figure 61: Asia Pacific Global Reduced Fat Butter Market Revenue Share (%), by Form 2024 & 2032
- Figure 62: Asia Pacific Global Reduced Fat Butter Market Volume Share (%), by Form 2024 & 2032
- Figure 63: Asia Pacific Global Reduced Fat Butter Market Revenue (Million), by Distribution Channel 2024 & 2032
- Figure 64: Asia Pacific Global Reduced Fat Butter Market Volume (K Units), by Distribution Channel 2024 & 2032
- Figure 65: Asia Pacific Global Reduced Fat Butter Market Revenue Share (%), by Distribution Channel 2024 & 2032
- Figure 66: Asia Pacific Global Reduced Fat Butter Market Volume Share (%), by Distribution Channel 2024 & 2032
- Figure 67: Asia Pacific Global Reduced Fat Butter Market Revenue (Million), by Country 2024 & 2032
- Figure 68: Asia Pacific Global Reduced Fat Butter Market Volume (K Units), by Country 2024 & 2032
- Figure 69: Asia Pacific Global Reduced Fat Butter Market Revenue Share (%), by Country 2024 & 2032
- Figure 70: Asia Pacific Global Reduced Fat Butter Market Volume Share (%), by Country 2024 & 2032
- Figure 71: South America Global Reduced Fat Butter Market Revenue (Million), by Type 2024 & 2032
- Figure 72: South America Global Reduced Fat Butter Market Volume (K Units), by Type 2024 & 2032
- Figure 73: South America Global Reduced Fat Butter Market Revenue Share (%), by Type 2024 & 2032
- Figure 74: South America Global Reduced Fat Butter Market Volume Share (%), by Type 2024 & 2032
- Figure 75: South America Global Reduced Fat Butter Market Revenue (Million), by Form 2024 & 2032
- Figure 76: South America Global Reduced Fat Butter Market Volume (K Units), by Form 2024 & 2032
- Figure 77: South America Global Reduced Fat Butter Market Revenue Share (%), by Form 2024 & 2032
- Figure 78: South America Global Reduced Fat Butter Market Volume Share (%), by Form 2024 & 2032
- Figure 79: South America Global Reduced Fat Butter Market Revenue (Million), by Distribution Channel 2024 & 2032
- Figure 80: South America Global Reduced Fat Butter Market Volume (K Units), by Distribution Channel 2024 & 2032
- Figure 81: South America Global Reduced Fat Butter Market Revenue Share (%), by Distribution Channel 2024 & 2032
- Figure 82: South America Global Reduced Fat Butter Market Volume Share (%), by Distribution Channel 2024 & 2032
- Figure 83: South America Global Reduced Fat Butter Market Revenue (Million), by Country 2024 & 2032
- Figure 84: South America Global Reduced Fat Butter Market Volume (K Units), by Country 2024 & 2032
- Figure 85: South America Global Reduced Fat Butter Market Revenue Share (%), by Country 2024 & 2032
- Figure 86: South America Global Reduced Fat Butter Market Volume Share (%), by Country 2024 & 2032
- Figure 87: Middle East and Africa Global Reduced Fat Butter Market Revenue (Million), by Type 2024 & 2032
- Figure 88: Middle East and Africa Global Reduced Fat Butter Market Volume (K Units), by Type 2024 & 2032
- Figure 89: Middle East and Africa Global Reduced Fat Butter Market Revenue Share (%), by Type 2024 & 2032
- Figure 90: Middle East and Africa Global Reduced Fat Butter Market Volume Share (%), by Type 2024 & 2032
- Figure 91: Middle East and Africa Global Reduced Fat Butter Market Revenue (Million), by Form 2024 & 2032
- Figure 92: Middle East and Africa Global Reduced Fat Butter Market Volume (K Units), by Form 2024 & 2032
- Figure 93: Middle East and Africa Global Reduced Fat Butter Market Revenue Share (%), by Form 2024 & 2032
- Figure 94: Middle East and Africa Global Reduced Fat Butter Market Volume Share (%), by Form 2024 & 2032
- Figure 95: Middle East and Africa Global Reduced Fat Butter Market Revenue (Million), by Distribution Channel 2024 & 2032
- Figure 96: Middle East and Africa Global Reduced Fat Butter Market Volume (K Units), by Distribution Channel 2024 & 2032
- Figure 97: Middle East and Africa Global Reduced Fat Butter Market Revenue Share (%), by Distribution Channel 2024 & 2032
- Figure 98: Middle East and Africa Global Reduced Fat Butter Market Volume Share (%), by Distribution Channel 2024 & 2032
- Figure 99: Middle East and Africa Global Reduced Fat Butter Market Revenue (Million), by Country 2024 & 2032
- Figure 100: Middle East and Africa Global Reduced Fat Butter Market Volume (K Units), by Country 2024 & 2032
- Figure 101: Middle East and Africa Global Reduced Fat Butter Market Revenue Share (%), by Country 2024 & 2032
- Figure 102: Middle East and Africa Global Reduced Fat Butter Market Volume Share (%), by Country 2024 & 2032
List of Tables
- Table 1: Global Reduced Fat Butter Market Revenue Million Forecast, by Region 2019 & 2032
- Table 2: Global Reduced Fat Butter Market Volume K Units Forecast, by Region 2019 & 2032
- Table 3: Global Reduced Fat Butter Market Revenue Million Forecast, by Type 2019 & 2032
- Table 4: Global Reduced Fat Butter Market Volume K Units Forecast, by Type 2019 & 2032
- Table 5: Global Reduced Fat Butter Market Revenue Million Forecast, by Form 2019 & 2032
- Table 6: Global Reduced Fat Butter Market Volume K Units Forecast, by Form 2019 & 2032
- Table 7: Global Reduced Fat Butter Market Revenue Million Forecast, by Distribution Channel 2019 & 2032
- Table 8: Global Reduced Fat Butter Market Volume K Units Forecast, by Distribution Channel 2019 & 2032
- Table 9: Global Reduced Fat Butter Market Revenue Million Forecast, by Region 2019 & 2032
- Table 10: Global Reduced Fat Butter Market Volume K Units Forecast, by Region 2019 & 2032
- Table 11: Global Reduced Fat Butter Market Revenue Million Forecast, by Country 2019 & 2032
- Table 12: Global Reduced Fat Butter Market Volume K Units Forecast, by Country 2019 & 2032
- Table 13: United States Global Reduced Fat Butter Market Revenue (Million) Forecast, by Application 2019 & 2032
- Table 14: United States Global Reduced Fat Butter Market Volume (K Units) Forecast, by Application 2019 & 2032
- Table 15: Canada Global Reduced Fat Butter Market Revenue (Million) Forecast, by Application 2019 & 2032
- Table 16: Canada Global Reduced Fat Butter Market Volume (K Units) Forecast, by Application 2019 & 2032
- Table 17: Mexico Global Reduced Fat Butter Market Revenue (Million) Forecast, by Application 2019 & 2032
- Table 18: Mexico Global Reduced Fat Butter Market Volume (K Units) Forecast, by Application 2019 & 2032
- Table 19: Rest of North America Global Reduced Fat Butter Market Revenue (Million) Forecast, by Application 2019 & 2032
- Table 20: Rest of North America Global Reduced Fat Butter Market Volume (K Units) Forecast, by Application 2019 & 2032
- Table 21: Global Reduced Fat Butter Market Revenue Million Forecast, by Country 2019 & 2032
- Table 22: Global Reduced Fat Butter Market Volume K Units Forecast, by Country 2019 & 2032
- Table 23: Spain Global Reduced Fat Butter Market Revenue (Million) Forecast, by Application 2019 & 2032
- Table 24: Spain Global Reduced Fat Butter Market Volume (K Units) Forecast, by Application 2019 & 2032
- Table 25: United Kingdom Global Reduced Fat Butter Market Revenue (Million) Forecast, by Application 2019 & 2032
- Table 26: United Kingdom Global Reduced Fat Butter Market Volume (K Units) Forecast, by Application 2019 & 2032
- Table 27: Germany Global Reduced Fat Butter Market Revenue (Million) Forecast, by Application 2019 & 2032
- Table 28: Germany Global Reduced Fat Butter Market Volume (K Units) Forecast, by Application 2019 & 2032
- Table 29: France Global Reduced Fat Butter Market Revenue (Million) Forecast, by Application 2019 & 2032
- Table 30: France Global Reduced Fat Butter Market Volume (K Units) Forecast, by Application 2019 & 2032
- Table 31: Italy Global Reduced Fat Butter Market Revenue (Million) Forecast, by Application 2019 & 2032
- Table 32: Italy Global Reduced Fat Butter Market Volume (K Units) Forecast, by Application 2019 & 2032
- Table 33: Russia Global Reduced Fat Butter Market Revenue (Million) Forecast, by Application 2019 & 2032
- Table 34: Russia Global Reduced Fat Butter Market Volume (K Units) Forecast, by Application 2019 & 2032
- Table 35: Rest of Europe Global Reduced Fat Butter Market Revenue (Million) Forecast, by Application 2019 & 2032
- Table 36: Rest of Europe Global Reduced Fat Butter Market Volume (K Units) Forecast, by Application 2019 & 2032
- Table 37: Global Reduced Fat Butter Market Revenue Million Forecast, by Country 2019 & 2032
- Table 38: Global Reduced Fat Butter Market Volume K Units Forecast, by Country 2019 & 2032
- Table 39: China Global Reduced Fat Butter Market Revenue (Million) Forecast, by Application 2019 & 2032
- Table 40: China Global Reduced Fat Butter Market Volume (K Units) Forecast, by Application 2019 & 2032
- Table 41: Japan Global Reduced Fat Butter Market Revenue (Million) Forecast, by Application 2019 & 2032
- Table 42: Japan Global Reduced Fat Butter Market Volume (K Units) Forecast, by Application 2019 & 2032
- Table 43: India Global Reduced Fat Butter Market Revenue (Million) Forecast, by Application 2019 & 2032
- Table 44: India Global Reduced Fat Butter Market Volume (K Units) Forecast, by Application 2019 & 2032
- Table 45: Australia Global Reduced Fat Butter Market Revenue (Million) Forecast, by Application 2019 & 2032
- Table 46: Australia Global Reduced Fat Butter Market Volume (K Units) Forecast, by Application 2019 & 2032
- Table 47: Rest of Asia Pacific Global Reduced Fat Butter Market Revenue (Million) Forecast, by Application 2019 & 2032
- Table 48: Rest of Asia Pacific Global Reduced Fat Butter Market Volume (K Units) Forecast, by Application 2019 & 2032
- Table 49: Global Reduced Fat Butter Market Revenue Million Forecast, by Country 2019 & 2032
- Table 50: Global Reduced Fat Butter Market Volume K Units Forecast, by Country 2019 & 2032
- Table 51: Brazil Global Reduced Fat Butter Market Revenue (Million) Forecast, by Application 2019 & 2032
- Table 52: Brazil Global Reduced Fat Butter Market Volume (K Units) Forecast, by Application 2019 & 2032
- Table 53: Argentina Global Reduced Fat Butter Market Revenue (Million) Forecast, by Application 2019 & 2032
- Table 54: Argentina Global Reduced Fat Butter Market Volume (K Units) Forecast, by Application 2019 & 2032
- Table 55: Rest of South America Global Reduced Fat Butter Market Revenue (Million) Forecast, by Application 2019 & 2032
- Table 56: Rest of South America Global Reduced Fat Butter Market Volume (K Units) Forecast, by Application 2019 & 2032
- Table 57: Global Reduced Fat Butter Market Revenue Million Forecast, by Country 2019 & 2032
- Table 58: Global Reduced Fat Butter Market Volume K Units Forecast, by Country 2019 & 2032
- Table 59: South Africa Global Reduced Fat Butter Market Revenue (Million) Forecast, by Application 2019 & 2032
- Table 60: South Africa Global Reduced Fat Butter Market Volume (K Units) Forecast, by Application 2019 & 2032
- Table 61: Saudi Arabia Global Reduced Fat Butter Market Revenue (Million) Forecast, by Application 2019 & 2032
- Table 62: Saudi Arabia Global Reduced Fat Butter Market Volume (K Units) Forecast, by Application 2019 & 2032
- Table 63: Rest of Middle East and Africa Global Reduced Fat Butter Market Revenue (Million) Forecast, by Application 2019 & 2032
- Table 64: Rest of Middle East and Africa Global Reduced Fat Butter Market Volume (K Units) Forecast, by Application 2019 & 2032
- Table 65: Global Reduced Fat Butter Market Revenue Million Forecast, by Type 2019 & 2032
- Table 66: Global Reduced Fat Butter Market Volume K Units Forecast, by Type 2019 & 2032
- Table 67: Global Reduced Fat Butter Market Revenue Million Forecast, by Form 2019 & 2032
- Table 68: Global Reduced Fat Butter Market Volume K Units Forecast, by Form 2019 & 2032
- Table 69: Global Reduced Fat Butter Market Revenue Million Forecast, by Distribution Channel 2019 & 2032
- Table 70: Global Reduced Fat Butter Market Volume K Units Forecast, by Distribution Channel 2019 & 2032
- Table 71: Global Reduced Fat Butter Market Revenue Million Forecast, by Country 2019 & 2032
- Table 72: Global Reduced Fat Butter Market Volume K Units Forecast, by Country 2019 & 2032
- Table 73: United States Global Reduced Fat Butter Market Revenue (Million) Forecast, by Application 2019 & 2032
- Table 74: United States Global Reduced Fat Butter Market Volume (K Units) Forecast, by Application 2019 & 2032
- Table 75: Canada Global Reduced Fat Butter Market Revenue (Million) Forecast, by Application 2019 & 2032
- Table 76: Canada Global Reduced Fat Butter Market Volume (K Units) Forecast, by Application 2019 & 2032
- Table 77: Mexico Global Reduced Fat Butter Market Revenue (Million) Forecast, by Application 2019 & 2032
- Table 78: Mexico Global Reduced Fat Butter Market Volume (K Units) Forecast, by Application 2019 & 2032
- Table 79: Rest of North America Global Reduced Fat Butter Market Revenue (Million) Forecast, by Application 2019 & 2032
- Table 80: Rest of North America Global Reduced Fat Butter Market Volume (K Units) Forecast, by Application 2019 & 2032
- Table 81: Global Reduced Fat Butter Market Revenue Million Forecast, by Type 2019 & 2032
- Table 82: Global Reduced Fat Butter Market Volume K Units Forecast, by Type 2019 & 2032
- Table 83: Global Reduced Fat Butter Market Revenue Million Forecast, by Form 2019 & 2032
- Table 84: Global Reduced Fat Butter Market Volume K Units Forecast, by Form 2019 & 2032
- Table 85: Global Reduced Fat Butter Market Revenue Million Forecast, by Distribution Channel 2019 & 2032
- Table 86: Global Reduced Fat Butter Market Volume K Units Forecast, by Distribution Channel 2019 & 2032
- Table 87: Global Reduced Fat Butter Market Revenue Million Forecast, by Country 2019 & 2032
- Table 88: Global Reduced Fat Butter Market Volume K Units Forecast, by Country 2019 & 2032
- Table 89: Spain Global Reduced Fat Butter Market Revenue (Million) Forecast, by Application 2019 & 2032
- Table 90: Spain Global Reduced Fat Butter Market Volume (K Units) Forecast, by Application 2019 & 2032
- Table 91: United Kingdom Global Reduced Fat Butter Market Revenue (Million) Forecast, by Application 2019 & 2032
- Table 92: United Kingdom Global Reduced Fat Butter Market Volume (K Units) Forecast, by Application 2019 & 2032
- Table 93: Germany Global Reduced Fat Butter Market Revenue (Million) Forecast, by Application 2019 & 2032
- Table 94: Germany Global Reduced Fat Butter Market Volume (K Units) Forecast, by Application 2019 & 2032
- Table 95: France Global Reduced Fat Butter Market Revenue (Million) Forecast, by Application 2019 & 2032
- Table 96: France Global Reduced Fat Butter Market Volume (K Units) Forecast, by Application 2019 & 2032
- Table 97: Italy Global Reduced Fat Butter Market Revenue (Million) Forecast, by Application 2019 & 2032
- Table 98: Italy Global Reduced Fat Butter Market Volume (K Units) Forecast, by Application 2019 & 2032
- Table 99: Russia Global Reduced Fat Butter Market Revenue (Million) Forecast, by Application 2019 & 2032
- Table 100: Russia Global Reduced Fat Butter Market Volume (K Units) Forecast, by Application 2019 & 2032
- Table 101: Rest of Europe Global Reduced Fat Butter Market Revenue (Million) Forecast, by Application 2019 & 2032
- Table 102: Rest of Europe Global Reduced Fat Butter Market Volume (K Units) Forecast, by Application 2019 & 2032
- Table 103: Global Reduced Fat Butter Market Revenue Million Forecast, by Type 2019 & 2032
- Table 104: Global Reduced Fat Butter Market Volume K Units Forecast, by Type 2019 & 2032
- Table 105: Global Reduced Fat Butter Market Revenue Million Forecast, by Form 2019 & 2032
- Table 106: Global Reduced Fat Butter Market Volume K Units Forecast, by Form 2019 & 2032
- Table 107: Global Reduced Fat Butter Market Revenue Million Forecast, by Distribution Channel 2019 & 2032
- Table 108: Global Reduced Fat Butter Market Volume K Units Forecast, by Distribution Channel 2019 & 2032
- Table 109: Global Reduced Fat Butter Market Revenue Million Forecast, by Country 2019 & 2032
- Table 110: Global Reduced Fat Butter Market Volume K Units Forecast, by Country 2019 & 2032
- Table 111: China Global Reduced Fat Butter Market Revenue (Million) Forecast, by Application 2019 & 2032
- Table 112: China Global Reduced Fat Butter Market Volume (K Units) Forecast, by Application 2019 & 2032
- Table 113: Japan Global Reduced Fat Butter Market Revenue (Million) Forecast, by Application 2019 & 2032
- Table 114: Japan Global Reduced Fat Butter Market Volume (K Units) Forecast, by Application 2019 & 2032
- Table 115: India Global Reduced Fat Butter Market Revenue (Million) Forecast, by Application 2019 & 2032
- Table 116: India Global Reduced Fat Butter Market Volume (K Units) Forecast, by Application 2019 & 2032
- Table 117: Australia Global Reduced Fat Butter Market Revenue (Million) Forecast, by Application 2019 & 2032
- Table 118: Australia Global Reduced Fat Butter Market Volume (K Units) Forecast, by Application 2019 & 2032
- Table 119: Rest of Asia Pacific Global Reduced Fat Butter Market Revenue (Million) Forecast, by Application 2019 & 2032
- Table 120: Rest of Asia Pacific Global Reduced Fat Butter Market Volume (K Units) Forecast, by Application 2019 & 2032
- Table 121: Global Reduced Fat Butter Market Revenue Million Forecast, by Type 2019 & 2032
- Table 122: Global Reduced Fat Butter Market Volume K Units Forecast, by Type 2019 & 2032
- Table 123: Global Reduced Fat Butter Market Revenue Million Forecast, by Form 2019 & 2032
- Table 124: Global Reduced Fat Butter Market Volume K Units Forecast, by Form 2019 & 2032
- Table 125: Global Reduced Fat Butter Market Revenue Million Forecast, by Distribution Channel 2019 & 2032
- Table 126: Global Reduced Fat Butter Market Volume K Units Forecast, by Distribution Channel 2019 & 2032
- Table 127: Global Reduced Fat Butter Market Revenue Million Forecast, by Country 2019 & 2032
- Table 128: Global Reduced Fat Butter Market Volume K Units Forecast, by Country 2019 & 2032
- Table 129: Brazil Global Reduced Fat Butter Market Revenue (Million) Forecast, by Application 2019 & 2032
- Table 130: Brazil Global Reduced Fat Butter Market Volume (K Units) Forecast, by Application 2019 & 2032
- Table 131: Argentina Global Reduced Fat Butter Market Revenue (Million) Forecast, by Application 2019 & 2032
- Table 132: Argentina Global Reduced Fat Butter Market Volume (K Units) Forecast, by Application 2019 & 2032
- Table 133: Rest of South America Global Reduced Fat Butter Market Revenue (Million) Forecast, by Application 2019 & 2032
- Table 134: Rest of South America Global Reduced Fat Butter Market Volume (K Units) Forecast, by Application 2019 & 2032
- Table 135: Global Reduced Fat Butter Market Revenue Million Forecast, by Type 2019 & 2032
- Table 136: Global Reduced Fat Butter Market Volume K Units Forecast, by Type 2019 & 2032
- Table 137: Global Reduced Fat Butter Market Revenue Million Forecast, by Form 2019 & 2032
- Table 138: Global Reduced Fat Butter Market Volume K Units Forecast, by Form 2019 & 2032
- Table 139: Global Reduced Fat Butter Market Revenue Million Forecast, by Distribution Channel 2019 & 2032
- Table 140: Global Reduced Fat Butter Market Volume K Units Forecast, by Distribution Channel 2019 & 2032
- Table 141: Global Reduced Fat Butter Market Revenue Million Forecast, by Country 2019 & 2032
- Table 142: Global Reduced Fat Butter Market Volume K Units Forecast, by Country 2019 & 2032
- Table 143: South Africa Global Reduced Fat Butter Market Revenue (Million) Forecast, by Application 2019 & 2032
- Table 144: South Africa Global Reduced Fat Butter Market Volume (K Units) Forecast, by Application 2019 & 2032
- Table 145: Saudi Arabia Global Reduced Fat Butter Market Revenue (Million) Forecast, by Application 2019 & 2032
- Table 146: Saudi Arabia Global Reduced Fat Butter Market Volume (K Units) Forecast, by Application 2019 & 2032
- Table 147: Rest of Middle East and Africa Global Reduced Fat Butter Market Revenue (Million) Forecast, by Application 2019 & 2032
- Table 148: Rest of Middle East and Africa Global Reduced Fat Butter Market Volume (K Units) Forecast, by Application 2019 & 2032
Frequently Asked Questions
1. What is the projected Compound Annual Growth Rate (CAGR) of the Global Reduced Fat Butter Market?
The projected CAGR is approximately 6.73%.
2. Which companies are prominent players in the Global Reduced Fat Butter Market?
Key companies in the market include Land O'Lakes Inc, Arla Foods, Finlandia Cheese Inc, Rockview Farms, GCMMF, Ornua Co-operative Limited, Raisio Group plc*List Not Exhaustive, Unilever (Upfield), SAVENCIA SA, Saputo Inc.
3. What are the main segments of the Global Reduced Fat Butter Market?
The market segments include Type, Form, Distribution Channel.
4. Can you provide details about the market size?
The market size is estimated to be USD XX Million as of 2022.
5. What are some drivers contributing to market growth?
Increasing application of Gelatin in healthcare and pharmaceutical sector.
6. What are the notable trends driving market growth?
Surge in Demand for Low Fat and Low Calorie Food Products.
7. Are there any restraints impacting market growth?
Rising demand for clean label products.
8. Can you provide examples of recent developments in the market?
N/A
9. What pricing options are available for accessing the report?
Pricing options include single-user, multi-user, and enterprise licenses priced at USD 4750, USD 5250, and USD 8750 respectively.
10. Is the market size provided in terms of value or volume?
The market size is provided in terms of value, measured in Million and volume, measured in K Units.
11. Are there any specific market keywords associated with the report?
Yes, the market keyword associated with the report is "Global Reduced Fat Butter Market," which aids in identifying and referencing the specific market segment covered.
12. How do I determine which pricing option suits my needs best?
The pricing options vary based on user requirements and access needs. Individual users may opt for single-user licenses, while businesses requiring broader access may choose multi-user or enterprise licenses for cost-effective access to the report.
13. Are there any additional resources or data provided in the Global Reduced Fat Butter Market report?
While the report offers comprehensive insights, it's advisable to review the specific contents or supplementary materials provided to ascertain if additional resources or data are available.
14. How can I stay updated on further developments or reports in the Global Reduced Fat Butter Market?
To stay informed about further developments, trends, and reports in the Global Reduced Fat Butter Market, consider subscribing to industry newsletters, following relevant companies and organizations, or regularly checking reputable industry news sources and publications.
Methodology
Step 1 - Identification of Relevant Samples Size from Population Database


Step 2 - Approaches for Defining Global Market Size (Value, Volume* & Price*)

Note*: In applicable scenarios
Step 3 - Data Sources
Primary Research
- Web Analytics
- Survey Reports
- Research Institute
- Latest Research Reports
- Opinion Leaders
Secondary Research
- Annual Reports
- White Paper
- Latest Press Release
- Industry Association
- Paid Database
- Investor Presentations

Step 4 - Data Triangulation
Involves using different sources of information in order to increase the validity of a study
These sources are likely to be stakeholders in a program - participants, other researchers, program staff, other community members, and so on.
Then we put all data in single framework & apply various statistical tools to find out the dynamic on the market.
During the analysis stage, feedback from the stakeholder groups would be compared to determine areas of agreement as well as areas of divergence


