
Key Insights
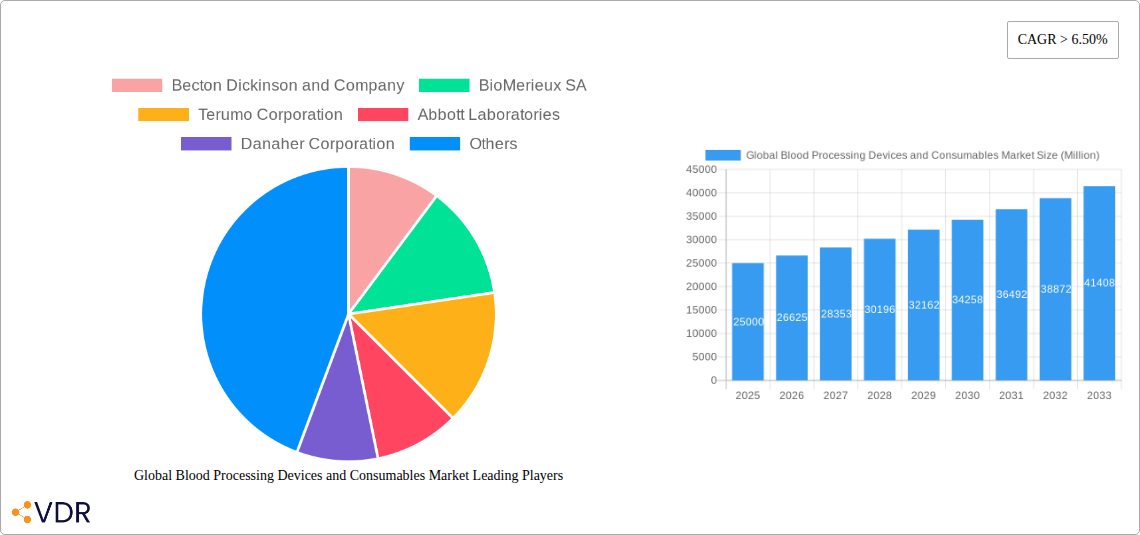
The global blood processing devices and consumables market is experiencing robust growth, driven by a confluence of factors. Technological advancements in blood collection, processing, and storage technologies are leading to improved efficiency and safety, increasing adoption in hospitals and diagnostic laboratories worldwide. The rising prevalence of chronic diseases like blood cancers and hematological disorders necessitates sophisticated blood processing solutions, further fueling market expansion. Increasing demand for point-of-care testing and personalized medicine is also contributing to market growth, particularly for portable and user-friendly devices. The market is segmented into devices (including blood collection tubes, centrifuges, automated systems) and consumables (reagents, anticoagulants, and storage solutions). Hospitals and clinics currently represent the largest end-user segment, followed by diagnostic laboratories. However, the "other end users" segment, including blood banks and transfusion centers, is expected to show significant growth due to increasing demand for safe and efficient blood management practices. While regulatory hurdles and high initial investment costs pose some challenges, the overall market outlook remains positive, with a projected Compound Annual Growth Rate (CAGR) exceeding 6.50% from 2025 to 2033. The competitive landscape is characterized by established players like Becton Dickinson, BioMerieux, and Abbott, alongside several other key players vying for market share through innovation and strategic partnerships. Geographic growth is expected across all regions, with North America and Europe maintaining significant market shares due to advanced healthcare infrastructure and high adoption rates, while Asia-Pacific is projected to witness rapid growth driven by increasing healthcare expenditure and rising awareness of blood-related diseases.
The market's future growth trajectory is intricately linked to several key trends. The increasing focus on automation and digitalization within blood processing workflows is expected to drive demand for automated systems and connected devices. Moreover, the rising adoption of advanced technologies like cell separation and fractionation technologies is boosting the market's growth. The development of novel anticoagulants and improved storage solutions is also expected to positively influence the market. However, potential restraints include the stringent regulatory landscape associated with medical devices and consumables, and the associated high costs involved in product development and approval. Further challenges include the need for skilled personnel to operate advanced equipment and the potential for variations in reimbursement policies across different healthcare systems globally. Nevertheless, the long-term market prognosis remains optimistic, driven by continued technological innovation and the pressing need for efficient and reliable blood processing solutions to meet the rising global demand.
Global Blood Processing Devices and Consumables Market: A Comprehensive Report (2019-2033)
This comprehensive report provides an in-depth analysis of the global blood processing devices and consumables market, offering valuable insights for industry professionals, investors, and strategic decision-makers. The study covers the period from 2019 to 2033, with 2025 serving as the base and estimated year. The report meticulously examines market dynamics, growth trends, regional dominance, product landscape, key players, and emerging opportunities within this vital sector. The parent market encompasses the broader medical devices industry, while the child market focuses specifically on blood processing technologies and consumables.
Keywords: Blood Processing Devices, Blood Processing Consumables, Medical Devices Market, Diagnostic Devices, In Vitro Diagnostics, Blood Collection Devices, Blood Analysis, Hospitals, Clinics, Diagnostic Laboratories, Becton Dickinson, BioMerieux, Terumo, Abbott Laboratories, Danaher, Roche, Bio-Rad, Haemonetics, Immucor, Grifols, Thermogenesis, Macopharma, Beurer.
Global Blood Processing Devices and Consumables Market Dynamics & Structure
The global blood processing devices and consumables market exhibits a moderately concentrated structure, with key players holding significant market shares. The market is characterized by continuous technological innovation, driven by the demand for improved accuracy, efficiency, and automation in blood processing procedures. Stringent regulatory frameworks, particularly concerning safety and efficacy, significantly impact market dynamics. While some substitute technologies exist (e.g., alternative diagnostic methods), the overall reliance on blood processing remains strong. The end-user demographic is primarily composed of hospitals and clinics, followed by diagnostic laboratories and other end-users. The market has witnessed several mergers and acquisitions (M&A) in recent years, indicating a trend towards consolidation and expansion.
- Market Concentration: Top 5 players hold approximately xx% market share (2025).
- Technological Innovation: Focus on automation, miniaturization, and point-of-care diagnostics.
- Regulatory Landscape: Stringent FDA and other regional regulatory approvals required.
- Competitive Substitutes: Limited direct substitutes, but alternative diagnostic approaches exert indirect pressure.
- M&A Activity: xx M&A deals recorded between 2019-2024, with an average deal value of xx Million.
- Innovation Barriers: High R&D costs, stringent regulatory pathways, and intellectual property protection.
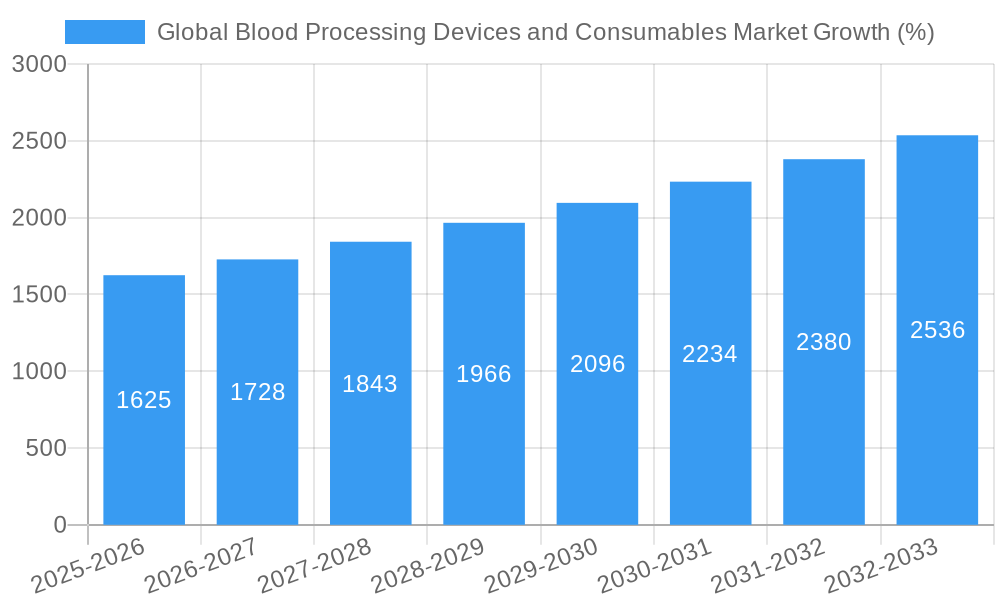
Global Blood Processing Devices and Consumables Market Growth Trends & Insights
The global blood processing devices and consumables market experienced robust growth during the historical period (2019-2024), driven by increasing prevalence of chronic diseases, rising geriatric population, and technological advancements. The market size reached xx Million in 2024, with a CAGR of xx% during this period. Adoption rates are increasing steadily across various end-users, particularly in developing economies where healthcare infrastructure is improving. Technological disruptions, such as the introduction of automated systems and point-of-care devices, are accelerating market growth. Shifting consumer behavior towards personalized medicine and preventive healthcare is also influencing market demand. The forecast period (2025-2033) projects continued expansion, reaching xx Million by 2033, with a projected CAGR of xx%. Market penetration is expected to increase significantly, particularly in emerging markets.
Dominant Regions, Countries, or Segments in Global Blood Processing Devices and Consumables Market
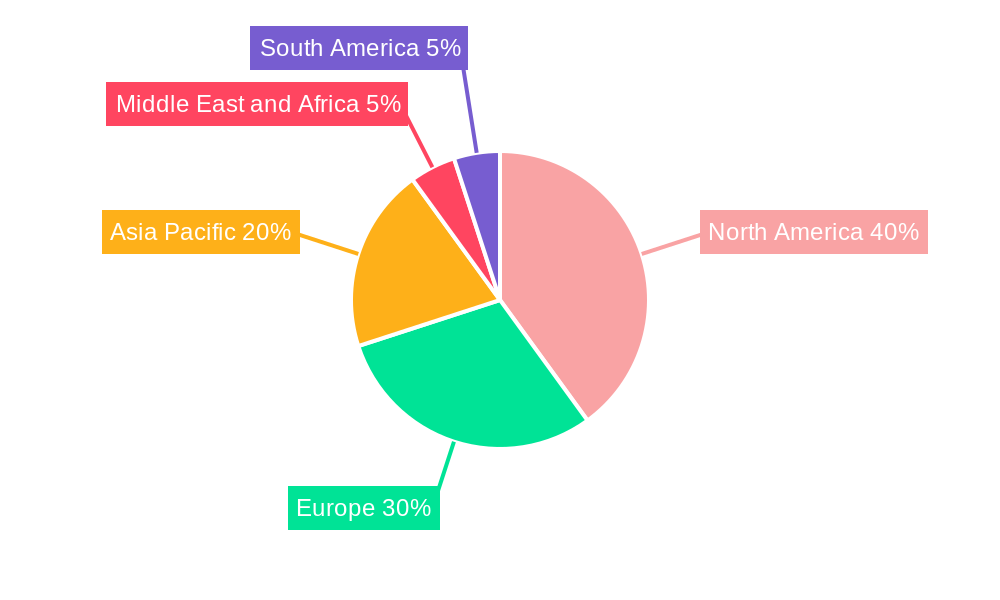
North America currently holds the largest market share, driven by high healthcare expenditure, advanced healthcare infrastructure, and a large number of diagnostic laboratories. Europe follows closely, with a strong presence of key market players and well-established healthcare systems. However, the Asia-Pacific region demonstrates significant growth potential, fueled by rising healthcare expenditure, increasing prevalence of chronic diseases, and expanding healthcare infrastructure.
Product Segment: Devices currently dominate the market share (xx%), however, Consumables segment is witnessing faster growth (xx% CAGR).
End-User Segment: Hospitals and Clinics represent the largest end-user segment (xx%), followed by Diagnostic Laboratories (xx%).
- North America: High adoption rates of advanced technologies, robust healthcare infrastructure.
- Europe: Strong regulatory framework, presence of major market players, well-developed healthcare systems.
- Asia-Pacific: High growth potential, increasing healthcare expenditure, rising prevalence of chronic diseases.
- Hospitals & Clinics: Highest demand for advanced devices and consumables, due to high throughput requirements.
- Diagnostic Laboratories: High volume testing necessitates specialized, high-throughput devices.
Global Blood Processing Devices and Consumables Market Product Landscape
The market offers a wide range of blood processing devices and consumables, including blood collection tubes, centrifuges, automated analyzers, and reagents. Recent innovations focus on improving efficiency, reducing sample volume requirements, and enhancing diagnostic accuracy. These advancements include miniaturized devices, point-of-care testing systems, and integrated platforms for automated workflows. Unique selling propositions include improved speed, accuracy, and ease of use, coupled with reduced costs and enhanced safety features.
Key Drivers, Barriers & Challenges in Global Blood Processing Devices and Consumables Market
Key Drivers:
- Increasing prevalence of chronic diseases driving demand for diagnostic testing.
- Technological advancements leading to improved accuracy, efficiency, and automation.
- Growing demand for point-of-care testing, particularly in remote areas.
Key Barriers and Challenges:
- High cost of advanced technologies restricting market access in developing economies.
- Stringent regulatory pathways and approvals causing delays in product launches.
- Intense competition among established players and emerging companies, leading to price pressure.
- Supply chain disruptions affecting the availability of essential components and consumables. (Quantifiable impact: xx% increase in prices during 2022 due to supply chain issues).
Emerging Opportunities in Global Blood Processing Devices and Consumables Market
- Expansion into untapped markets in developing countries with growing healthcare infrastructure.
- Development of novel point-of-care diagnostic devices for use in remote areas and resource-limited settings.
- Growing demand for personalized medicine driving the development of customized blood processing solutions.
- Increasing focus on preventive healthcare and early disease detection through improved diagnostics.
Growth Accelerators in the Global Blood Processing Devices and Consumables Market Industry
Technological breakthroughs, particularly in automation and miniaturization, are driving significant advancements in blood processing capabilities. Strategic partnerships between manufacturers and healthcare providers accelerate market penetration and product adoption. Expansion into emerging markets, particularly in Asia-Pacific, creates significant growth opportunities.
Key Players Shaping the Global Blood Processing Devices and Consumables Market Market
- Becton Dickinson and Company
- BioMerieux SA
- Terumo Corporation
- Abbott Laboratories
- Danaher Corporation
- Roche Holdings AG
- Bio-Rad Laboratories
- Haemonetics Corporation
- Immucor Inc
- Grifols International
- Thermogenesis Corporation
- Macopharma SA
- Beurer GmbH
Notable Milestones in Global Blood Processing Devices and Consumables Market Sector
- July 2022: Rhinostics launched the patent-pending VERIstic Collection Device for small-volume blood collection, improving automation in sample collection.
- May 2022: Vitestro introduced an autonomous blood collection device, empowering patients with self-efficacy during venipuncture.
In-Depth Global Blood Processing Devices and Consumables Market Market Outlook
The future of the global blood processing devices and consumables market is bright, driven by technological advancements, increasing demand for improved diagnostics, and expansion into emerging markets. Strategic partnerships, product innovation, and a focus on personalized medicine will shape market dynamics over the next decade. The market is poised for significant growth, presenting considerable opportunities for established players and emerging companies alike. Continued investment in R&D and a focus on addressing key challenges, such as supply chain disruptions, will be crucial for long-term success.
Global Blood Processing Devices and Consumables Market Segmentation
-
1. Product
-
1.1. By Blood Processing Devices
- 1.1.1. Blood Bank Freezers
- 1.1.2. Blood Grouping Analyzers
- 1.1.3. Blood Warmer
- 1.1.4. Blood Cell Processers
- 1.1.5. Other Blood Processing Devices
-
1.2. By Blood Processing Consumables
- 1.2.1. Blood Bags
- 1.2.2. Blood Lancets
- 1.2.3. Vials
- 1.2.4. Blood Administration Sets
- 1.2.5. Other Blood Processing Consumables
-
1.1. By Blood Processing Devices
-
2. End User
- 2.1. Hospitals and Clinics
- 2.2. Diagnostic Laboratories
- 2.3. Other End Users
Global Blood Processing Devices and Consumables Market Segmentation By Geography
-
1. North America
- 1.1. United States
- 1.2. Canada
- 1.3. Mexico
-
2. Europe
- 2.1. Germany
- 2.2. United Kingdom
- 2.3. France
- 2.4. Italy
- 2.5. Spain
- 2.6. Rest of Europe
-
3. Asia Pacific
- 3.1. China
- 3.2. Japan
- 3.3. India
- 3.4. Australia
- 3.5. South Korea
- 3.6. Rest of Asia Pacific
-
4. Middle East and Africa
- 4.1. GCC
- 4.2. South Africa
- 4.3. Rest of Middle East and Africa
-
5. South America
- 5.1. Brazil
- 5.2. Argentina
- 5.3. Rest of South America
Global Blood Processing Devices and Consumables Market REPORT HIGHLIGHTS
| Aspects | Details |
|---|---|
| Study Period | 2019-2033 |
| Base Year | 2024 |
| Estimated Year | 2025 |
| Forecast Period | 2025-2033 |
| Historical Period | 2019-2024 |
| Growth Rate | CAGR of > 6.50% from 2019-2033 |
| Segmentation |
|
Table of Contents
- 1. Introduction
- 1.1. Research Scope
- 1.2. Market Segmentation
- 1.3. Research Methodology
- 1.4. Definitions and Assumptions
- 2. Executive Summary
- 2.1. Introduction
- 3. Market Dynamics
- 3.1. Introduction
- 3.2. Market Drivers
- 3.2.1. Rising Prevenlance of Infectious Disorders Involving Blood Transfusions and Surgical Treatment; Growing Number of Initiatives in Regenerative Medicine and Cell Therapies; Increasing Geriatric Population
- 3.3. Market Restrains
- 3.3.1. Stringent Regulations; High Cost of Blood Processing Devices
- 3.4. Market Trends
- 3.4.1. Blood Cell Processors Segment is Expected to Hold a Major Market Share in the Blood Processing Devices and Consumables Market
- 4. Market Factor Analysis
- 4.1. Porters Five Forces
- 4.2. Supply/Value Chain
- 4.3. PESTEL analysis
- 4.4. Market Entropy
- 4.5. Patent/Trademark Analysis
- 5. Global Blood Processing Devices and Consumables Market Analysis, Insights and Forecast, 2019-2031
- 5.1. Market Analysis, Insights and Forecast - by Product
- 5.1.1. By Blood Processing Devices
- 5.1.1.1. Blood Bank Freezers
- 5.1.1.2. Blood Grouping Analyzers
- 5.1.1.3. Blood Warmer
- 5.1.1.4. Blood Cell Processers
- 5.1.1.5. Other Blood Processing Devices
- 5.1.2. By Blood Processing Consumables
- 5.1.2.1. Blood Bags
- 5.1.2.2. Blood Lancets
- 5.1.2.3. Vials
- 5.1.2.4. Blood Administration Sets
- 5.1.2.5. Other Blood Processing Consumables
- 5.1.1. By Blood Processing Devices
- 5.2. Market Analysis, Insights and Forecast - by End User
- 5.2.1. Hospitals and Clinics
- 5.2.2. Diagnostic Laboratories
- 5.2.3. Other End Users
- 5.3. Market Analysis, Insights and Forecast - by Region
- 5.3.1. North America
- 5.3.2. Europe
- 5.3.3. Asia Pacific
- 5.3.4. Middle East and Africa
- 5.3.5. South America
- 5.1. Market Analysis, Insights and Forecast - by Product
- 6. North America Global Blood Processing Devices and Consumables Market Analysis, Insights and Forecast, 2019-2031
- 6.1. Market Analysis, Insights and Forecast - by Product
- 6.1.1. By Blood Processing Devices
- 6.1.1.1. Blood Bank Freezers
- 6.1.1.2. Blood Grouping Analyzers
- 6.1.1.3. Blood Warmer
- 6.1.1.4. Blood Cell Processers
- 6.1.1.5. Other Blood Processing Devices
- 6.1.2. By Blood Processing Consumables
- 6.1.2.1. Blood Bags
- 6.1.2.2. Blood Lancets
- 6.1.2.3. Vials
- 6.1.2.4. Blood Administration Sets
- 6.1.2.5. Other Blood Processing Consumables
- 6.1.1. By Blood Processing Devices
- 6.2. Market Analysis, Insights and Forecast - by End User
- 6.2.1. Hospitals and Clinics
- 6.2.2. Diagnostic Laboratories
- 6.2.3. Other End Users
- 6.1. Market Analysis, Insights and Forecast - by Product
- 7. Europe Global Blood Processing Devices and Consumables Market Analysis, Insights and Forecast, 2019-2031
- 7.1. Market Analysis, Insights and Forecast - by Product
- 7.1.1. By Blood Processing Devices
- 7.1.1.1. Blood Bank Freezers
- 7.1.1.2. Blood Grouping Analyzers
- 7.1.1.3. Blood Warmer
- 7.1.1.4. Blood Cell Processers
- 7.1.1.5. Other Blood Processing Devices
- 7.1.2. By Blood Processing Consumables
- 7.1.2.1. Blood Bags
- 7.1.2.2. Blood Lancets
- 7.1.2.3. Vials
- 7.1.2.4. Blood Administration Sets
- 7.1.2.5. Other Blood Processing Consumables
- 7.1.1. By Blood Processing Devices
- 7.2. Market Analysis, Insights and Forecast - by End User
- 7.2.1. Hospitals and Clinics
- 7.2.2. Diagnostic Laboratories
- 7.2.3. Other End Users
- 7.1. Market Analysis, Insights and Forecast - by Product
- 8. Asia Pacific Global Blood Processing Devices and Consumables Market Analysis, Insights and Forecast, 2019-2031
- 8.1. Market Analysis, Insights and Forecast - by Product
- 8.1.1. By Blood Processing Devices
- 8.1.1.1. Blood Bank Freezers
- 8.1.1.2. Blood Grouping Analyzers
- 8.1.1.3. Blood Warmer
- 8.1.1.4. Blood Cell Processers
- 8.1.1.5. Other Blood Processing Devices
- 8.1.2. By Blood Processing Consumables
- 8.1.2.1. Blood Bags
- 8.1.2.2. Blood Lancets
- 8.1.2.3. Vials
- 8.1.2.4. Blood Administration Sets
- 8.1.2.5. Other Blood Processing Consumables
- 8.1.1. By Blood Processing Devices
- 8.2. Market Analysis, Insights and Forecast - by End User
- 8.2.1. Hospitals and Clinics
- 8.2.2. Diagnostic Laboratories
- 8.2.3. Other End Users
- 8.1. Market Analysis, Insights and Forecast - by Product
- 9. Middle East and Africa Global Blood Processing Devices and Consumables Market Analysis, Insights and Forecast, 2019-2031
- 9.1. Market Analysis, Insights and Forecast - by Product
- 9.1.1. By Blood Processing Devices
- 9.1.1.1. Blood Bank Freezers
- 9.1.1.2. Blood Grouping Analyzers
- 9.1.1.3. Blood Warmer
- 9.1.1.4. Blood Cell Processers
- 9.1.1.5. Other Blood Processing Devices
- 9.1.2. By Blood Processing Consumables
- 9.1.2.1. Blood Bags
- 9.1.2.2. Blood Lancets
- 9.1.2.3. Vials
- 9.1.2.4. Blood Administration Sets
- 9.1.2.5. Other Blood Processing Consumables
- 9.1.1. By Blood Processing Devices
- 9.2. Market Analysis, Insights and Forecast - by End User
- 9.2.1. Hospitals and Clinics
- 9.2.2. Diagnostic Laboratories
- 9.2.3. Other End Users
- 9.1. Market Analysis, Insights and Forecast - by Product
- 10. South America Global Blood Processing Devices and Consumables Market Analysis, Insights and Forecast, 2019-2031
- 10.1. Market Analysis, Insights and Forecast - by Product
- 10.1.1. By Blood Processing Devices
- 10.1.1.1. Blood Bank Freezers
- 10.1.1.2. Blood Grouping Analyzers
- 10.1.1.3. Blood Warmer
- 10.1.1.4. Blood Cell Processers
- 10.1.1.5. Other Blood Processing Devices
- 10.1.2. By Blood Processing Consumables
- 10.1.2.1. Blood Bags
- 10.1.2.2. Blood Lancets
- 10.1.2.3. Vials
- 10.1.2.4. Blood Administration Sets
- 10.1.2.5. Other Blood Processing Consumables
- 10.1.1. By Blood Processing Devices
- 10.2. Market Analysis, Insights and Forecast - by End User
- 10.2.1. Hospitals and Clinics
- 10.2.2. Diagnostic Laboratories
- 10.2.3. Other End Users
- 10.1. Market Analysis, Insights and Forecast - by Product
- 11. North America Global Blood Processing Devices and Consumables Market Analysis, Insights and Forecast, 2019-2031
- 11.1. Market Analysis, Insights and Forecast - By Country/Sub-region
- 11.1.1 United States
- 11.1.2 Canada
- 11.1.3 Mexico
- 12. Europe Global Blood Processing Devices and Consumables Market Analysis, Insights and Forecast, 2019-2031
- 12.1. Market Analysis, Insights and Forecast - By Country/Sub-region
- 12.1.1 Germany
- 12.1.2 United Kingdom
- 12.1.3 France
- 12.1.4 Italy
- 12.1.5 Spain
- 12.1.6 Rest of Europe
- 13. Asia Pacific Global Blood Processing Devices and Consumables Market Analysis, Insights and Forecast, 2019-2031
- 13.1. Market Analysis, Insights and Forecast - By Country/Sub-region
- 13.1.1 China
- 13.1.2 Japan
- 13.1.3 India
- 13.1.4 Australia
- 13.1.5 South Korea
- 13.1.6 Rest of Asia Pacific
- 14. Middle East and Africa Global Blood Processing Devices and Consumables Market Analysis, Insights and Forecast, 2019-2031
- 14.1. Market Analysis, Insights and Forecast - By Country/Sub-region
- 14.1.1 GCC
- 14.1.2 South Africa
- 14.1.3 Rest of Middle East and Africa
- 15. South America Global Blood Processing Devices and Consumables Market Analysis, Insights and Forecast, 2019-2031
- 15.1. Market Analysis, Insights and Forecast - By Country/Sub-region
- 15.1.1 Brazil
- 15.1.2 Argentina
- 15.1.3 Rest of South America
- 16. Competitive Analysis
- 16.1. Market Share Analysis 2024
- 16.2. Company Profiles
- 16.2.1 Becton Dickinson and Company
- 16.2.1.1. Overview
- 16.2.1.2. Products
- 16.2.1.3. SWOT Analysis
- 16.2.1.4. Recent Developments
- 16.2.1.5. Financials (Based on Availability)
- 16.2.2 BioMerieux SA
- 16.2.2.1. Overview
- 16.2.2.2. Products
- 16.2.2.3. SWOT Analysis
- 16.2.2.4. Recent Developments
- 16.2.2.5. Financials (Based on Availability)
- 16.2.3 Terumo Corporation
- 16.2.3.1. Overview
- 16.2.3.2. Products
- 16.2.3.3. SWOT Analysis
- 16.2.3.4. Recent Developments
- 16.2.3.5. Financials (Based on Availability)
- 16.2.4 Abbott Laboratories
- 16.2.4.1. Overview
- 16.2.4.2. Products
- 16.2.4.3. SWOT Analysis
- 16.2.4.4. Recent Developments
- 16.2.4.5. Financials (Based on Availability)
- 16.2.5 Danaher Corporation
- 16.2.5.1. Overview
- 16.2.5.2. Products
- 16.2.5.3. SWOT Analysis
- 16.2.5.4. Recent Developments
- 16.2.5.5. Financials (Based on Availability)
- 16.2.6 Roche Holdings AG
- 16.2.6.1. Overview
- 16.2.6.2. Products
- 16.2.6.3. SWOT Analysis
- 16.2.6.4. Recent Developments
- 16.2.6.5. Financials (Based on Availability)
- 16.2.7 Bio-Rad Laboratories
- 16.2.7.1. Overview
- 16.2.7.2. Products
- 16.2.7.3. SWOT Analysis
- 16.2.7.4. Recent Developments
- 16.2.7.5. Financials (Based on Availability)
- 16.2.8 Haemonetics Corporation
- 16.2.8.1. Overview
- 16.2.8.2. Products
- 16.2.8.3. SWOT Analysis
- 16.2.8.4. Recent Developments
- 16.2.8.5. Financials (Based on Availability)
- 16.2.9 Immucor Inc
- 16.2.9.1. Overview
- 16.2.9.2. Products
- 16.2.9.3. SWOT Analysis
- 16.2.9.4. Recent Developments
- 16.2.9.5. Financials (Based on Availability)
- 16.2.10 Grifols International
- 16.2.10.1. Overview
- 16.2.10.2. Products
- 16.2.10.3. SWOT Analysis
- 16.2.10.4. Recent Developments
- 16.2.10.5. Financials (Based on Availability)
- 16.2.11 Thermogenesis Corporation
- 16.2.11.1. Overview
- 16.2.11.2. Products
- 16.2.11.3. SWOT Analysis
- 16.2.11.4. Recent Developments
- 16.2.11.5. Financials (Based on Availability)
- 16.2.12 Macopharma SA Beurer GmbH
- 16.2.12.1. Overview
- 16.2.12.2. Products
- 16.2.12.3. SWOT Analysis
- 16.2.12.4. Recent Developments
- 16.2.12.5. Financials (Based on Availability)
- 16.2.1 Becton Dickinson and Company
List of Figures
- Figure 1: Global Global Blood Processing Devices and Consumables Market Revenue Breakdown (Million, %) by Region 2024 & 2032
- Figure 2: Global Global Blood Processing Devices and Consumables Market Volume Breakdown (K Units, %) by Region 2024 & 2032
- Figure 3: North America Global Blood Processing Devices and Consumables Market Revenue (Million), by Country 2024 & 2032
- Figure 4: North America Global Blood Processing Devices and Consumables Market Volume (K Units), by Country 2024 & 2032
- Figure 5: North America Global Blood Processing Devices and Consumables Market Revenue Share (%), by Country 2024 & 2032
- Figure 6: North America Global Blood Processing Devices and Consumables Market Volume Share (%), by Country 2024 & 2032
- Figure 7: Europe Global Blood Processing Devices and Consumables Market Revenue (Million), by Country 2024 & 2032
- Figure 8: Europe Global Blood Processing Devices and Consumables Market Volume (K Units), by Country 2024 & 2032
- Figure 9: Europe Global Blood Processing Devices and Consumables Market Revenue Share (%), by Country 2024 & 2032
- Figure 10: Europe Global Blood Processing Devices and Consumables Market Volume Share (%), by Country 2024 & 2032
- Figure 11: Asia Pacific Global Blood Processing Devices and Consumables Market Revenue (Million), by Country 2024 & 2032
- Figure 12: Asia Pacific Global Blood Processing Devices and Consumables Market Volume (K Units), by Country 2024 & 2032
- Figure 13: Asia Pacific Global Blood Processing Devices and Consumables Market Revenue Share (%), by Country 2024 & 2032
- Figure 14: Asia Pacific Global Blood Processing Devices and Consumables Market Volume Share (%), by Country 2024 & 2032
- Figure 15: Middle East and Africa Global Blood Processing Devices and Consumables Market Revenue (Million), by Country 2024 & 2032
- Figure 16: Middle East and Africa Global Blood Processing Devices and Consumables Market Volume (K Units), by Country 2024 & 2032
- Figure 17: Middle East and Africa Global Blood Processing Devices and Consumables Market Revenue Share (%), by Country 2024 & 2032
- Figure 18: Middle East and Africa Global Blood Processing Devices and Consumables Market Volume Share (%), by Country 2024 & 2032
- Figure 19: South America Global Blood Processing Devices and Consumables Market Revenue (Million), by Country 2024 & 2032
- Figure 20: South America Global Blood Processing Devices and Consumables Market Volume (K Units), by Country 2024 & 2032
- Figure 21: South America Global Blood Processing Devices and Consumables Market Revenue Share (%), by Country 2024 & 2032
- Figure 22: South America Global Blood Processing Devices and Consumables Market Volume Share (%), by Country 2024 & 2032
- Figure 23: North America Global Blood Processing Devices and Consumables Market Revenue (Million), by Product 2024 & 2032
- Figure 24: North America Global Blood Processing Devices and Consumables Market Volume (K Units), by Product 2024 & 2032
- Figure 25: North America Global Blood Processing Devices and Consumables Market Revenue Share (%), by Product 2024 & 2032
- Figure 26: North America Global Blood Processing Devices and Consumables Market Volume Share (%), by Product 2024 & 2032
- Figure 27: North America Global Blood Processing Devices and Consumables Market Revenue (Million), by End User 2024 & 2032
- Figure 28: North America Global Blood Processing Devices and Consumables Market Volume (K Units), by End User 2024 & 2032
- Figure 29: North America Global Blood Processing Devices and Consumables Market Revenue Share (%), by End User 2024 & 2032
- Figure 30: North America Global Blood Processing Devices and Consumables Market Volume Share (%), by End User 2024 & 2032
- Figure 31: North America Global Blood Processing Devices and Consumables Market Revenue (Million), by Country 2024 & 2032
- Figure 32: North America Global Blood Processing Devices and Consumables Market Volume (K Units), by Country 2024 & 2032
- Figure 33: North America Global Blood Processing Devices and Consumables Market Revenue Share (%), by Country 2024 & 2032
- Figure 34: North America Global Blood Processing Devices and Consumables Market Volume Share (%), by Country 2024 & 2032
- Figure 35: Europe Global Blood Processing Devices and Consumables Market Revenue (Million), by Product 2024 & 2032
- Figure 36: Europe Global Blood Processing Devices and Consumables Market Volume (K Units), by Product 2024 & 2032
- Figure 37: Europe Global Blood Processing Devices and Consumables Market Revenue Share (%), by Product 2024 & 2032
- Figure 38: Europe Global Blood Processing Devices and Consumables Market Volume Share (%), by Product 2024 & 2032
- Figure 39: Europe Global Blood Processing Devices and Consumables Market Revenue (Million), by End User 2024 & 2032
- Figure 40: Europe Global Blood Processing Devices and Consumables Market Volume (K Units), by End User 2024 & 2032
- Figure 41: Europe Global Blood Processing Devices and Consumables Market Revenue Share (%), by End User 2024 & 2032
- Figure 42: Europe Global Blood Processing Devices and Consumables Market Volume Share (%), by End User 2024 & 2032
- Figure 43: Europe Global Blood Processing Devices and Consumables Market Revenue (Million), by Country 2024 & 2032
- Figure 44: Europe Global Blood Processing Devices and Consumables Market Volume (K Units), by Country 2024 & 2032
- Figure 45: Europe Global Blood Processing Devices and Consumables Market Revenue Share (%), by Country 2024 & 2032
- Figure 46: Europe Global Blood Processing Devices and Consumables Market Volume Share (%), by Country 2024 & 2032
- Figure 47: Asia Pacific Global Blood Processing Devices and Consumables Market Revenue (Million), by Product 2024 & 2032
- Figure 48: Asia Pacific Global Blood Processing Devices and Consumables Market Volume (K Units), by Product 2024 & 2032
- Figure 49: Asia Pacific Global Blood Processing Devices and Consumables Market Revenue Share (%), by Product 2024 & 2032
- Figure 50: Asia Pacific Global Blood Processing Devices and Consumables Market Volume Share (%), by Product 2024 & 2032
- Figure 51: Asia Pacific Global Blood Processing Devices and Consumables Market Revenue (Million), by End User 2024 & 2032
- Figure 52: Asia Pacific Global Blood Processing Devices and Consumables Market Volume (K Units), by End User 2024 & 2032
- Figure 53: Asia Pacific Global Blood Processing Devices and Consumables Market Revenue Share (%), by End User 2024 & 2032
- Figure 54: Asia Pacific Global Blood Processing Devices and Consumables Market Volume Share (%), by End User 2024 & 2032
- Figure 55: Asia Pacific Global Blood Processing Devices and Consumables Market Revenue (Million), by Country 2024 & 2032
- Figure 56: Asia Pacific Global Blood Processing Devices and Consumables Market Volume (K Units), by Country 2024 & 2032
- Figure 57: Asia Pacific Global Blood Processing Devices and Consumables Market Revenue Share (%), by Country 2024 & 2032
- Figure 58: Asia Pacific Global Blood Processing Devices and Consumables Market Volume Share (%), by Country 2024 & 2032
- Figure 59: Middle East and Africa Global Blood Processing Devices and Consumables Market Revenue (Million), by Product 2024 & 2032
- Figure 60: Middle East and Africa Global Blood Processing Devices and Consumables Market Volume (K Units), by Product 2024 & 2032
- Figure 61: Middle East and Africa Global Blood Processing Devices and Consumables Market Revenue Share (%), by Product 2024 & 2032
- Figure 62: Middle East and Africa Global Blood Processing Devices and Consumables Market Volume Share (%), by Product 2024 & 2032
- Figure 63: Middle East and Africa Global Blood Processing Devices and Consumables Market Revenue (Million), by End User 2024 & 2032
- Figure 64: Middle East and Africa Global Blood Processing Devices and Consumables Market Volume (K Units), by End User 2024 & 2032
- Figure 65: Middle East and Africa Global Blood Processing Devices and Consumables Market Revenue Share (%), by End User 2024 & 2032
- Figure 66: Middle East and Africa Global Blood Processing Devices and Consumables Market Volume Share (%), by End User 2024 & 2032
- Figure 67: Middle East and Africa Global Blood Processing Devices and Consumables Market Revenue (Million), by Country 2024 & 2032
- Figure 68: Middle East and Africa Global Blood Processing Devices and Consumables Market Volume (K Units), by Country 2024 & 2032
- Figure 69: Middle East and Africa Global Blood Processing Devices and Consumables Market Revenue Share (%), by Country 2024 & 2032
- Figure 70: Middle East and Africa Global Blood Processing Devices and Consumables Market Volume Share (%), by Country 2024 & 2032
- Figure 71: South America Global Blood Processing Devices and Consumables Market Revenue (Million), by Product 2024 & 2032
- Figure 72: South America Global Blood Processing Devices and Consumables Market Volume (K Units), by Product 2024 & 2032
- Figure 73: South America Global Blood Processing Devices and Consumables Market Revenue Share (%), by Product 2024 & 2032
- Figure 74: South America Global Blood Processing Devices and Consumables Market Volume Share (%), by Product 2024 & 2032
- Figure 75: South America Global Blood Processing Devices and Consumables Market Revenue (Million), by End User 2024 & 2032
- Figure 76: South America Global Blood Processing Devices and Consumables Market Volume (K Units), by End User 2024 & 2032
- Figure 77: South America Global Blood Processing Devices and Consumables Market Revenue Share (%), by End User 2024 & 2032
- Figure 78: South America Global Blood Processing Devices and Consumables Market Volume Share (%), by End User 2024 & 2032
- Figure 79: South America Global Blood Processing Devices and Consumables Market Revenue (Million), by Country 2024 & 2032
- Figure 80: South America Global Blood Processing Devices and Consumables Market Volume (K Units), by Country 2024 & 2032
- Figure 81: South America Global Blood Processing Devices and Consumables Market Revenue Share (%), by Country 2024 & 2032
- Figure 82: South America Global Blood Processing Devices and Consumables Market Volume Share (%), by Country 2024 & 2032
List of Tables
- Table 1: Global Blood Processing Devices and Consumables Market Revenue Million Forecast, by Region 2019 & 2032
- Table 2: Global Blood Processing Devices and Consumables Market Volume K Units Forecast, by Region 2019 & 2032
- Table 3: Global Blood Processing Devices and Consumables Market Revenue Million Forecast, by Product 2019 & 2032
- Table 4: Global Blood Processing Devices and Consumables Market Volume K Units Forecast, by Product 2019 & 2032
- Table 5: Global Blood Processing Devices and Consumables Market Revenue Million Forecast, by End User 2019 & 2032
- Table 6: Global Blood Processing Devices and Consumables Market Volume K Units Forecast, by End User 2019 & 2032
- Table 7: Global Blood Processing Devices and Consumables Market Revenue Million Forecast, by Region 2019 & 2032
- Table 8: Global Blood Processing Devices and Consumables Market Volume K Units Forecast, by Region 2019 & 2032
- Table 9: Global Blood Processing Devices and Consumables Market Revenue Million Forecast, by Country 2019 & 2032
- Table 10: Global Blood Processing Devices and Consumables Market Volume K Units Forecast, by Country 2019 & 2032
- Table 11: United States Global Blood Processing Devices and Consumables Market Revenue (Million) Forecast, by Application 2019 & 2032
- Table 12: United States Global Blood Processing Devices and Consumables Market Volume (K Units) Forecast, by Application 2019 & 2032
- Table 13: Canada Global Blood Processing Devices and Consumables Market Revenue (Million) Forecast, by Application 2019 & 2032
- Table 14: Canada Global Blood Processing Devices and Consumables Market Volume (K Units) Forecast, by Application 2019 & 2032
- Table 15: Mexico Global Blood Processing Devices and Consumables Market Revenue (Million) Forecast, by Application 2019 & 2032
- Table 16: Mexico Global Blood Processing Devices and Consumables Market Volume (K Units) Forecast, by Application 2019 & 2032
- Table 17: Global Blood Processing Devices and Consumables Market Revenue Million Forecast, by Country 2019 & 2032
- Table 18: Global Blood Processing Devices and Consumables Market Volume K Units Forecast, by Country 2019 & 2032
- Table 19: Germany Global Blood Processing Devices and Consumables Market Revenue (Million) Forecast, by Application 2019 & 2032
- Table 20: Germany Global Blood Processing Devices and Consumables Market Volume (K Units) Forecast, by Application 2019 & 2032
- Table 21: United Kingdom Global Blood Processing Devices and Consumables Market Revenue (Million) Forecast, by Application 2019 & 2032
- Table 22: United Kingdom Global Blood Processing Devices and Consumables Market Volume (K Units) Forecast, by Application 2019 & 2032
- Table 23: France Global Blood Processing Devices and Consumables Market Revenue (Million) Forecast, by Application 2019 & 2032
- Table 24: France Global Blood Processing Devices and Consumables Market Volume (K Units) Forecast, by Application 2019 & 2032
- Table 25: Italy Global Blood Processing Devices and Consumables Market Revenue (Million) Forecast, by Application 2019 & 2032
- Table 26: Italy Global Blood Processing Devices and Consumables Market Volume (K Units) Forecast, by Application 2019 & 2032
- Table 27: Spain Global Blood Processing Devices and Consumables Market Revenue (Million) Forecast, by Application 2019 & 2032
- Table 28: Spain Global Blood Processing Devices and Consumables Market Volume (K Units) Forecast, by Application 2019 & 2032
- Table 29: Rest of Europe Global Blood Processing Devices and Consumables Market Revenue (Million) Forecast, by Application 2019 & 2032
- Table 30: Rest of Europe Global Blood Processing Devices and Consumables Market Volume (K Units) Forecast, by Application 2019 & 2032
- Table 31: Global Blood Processing Devices and Consumables Market Revenue Million Forecast, by Country 2019 & 2032
- Table 32: Global Blood Processing Devices and Consumables Market Volume K Units Forecast, by Country 2019 & 2032
- Table 33: China Global Blood Processing Devices and Consumables Market Revenue (Million) Forecast, by Application 2019 & 2032
- Table 34: China Global Blood Processing Devices and Consumables Market Volume (K Units) Forecast, by Application 2019 & 2032
- Table 35: Japan Global Blood Processing Devices and Consumables Market Revenue (Million) Forecast, by Application 2019 & 2032
- Table 36: Japan Global Blood Processing Devices and Consumables Market Volume (K Units) Forecast, by Application 2019 & 2032
- Table 37: India Global Blood Processing Devices and Consumables Market Revenue (Million) Forecast, by Application 2019 & 2032
- Table 38: India Global Blood Processing Devices and Consumables Market Volume (K Units) Forecast, by Application 2019 & 2032
- Table 39: Australia Global Blood Processing Devices and Consumables Market Revenue (Million) Forecast, by Application 2019 & 2032
- Table 40: Australia Global Blood Processing Devices and Consumables Market Volume (K Units) Forecast, by Application 2019 & 2032
- Table 41: South Korea Global Blood Processing Devices and Consumables Market Revenue (Million) Forecast, by Application 2019 & 2032
- Table 42: South Korea Global Blood Processing Devices and Consumables Market Volume (K Units) Forecast, by Application 2019 & 2032
- Table 43: Rest of Asia Pacific Global Blood Processing Devices and Consumables Market Revenue (Million) Forecast, by Application 2019 & 2032
- Table 44: Rest of Asia Pacific Global Blood Processing Devices and Consumables Market Volume (K Units) Forecast, by Application 2019 & 2032
- Table 45: Global Blood Processing Devices and Consumables Market Revenue Million Forecast, by Country 2019 & 2032
- Table 46: Global Blood Processing Devices and Consumables Market Volume K Units Forecast, by Country 2019 & 2032
- Table 47: GCC Global Blood Processing Devices and Consumables Market Revenue (Million) Forecast, by Application 2019 & 2032
- Table 48: GCC Global Blood Processing Devices and Consumables Market Volume (K Units) Forecast, by Application 2019 & 2032
- Table 49: South Africa Global Blood Processing Devices and Consumables Market Revenue (Million) Forecast, by Application 2019 & 2032
- Table 50: South Africa Global Blood Processing Devices and Consumables Market Volume (K Units) Forecast, by Application 2019 & 2032
- Table 51: Rest of Middle East and Africa Global Blood Processing Devices and Consumables Market Revenue (Million) Forecast, by Application 2019 & 2032
- Table 52: Rest of Middle East and Africa Global Blood Processing Devices and Consumables Market Volume (K Units) Forecast, by Application 2019 & 2032
- Table 53: Global Blood Processing Devices and Consumables Market Revenue Million Forecast, by Country 2019 & 2032
- Table 54: Global Blood Processing Devices and Consumables Market Volume K Units Forecast, by Country 2019 & 2032
- Table 55: Brazil Global Blood Processing Devices and Consumables Market Revenue (Million) Forecast, by Application 2019 & 2032
- Table 56: Brazil Global Blood Processing Devices and Consumables Market Volume (K Units) Forecast, by Application 2019 & 2032
- Table 57: Argentina Global Blood Processing Devices and Consumables Market Revenue (Million) Forecast, by Application 2019 & 2032
- Table 58: Argentina Global Blood Processing Devices and Consumables Market Volume (K Units) Forecast, by Application 2019 & 2032
- Table 59: Rest of South America Global Blood Processing Devices and Consumables Market Revenue (Million) Forecast, by Application 2019 & 2032
- Table 60: Rest of South America Global Blood Processing Devices and Consumables Market Volume (K Units) Forecast, by Application 2019 & 2032
- Table 61: Global Blood Processing Devices and Consumables Market Revenue Million Forecast, by Product 2019 & 2032
- Table 62: Global Blood Processing Devices and Consumables Market Volume K Units Forecast, by Product 2019 & 2032
- Table 63: Global Blood Processing Devices and Consumables Market Revenue Million Forecast, by End User 2019 & 2032
- Table 64: Global Blood Processing Devices and Consumables Market Volume K Units Forecast, by End User 2019 & 2032
- Table 65: Global Blood Processing Devices and Consumables Market Revenue Million Forecast, by Country 2019 & 2032
- Table 66: Global Blood Processing Devices and Consumables Market Volume K Units Forecast, by Country 2019 & 2032
- Table 67: United States Global Blood Processing Devices and Consumables Market Revenue (Million) Forecast, by Application 2019 & 2032
- Table 68: United States Global Blood Processing Devices and Consumables Market Volume (K Units) Forecast, by Application 2019 & 2032
- Table 69: Canada Global Blood Processing Devices and Consumables Market Revenue (Million) Forecast, by Application 2019 & 2032
- Table 70: Canada Global Blood Processing Devices and Consumables Market Volume (K Units) Forecast, by Application 2019 & 2032
- Table 71: Mexico Global Blood Processing Devices and Consumables Market Revenue (Million) Forecast, by Application 2019 & 2032
- Table 72: Mexico Global Blood Processing Devices and Consumables Market Volume (K Units) Forecast, by Application 2019 & 2032
- Table 73: Global Blood Processing Devices and Consumables Market Revenue Million Forecast, by Product 2019 & 2032
- Table 74: Global Blood Processing Devices and Consumables Market Volume K Units Forecast, by Product 2019 & 2032
- Table 75: Global Blood Processing Devices and Consumables Market Revenue Million Forecast, by End User 2019 & 2032
- Table 76: Global Blood Processing Devices and Consumables Market Volume K Units Forecast, by End User 2019 & 2032
- Table 77: Global Blood Processing Devices and Consumables Market Revenue Million Forecast, by Country 2019 & 2032
- Table 78: Global Blood Processing Devices and Consumables Market Volume K Units Forecast, by Country 2019 & 2032
- Table 79: Germany Global Blood Processing Devices and Consumables Market Revenue (Million) Forecast, by Application 2019 & 2032
- Table 80: Germany Global Blood Processing Devices and Consumables Market Volume (K Units) Forecast, by Application 2019 & 2032
- Table 81: United Kingdom Global Blood Processing Devices and Consumables Market Revenue (Million) Forecast, by Application 2019 & 2032
- Table 82: United Kingdom Global Blood Processing Devices and Consumables Market Volume (K Units) Forecast, by Application 2019 & 2032
- Table 83: France Global Blood Processing Devices and Consumables Market Revenue (Million) Forecast, by Application 2019 & 2032
- Table 84: France Global Blood Processing Devices and Consumables Market Volume (K Units) Forecast, by Application 2019 & 2032
- Table 85: Italy Global Blood Processing Devices and Consumables Market Revenue (Million) Forecast, by Application 2019 & 2032
- Table 86: Italy Global Blood Processing Devices and Consumables Market Volume (K Units) Forecast, by Application 2019 & 2032
- Table 87: Spain Global Blood Processing Devices and Consumables Market Revenue (Million) Forecast, by Application 2019 & 2032
- Table 88: Spain Global Blood Processing Devices and Consumables Market Volume (K Units) Forecast, by Application 2019 & 2032
- Table 89: Rest of Europe Global Blood Processing Devices and Consumables Market Revenue (Million) Forecast, by Application 2019 & 2032
- Table 90: Rest of Europe Global Blood Processing Devices and Consumables Market Volume (K Units) Forecast, by Application 2019 & 2032
- Table 91: Global Blood Processing Devices and Consumables Market Revenue Million Forecast, by Product 2019 & 2032
- Table 92: Global Blood Processing Devices and Consumables Market Volume K Units Forecast, by Product 2019 & 2032
- Table 93: Global Blood Processing Devices and Consumables Market Revenue Million Forecast, by End User 2019 & 2032
- Table 94: Global Blood Processing Devices and Consumables Market Volume K Units Forecast, by End User 2019 & 2032
- Table 95: Global Blood Processing Devices and Consumables Market Revenue Million Forecast, by Country 2019 & 2032
- Table 96: Global Blood Processing Devices and Consumables Market Volume K Units Forecast, by Country 2019 & 2032
- Table 97: China Global Blood Processing Devices and Consumables Market Revenue (Million) Forecast, by Application 2019 & 2032
- Table 98: China Global Blood Processing Devices and Consumables Market Volume (K Units) Forecast, by Application 2019 & 2032
- Table 99: Japan Global Blood Processing Devices and Consumables Market Revenue (Million) Forecast, by Application 2019 & 2032
- Table 100: Japan Global Blood Processing Devices and Consumables Market Volume (K Units) Forecast, by Application 2019 & 2032
- Table 101: India Global Blood Processing Devices and Consumables Market Revenue (Million) Forecast, by Application 2019 & 2032
- Table 102: India Global Blood Processing Devices and Consumables Market Volume (K Units) Forecast, by Application 2019 & 2032
- Table 103: Australia Global Blood Processing Devices and Consumables Market Revenue (Million) Forecast, by Application 2019 & 2032
- Table 104: Australia Global Blood Processing Devices and Consumables Market Volume (K Units) Forecast, by Application 2019 & 2032
- Table 105: South Korea Global Blood Processing Devices and Consumables Market Revenue (Million) Forecast, by Application 2019 & 2032
- Table 106: South Korea Global Blood Processing Devices and Consumables Market Volume (K Units) Forecast, by Application 2019 & 2032
- Table 107: Rest of Asia Pacific Global Blood Processing Devices and Consumables Market Revenue (Million) Forecast, by Application 2019 & 2032
- Table 108: Rest of Asia Pacific Global Blood Processing Devices and Consumables Market Volume (K Units) Forecast, by Application 2019 & 2032
- Table 109: Global Blood Processing Devices and Consumables Market Revenue Million Forecast, by Product 2019 & 2032
- Table 110: Global Blood Processing Devices and Consumables Market Volume K Units Forecast, by Product 2019 & 2032
- Table 111: Global Blood Processing Devices and Consumables Market Revenue Million Forecast, by End User 2019 & 2032
- Table 112: Global Blood Processing Devices and Consumables Market Volume K Units Forecast, by End User 2019 & 2032
- Table 113: Global Blood Processing Devices and Consumables Market Revenue Million Forecast, by Country 2019 & 2032
- Table 114: Global Blood Processing Devices and Consumables Market Volume K Units Forecast, by Country 2019 & 2032
- Table 115: GCC Global Blood Processing Devices and Consumables Market Revenue (Million) Forecast, by Application 2019 & 2032
- Table 116: GCC Global Blood Processing Devices and Consumables Market Volume (K Units) Forecast, by Application 2019 & 2032
- Table 117: South Africa Global Blood Processing Devices and Consumables Market Revenue (Million) Forecast, by Application 2019 & 2032
- Table 118: South Africa Global Blood Processing Devices and Consumables Market Volume (K Units) Forecast, by Application 2019 & 2032
- Table 119: Rest of Middle East and Africa Global Blood Processing Devices and Consumables Market Revenue (Million) Forecast, by Application 2019 & 2032
- Table 120: Rest of Middle East and Africa Global Blood Processing Devices and Consumables Market Volume (K Units) Forecast, by Application 2019 & 2032
- Table 121: Global Blood Processing Devices and Consumables Market Revenue Million Forecast, by Product 2019 & 2032
- Table 122: Global Blood Processing Devices and Consumables Market Volume K Units Forecast, by Product 2019 & 2032
- Table 123: Global Blood Processing Devices and Consumables Market Revenue Million Forecast, by End User 2019 & 2032
- Table 124: Global Blood Processing Devices and Consumables Market Volume K Units Forecast, by End User 2019 & 2032
- Table 125: Global Blood Processing Devices and Consumables Market Revenue Million Forecast, by Country 2019 & 2032
- Table 126: Global Blood Processing Devices and Consumables Market Volume K Units Forecast, by Country 2019 & 2032
- Table 127: Brazil Global Blood Processing Devices and Consumables Market Revenue (Million) Forecast, by Application 2019 & 2032
- Table 128: Brazil Global Blood Processing Devices and Consumables Market Volume (K Units) Forecast, by Application 2019 & 2032
- Table 129: Argentina Global Blood Processing Devices and Consumables Market Revenue (Million) Forecast, by Application 2019 & 2032
- Table 130: Argentina Global Blood Processing Devices and Consumables Market Volume (K Units) Forecast, by Application 2019 & 2032
- Table 131: Rest of South America Global Blood Processing Devices and Consumables Market Revenue (Million) Forecast, by Application 2019 & 2032
- Table 132: Rest of South America Global Blood Processing Devices and Consumables Market Volume (K Units) Forecast, by Application 2019 & 2032
Frequently Asked Questions
1. What is the projected Compound Annual Growth Rate (CAGR) of the Global Blood Processing Devices and Consumables Market?
The projected CAGR is approximately > 6.50%.
2. Which companies are prominent players in the Global Blood Processing Devices and Consumables Market?
Key companies in the market include Becton Dickinson and Company, BioMerieux SA, Terumo Corporation, Abbott Laboratories, Danaher Corporation, Roche Holdings AG, Bio-Rad Laboratories, Haemonetics Corporation, Immucor Inc, Grifols International, Thermogenesis Corporation, Macopharma SA Beurer GmbH.
3. What are the main segments of the Global Blood Processing Devices and Consumables Market?
The market segments include Product, End User.
4. Can you provide details about the market size?
The market size is estimated to be USD XX Million as of 2022.
5. What are some drivers contributing to market growth?
Rising Prevenlance of Infectious Disorders Involving Blood Transfusions and Surgical Treatment; Growing Number of Initiatives in Regenerative Medicine and Cell Therapies; Increasing Geriatric Population.
6. What are the notable trends driving market growth?
Blood Cell Processors Segment is Expected to Hold a Major Market Share in the Blood Processing Devices and Consumables Market.
7. Are there any restraints impacting market growth?
Stringent Regulations; High Cost of Blood Processing Devices.
8. Can you provide examples of recent developments in the market?
In July 2022, Rhinostics introduced another breakthrough in automated sample collection technologies with the launch of the patent-pending VERIstic Collection Device focused on small volume blood collection.
9. What pricing options are available for accessing the report?
Pricing options include single-user, multi-user, and enterprise licenses priced at USD 4750, USD 5250, and USD 8750 respectively.
10. Is the market size provided in terms of value or volume?
The market size is provided in terms of value, measured in Million and volume, measured in K Units.
11. Are there any specific market keywords associated with the report?
Yes, the market keyword associated with the report is "Global Blood Processing Devices and Consumables Market," which aids in identifying and referencing the specific market segment covered.
12. How do I determine which pricing option suits my needs best?
The pricing options vary based on user requirements and access needs. Individual users may opt for single-user licenses, while businesses requiring broader access may choose multi-user or enterprise licenses for cost-effective access to the report.
13. Are there any additional resources or data provided in the Global Blood Processing Devices and Consumables Market report?
While the report offers comprehensive insights, it's advisable to review the specific contents or supplementary materials provided to ascertain if additional resources or data are available.
14. How can I stay updated on further developments or reports in the Global Blood Processing Devices and Consumables Market?
To stay informed about further developments, trends, and reports in the Global Blood Processing Devices and Consumables Market, consider subscribing to industry newsletters, following relevant companies and organizations, or regularly checking reputable industry news sources and publications.
Methodology
Step 1 - Identification of Relevant Samples Size from Population Database


Step 2 - Approaches for Defining Global Market Size (Value, Volume* & Price*)

Note*: In applicable scenarios
Step 3 - Data Sources
Primary Research
- Web Analytics
- Survey Reports
- Research Institute
- Latest Research Reports
- Opinion Leaders
Secondary Research
- Annual Reports
- White Paper
- Latest Press Release
- Industry Association
- Paid Database
- Investor Presentations

Step 4 - Data Triangulation
Involves using different sources of information in order to increase the validity of a study
These sources are likely to be stakeholders in a program - participants, other researchers, program staff, other community members, and so on.
Then we put all data in single framework & apply various statistical tools to find out the dynamic on the market.
During the analysis stage, feedback from the stakeholder groups would be compared to determine areas of agreement as well as areas of divergence


