
Key Insights
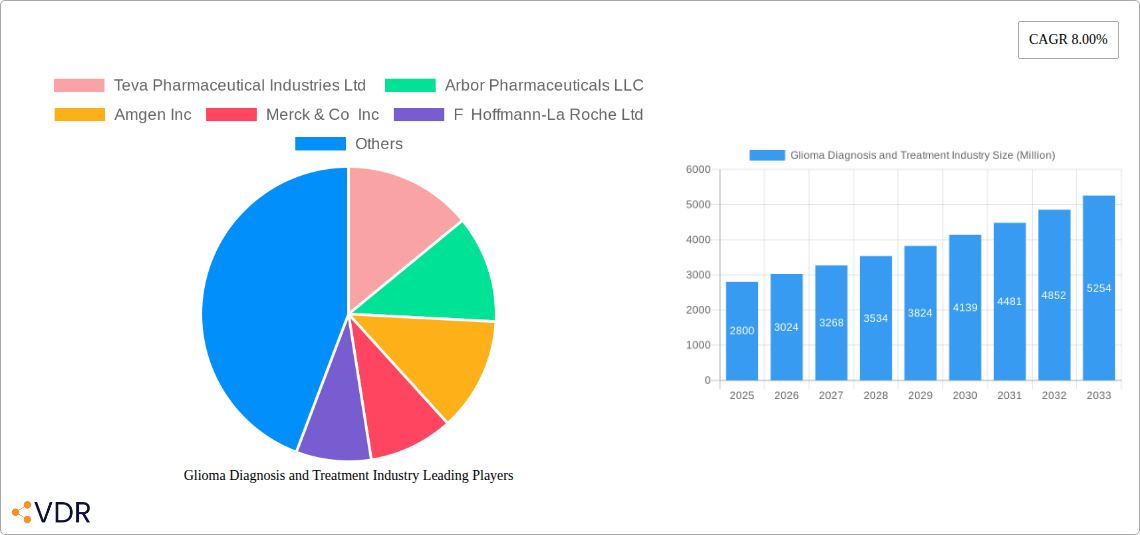
The global glioma diagnosis and treatment market, valued at $2.80 billion in 2025, is projected to experience robust growth, driven by increasing glioma incidence rates, advancements in diagnostic technologies like MRI and PET scans, and the development of novel therapeutic approaches. The market's Compound Annual Growth Rate (CAGR) of 8% from 2025 to 2033 indicates substantial expansion. Key drivers include an aging population, increased awareness of brain tumors, and improved access to healthcare in developing regions. Trends include a shift towards personalized medicine, incorporating genetic testing to tailor treatment strategies and improve outcomes. The growing adoption of minimally invasive surgical techniques and targeted therapies further contribute to market growth. However, the high cost of treatments, particularly advanced therapies like immunotherapy and targeted drug delivery systems, poses a significant restraint. The market is segmented by treatment type (chemotherapy, radiation therapy, other treatments) and end-user (hospitals/clinics, ambulatory surgical centers). Major players like Teva Pharmaceutical Industries, Amgen, Merck, Roche, and Pfizer are actively involved in research and development, contributing to the market's competitive landscape. Regional analysis reveals North America currently holds a significant market share due to advanced healthcare infrastructure and high prevalence of glioma, followed by Europe and Asia-Pacific. The market's future trajectory suggests a continued rise, driven by ongoing research into innovative treatments and improved diagnostic capabilities.
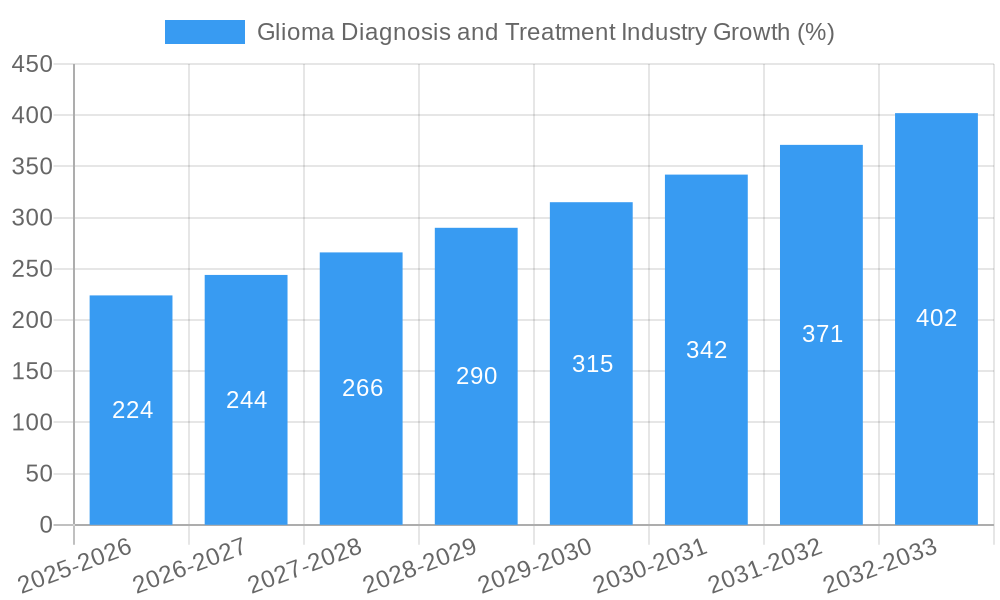
The forecast period (2025-2033) anticipates a considerable market expansion, fuelled by the factors mentioned above. The increasing adoption of advanced imaging techniques and targeted therapies will further propel the market's growth. While challenges remain in terms of treatment costs and accessibility, the continuous development of more effective and less invasive treatments, coupled with increased awareness campaigns and government initiatives, will contribute positively to the overall market expansion over the forecast period. The competitive landscape is likely to remain dynamic with ongoing research and development, mergers, and acquisitions by key players.
Glioma Diagnosis and Treatment Industry Market Report: 2019-2033
This comprehensive report provides an in-depth analysis of the Glioma Diagnosis and Treatment market, encompassing market dynamics, growth trends, regional analysis, product landscape, key players, and future outlook. The study period covers 2019-2033, with 2025 as the base and estimated year. The report is crucial for industry professionals, investors, and researchers seeking a comprehensive understanding of this vital healthcare sector. The market is segmented by treatment type (Chemotherapy, Radiation Therapy, Other Treatments) and end-user (Hospitals/Clinics, Ambulatory Surgical Centers). The total market size is projected to reach xx Million by 2033.
Parent Market: Oncology Therapeutics Market Child Market: Brain Cancer Treatment Market
Glioma Diagnosis and Treatment Industry Market Dynamics & Structure
The Glioma Diagnosis and Treatment market is characterized by a moderately concentrated landscape, with key players holding significant market shares. Market concentration is estimated at xx% in 2025, driven primarily by a few large pharmaceutical companies. Technological innovation, particularly in targeted therapies and immunotherapies, is a significant growth driver. Stringent regulatory frameworks governing drug approvals pose challenges while simultaneously ensuring patient safety. Competitive product substitutes, such as alternative treatment modalities, exert pressure on market dynamics.
- Market Concentration: xx% in 2025 (estimated)
- Key Innovation Drivers: Targeted therapies, Immunotherapies, Advanced imaging techniques
- Regulatory Landscape: Stringent FDA and EMA approvals, impacting timelines and market entry
- Competitive Substitutes: Alternative treatment approaches, influencing treatment choices
- End-User Demographics: Increasing prevalence of gliomas, aging population driving demand
- M&A Trends: xx M&A deals in the past 5 years (estimated), consolidating market share and accelerating innovation. Examples include strategic acquisitions of biotech firms specializing in glioma treatment.
Glioma Diagnosis and Treatment Industry Growth Trends & Insights
The Glioma Diagnosis and Treatment market experienced a CAGR of xx% during the historical period (2019-2024) and is projected to grow at a CAGR of xx% during the forecast period (2025-2033). This growth is fueled by several factors including increased prevalence of gliomas, advancements in diagnostic technologies leading to earlier detection, and the introduction of novel treatment options. Market penetration of targeted therapies remains relatively low but is expected to increase significantly as these treatments demonstrate improved efficacy and safety profiles. Technological advancements, like liquid biopsies and AI-driven diagnostic tools, are disrupting the traditional diagnostic approach. Changing consumer behaviors, such as increased patient advocacy and demand for personalized medicine, are further influencing market trends.
Dominant Regions, Countries, or Segments in Glioma Diagnosis and Treatment Industry
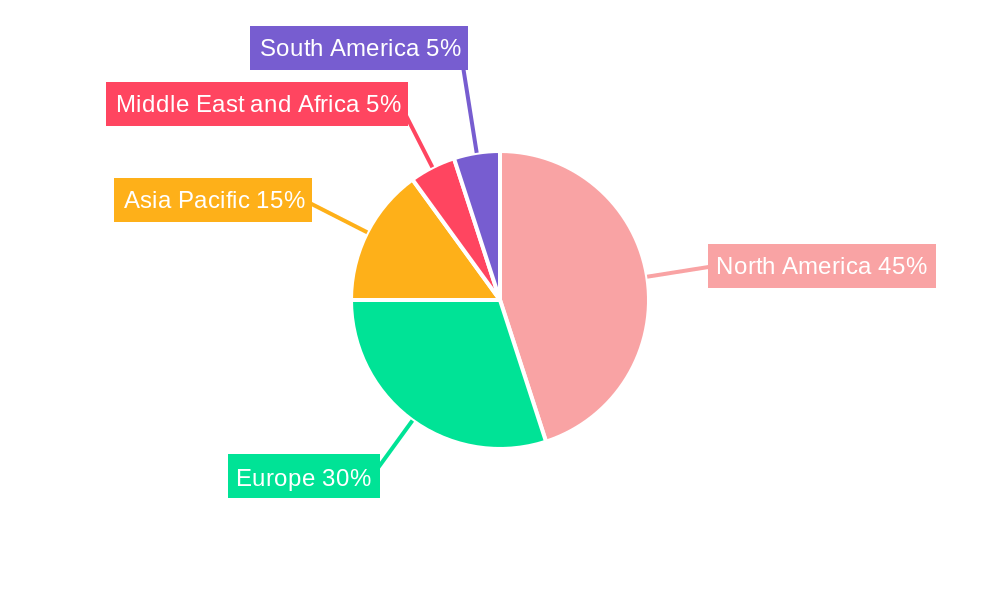
North America currently holds the largest market share in the Glioma Diagnosis and Treatment industry, driven by high healthcare expenditure, advanced healthcare infrastructure, and a significant patient population. Europe is also a substantial market with a significant contribution to overall revenue. Within treatment segments, chemotherapy remains the dominant approach, although the market share for targeted therapies and immunotherapies is growing rapidly. Hospitals and clinics account for the largest end-user segment due to their infrastructure and expertise in managing complex cancer cases.
- Key Growth Drivers (North America): Advanced healthcare infrastructure, high healthcare expenditure, robust research & development
- Key Growth Drivers (Europe): Growing prevalence of gliomas, increasing government funding for healthcare
- Dominant Treatment Segment: Chemotherapy (xx% market share in 2025, estimated)
- Dominant End-User Segment: Hospitals/Clinics (xx% market share in 2025, estimated)
- Growth Potential: Asia-Pacific region shows significant growth potential due to rising healthcare expenditure and increasing awareness.
Glioma Diagnosis and Treatment Industry Product Landscape
The Glioma Diagnosis and Treatment market offers a diverse range of products, including chemotherapeutic agents, radiation therapy equipment, targeted therapies, and supportive care medications. Recent innovations focus on personalized medicine, improving treatment efficacy while minimizing side effects. Key performance metrics include response rates, progression-free survival, and overall survival. Unique selling propositions often revolve around improved tolerability, enhanced efficacy, and targeted mechanisms of action. Technological advancements are constantly improving the accuracy and efficiency of diagnostic tools and treatment delivery systems.
Key Drivers, Barriers & Challenges in Glioma Diagnosis and Treatment Industry
Key Drivers:
- Advances in targeted therapies and immunotherapies are leading to improved patient outcomes.
- Increased investment in research and development is driving innovation and the development of new treatment modalities.
- Rising awareness and improved diagnostic techniques lead to earlier detection and treatment.
Key Challenges:
- High cost of treatment limits access for many patients.
- Drug resistance remains a significant obstacle to effective long-term treatment.
- Regulatory hurdles and lengthy approval processes can delay the introduction of new therapies. The estimated time for regulatory approval is approximately xx months.
Emerging Opportunities in Glioma Diagnosis and Treatment Industry
- The development of personalized medicine approaches offers significant opportunities to tailor treatment to individual patients' needs.
- Liquid biopsies and other advanced diagnostic tools are improving the accuracy and speed of diagnosis.
- Expansion into emerging markets with unmet medical needs is a significant growth opportunity.
Growth Accelerators in the Glioma Diagnosis and Treatment Industry
Technological breakthroughs in immunotherapy and targeted therapies, combined with strategic partnerships between pharmaceutical companies and research institutions, are driving long-term growth. Expansion into underserved markets and proactive engagement in regulatory affairs to expedite approvals contribute to the positive outlook of this sector.
Key Players Shaping the Glioma Diagnosis and Treatment Industry Market
- Teva Pharmaceutical Industries Ltd
- Arbor Pharmaceuticals LLC
- Amgen Inc
- Merck & Co Inc
- F Hoffmann-La Roche Ltd
- Eli Lilly and Company
- Sun Pharmaceutical Industries Ltd
- Lanthen Pharmaceutical
- Bristol-Myers Squibb Company
- Pfizer Inc
Notable Milestones in Glioma Diagnosis and Treatment Industry Sector
- June 2023: Chimeric Therapeutics initiated a Phase 1B clinical trial for CHM 1101, a CLTX CAR T cell therapy for recurrent/progressive glioblastoma multiforme (GBM). This signals a significant advancement in immunotherapy for GBM.
- August 2022: Northwest Biotherapeutics received MHRA approval for its Pediatric Investigation Plan (PIP) for DCVax-L, paving the way for potential adult patient applications. This highlights the progress in regulatory approvals for novel glioma treatments.
In-Depth Glioma Diagnosis and Treatment Industry Market Outlook
The Glioma Diagnosis and Treatment market is poised for continued growth, driven by ongoing technological advancements, increasing prevalence of the disease, and rising healthcare spending. Strategic partnerships and acquisitions within the industry will further accelerate innovation and market expansion, creating lucrative opportunities for established players and emerging biotech companies. The focus on personalized medicine and targeted therapies will shape the future landscape of this dynamic market.
Glioma Diagnosis and Treatment Industry Segmentation
-
1. Treatment
-
1.1. Chemotherapy
- 1.1.1. Temozolomide
- 1.1.2. Bevacizumab
- 1.1.3. Carmustine
- 1.1.4. Other Types of Chemotherapy
- 1.2. Radiation Therapy
- 1.3. Other Treatments
-
1.1. Chemotherapy
-
2. End -User
- 2.1. Hospitals/Clinics
- 2.2. Ambulatory Surgical Centers
Glioma Diagnosis and Treatment Industry Segmentation By Geography
-
1. North America
- 1.1. United States
- 1.2. Canada
- 1.3. Mexico
-
2. Europe
- 2.1. Germany
- 2.2. United Kingdom
- 2.3. France
- 2.4. Italy
- 2.5. Spain
- 2.6. Rest of Europe
-
3. Asia Pacific
- 3.1. China
- 3.2. Japan
- 3.3. India
- 3.4. Australia
- 3.5. South Korea
- 3.6. Rest of Asia Pacific
-
4. Middle East and Africa
- 4.1. GCC
- 4.2. South Africa
- 4.3. Rest of Middle East and Africa
-
5. South America
- 5.1. Brazil
- 5.2. Argentina
- 5.3. Rest of South America
Glioma Diagnosis and Treatment Industry REPORT HIGHLIGHTS
| Aspects | Details |
|---|---|
| Study Period | 2019-2033 |
| Base Year | 2024 |
| Estimated Year | 2025 |
| Forecast Period | 2025-2033 |
| Historical Period | 2019-2024 |
| Growth Rate | CAGR of 8.00% from 2019-2033 |
| Segmentation |
|
Table of Contents
- 1. Introduction
- 1.1. Research Scope
- 1.2. Market Segmentation
- 1.3. Research Methodology
- 1.4. Definitions and Assumptions
- 2. Executive Summary
- 2.1. Introduction
- 3. Market Dynamics
- 3.1. Introduction
- 3.2. Market Drivers
- 3.2.1. Increasing Prevalence of Brain Disorders; Strong R&D Initiatives from Key Players; Increasing Aging Population
- 3.3. Market Restrains
- 3.3.1. Reimbursement Issues and Stringent Regulatory Guidelines; High Cost and Side Effects Associated with Therapies
- 3.4. Market Trends
- 3.4.1. Chemotherapy Segment is Expected to Dominate the Market Over the Forecast Period
- 4. Market Factor Analysis
- 4.1. Porters Five Forces
- 4.2. Supply/Value Chain
- 4.3. PESTEL analysis
- 4.4. Market Entropy
- 4.5. Patent/Trademark Analysis
- 5. Global Glioma Diagnosis and Treatment Industry Analysis, Insights and Forecast, 2019-2031
- 5.1. Market Analysis, Insights and Forecast - by Treatment
- 5.1.1. Chemotherapy
- 5.1.1.1. Temozolomide
- 5.1.1.2. Bevacizumab
- 5.1.1.3. Carmustine
- 5.1.1.4. Other Types of Chemotherapy
- 5.1.2. Radiation Therapy
- 5.1.3. Other Treatments
- 5.1.1. Chemotherapy
- 5.2. Market Analysis, Insights and Forecast - by End -User
- 5.2.1. Hospitals/Clinics
- 5.2.2. Ambulatory Surgical Centers
- 5.3. Market Analysis, Insights and Forecast - by Region
- 5.3.1. North America
- 5.3.2. Europe
- 5.3.3. Asia Pacific
- 5.3.4. Middle East and Africa
- 5.3.5. South America
- 5.1. Market Analysis, Insights and Forecast - by Treatment
- 6. North America Glioma Diagnosis and Treatment Industry Analysis, Insights and Forecast, 2019-2031
- 6.1. Market Analysis, Insights and Forecast - by Treatment
- 6.1.1. Chemotherapy
- 6.1.1.1. Temozolomide
- 6.1.1.2. Bevacizumab
- 6.1.1.3. Carmustine
- 6.1.1.4. Other Types of Chemotherapy
- 6.1.2. Radiation Therapy
- 6.1.3. Other Treatments
- 6.1.1. Chemotherapy
- 6.2. Market Analysis, Insights and Forecast - by End -User
- 6.2.1. Hospitals/Clinics
- 6.2.2. Ambulatory Surgical Centers
- 6.1. Market Analysis, Insights and Forecast - by Treatment
- 7. Europe Glioma Diagnosis and Treatment Industry Analysis, Insights and Forecast, 2019-2031
- 7.1. Market Analysis, Insights and Forecast - by Treatment
- 7.1.1. Chemotherapy
- 7.1.1.1. Temozolomide
- 7.1.1.2. Bevacizumab
- 7.1.1.3. Carmustine
- 7.1.1.4. Other Types of Chemotherapy
- 7.1.2. Radiation Therapy
- 7.1.3. Other Treatments
- 7.1.1. Chemotherapy
- 7.2. Market Analysis, Insights and Forecast - by End -User
- 7.2.1. Hospitals/Clinics
- 7.2.2. Ambulatory Surgical Centers
- 7.1. Market Analysis, Insights and Forecast - by Treatment
- 8. Asia Pacific Glioma Diagnosis and Treatment Industry Analysis, Insights and Forecast, 2019-2031
- 8.1. Market Analysis, Insights and Forecast - by Treatment
- 8.1.1. Chemotherapy
- 8.1.1.1. Temozolomide
- 8.1.1.2. Bevacizumab
- 8.1.1.3. Carmustine
- 8.1.1.4. Other Types of Chemotherapy
- 8.1.2. Radiation Therapy
- 8.1.3. Other Treatments
- 8.1.1. Chemotherapy
- 8.2. Market Analysis, Insights and Forecast - by End -User
- 8.2.1. Hospitals/Clinics
- 8.2.2. Ambulatory Surgical Centers
- 8.1. Market Analysis, Insights and Forecast - by Treatment
- 9. Middle East and Africa Glioma Diagnosis and Treatment Industry Analysis, Insights and Forecast, 2019-2031
- 9.1. Market Analysis, Insights and Forecast - by Treatment
- 9.1.1. Chemotherapy
- 9.1.1.1. Temozolomide
- 9.1.1.2. Bevacizumab
- 9.1.1.3. Carmustine
- 9.1.1.4. Other Types of Chemotherapy
- 9.1.2. Radiation Therapy
- 9.1.3. Other Treatments
- 9.1.1. Chemotherapy
- 9.2. Market Analysis, Insights and Forecast - by End -User
- 9.2.1. Hospitals/Clinics
- 9.2.2. Ambulatory Surgical Centers
- 9.1. Market Analysis, Insights and Forecast - by Treatment
- 10. South America Glioma Diagnosis and Treatment Industry Analysis, Insights and Forecast, 2019-2031
- 10.1. Market Analysis, Insights and Forecast - by Treatment
- 10.1.1. Chemotherapy
- 10.1.1.1. Temozolomide
- 10.1.1.2. Bevacizumab
- 10.1.1.3. Carmustine
- 10.1.1.4. Other Types of Chemotherapy
- 10.1.2. Radiation Therapy
- 10.1.3. Other Treatments
- 10.1.1. Chemotherapy
- 10.2. Market Analysis, Insights and Forecast - by End -User
- 10.2.1. Hospitals/Clinics
- 10.2.2. Ambulatory Surgical Centers
- 10.1. Market Analysis, Insights and Forecast - by Treatment
- 11. North America Glioma Diagnosis and Treatment Industry Analysis, Insights and Forecast, 2019-2031
- 11.1. Market Analysis, Insights and Forecast - By Country/Sub-region
- 11.1.1 United States
- 11.1.2 Canada
- 11.1.3 Mexico
- 12. Europe Glioma Diagnosis and Treatment Industry Analysis, Insights and Forecast, 2019-2031
- 12.1. Market Analysis, Insights and Forecast - By Country/Sub-region
- 12.1.1 Germany
- 12.1.2 United Kingdom
- 12.1.3 France
- 12.1.4 Italy
- 12.1.5 Spain
- 12.1.6 Rest of Europe
- 13. Asia Pacific Glioma Diagnosis and Treatment Industry Analysis, Insights and Forecast, 2019-2031
- 13.1. Market Analysis, Insights and Forecast - By Country/Sub-region
- 13.1.1 China
- 13.1.2 Japan
- 13.1.3 India
- 13.1.4 Australia
- 13.1.5 South Korea
- 13.1.6 Rest of Asia Pacific
- 14. Middle East and Africa Glioma Diagnosis and Treatment Industry Analysis, Insights and Forecast, 2019-2031
- 14.1. Market Analysis, Insights and Forecast - By Country/Sub-region
- 14.1.1 GCC
- 14.1.2 South Africa
- 14.1.3 Rest of Middle East and Africa
- 15. South America Glioma Diagnosis and Treatment Industry Analysis, Insights and Forecast, 2019-2031
- 15.1. Market Analysis, Insights and Forecast - By Country/Sub-region
- 15.1.1 Brazil
- 15.1.2 Argentina
- 15.1.3 Rest of South America
- 16. Competitive Analysis
- 16.1. Global Market Share Analysis 2024
- 16.2. Company Profiles
- 16.2.1 Teva Pharmaceutical Industries Ltd
- 16.2.1.1. Overview
- 16.2.1.2. Products
- 16.2.1.3. SWOT Analysis
- 16.2.1.4. Recent Developments
- 16.2.1.5. Financials (Based on Availability)
- 16.2.2 Arbor Pharmaceuticals LLC
- 16.2.2.1. Overview
- 16.2.2.2. Products
- 16.2.2.3. SWOT Analysis
- 16.2.2.4. Recent Developments
- 16.2.2.5. Financials (Based on Availability)
- 16.2.3 Amgen Inc
- 16.2.3.1. Overview
- 16.2.3.2. Products
- 16.2.3.3. SWOT Analysis
- 16.2.3.4. Recent Developments
- 16.2.3.5. Financials (Based on Availability)
- 16.2.4 Merck & Co Inc
- 16.2.4.1. Overview
- 16.2.4.2. Products
- 16.2.4.3. SWOT Analysis
- 16.2.4.4. Recent Developments
- 16.2.4.5. Financials (Based on Availability)
- 16.2.5 F Hoffmann-La Roche Ltd
- 16.2.5.1. Overview
- 16.2.5.2. Products
- 16.2.5.3. SWOT Analysis
- 16.2.5.4. Recent Developments
- 16.2.5.5. Financials (Based on Availability)
- 16.2.6 Eli Lilly and Company
- 16.2.6.1. Overview
- 16.2.6.2. Products
- 16.2.6.3. SWOT Analysis
- 16.2.6.4. Recent Developments
- 16.2.6.5. Financials (Based on Availability)
- 16.2.7 Sun Pharmaceutical Industries Ltd
- 16.2.7.1. Overview
- 16.2.7.2. Products
- 16.2.7.3. SWOT Analysis
- 16.2.7.4. Recent Developments
- 16.2.7.5. Financials (Based on Availability)
- 16.2.8 Lanthen Pharmaceutical
- 16.2.8.1. Overview
- 16.2.8.2. Products
- 16.2.8.3. SWOT Analysis
- 16.2.8.4. Recent Developments
- 16.2.8.5. Financials (Based on Availability)
- 16.2.9 Bristol-Myers Squibb Company
- 16.2.9.1. Overview
- 16.2.9.2. Products
- 16.2.9.3. SWOT Analysis
- 16.2.9.4. Recent Developments
- 16.2.9.5. Financials (Based on Availability)
- 16.2.10 Pfizer Inc
- 16.2.10.1. Overview
- 16.2.10.2. Products
- 16.2.10.3. SWOT Analysis
- 16.2.10.4. Recent Developments
- 16.2.10.5. Financials (Based on Availability)
- 16.2.1 Teva Pharmaceutical Industries Ltd
List of Figures
- Figure 1: Global Glioma Diagnosis and Treatment Industry Revenue Breakdown (Million, %) by Region 2024 & 2032
- Figure 2: Global Glioma Diagnosis and Treatment Industry Volume Breakdown (K Unit, %) by Region 2024 & 2032
- Figure 3: North America Glioma Diagnosis and Treatment Industry Revenue (Million), by Country 2024 & 2032
- Figure 4: North America Glioma Diagnosis and Treatment Industry Volume (K Unit), by Country 2024 & 2032
- Figure 5: North America Glioma Diagnosis and Treatment Industry Revenue Share (%), by Country 2024 & 2032
- Figure 6: North America Glioma Diagnosis and Treatment Industry Volume Share (%), by Country 2024 & 2032
- Figure 7: Europe Glioma Diagnosis and Treatment Industry Revenue (Million), by Country 2024 & 2032
- Figure 8: Europe Glioma Diagnosis and Treatment Industry Volume (K Unit), by Country 2024 & 2032
- Figure 9: Europe Glioma Diagnosis and Treatment Industry Revenue Share (%), by Country 2024 & 2032
- Figure 10: Europe Glioma Diagnosis and Treatment Industry Volume Share (%), by Country 2024 & 2032
- Figure 11: Asia Pacific Glioma Diagnosis and Treatment Industry Revenue (Million), by Country 2024 & 2032
- Figure 12: Asia Pacific Glioma Diagnosis and Treatment Industry Volume (K Unit), by Country 2024 & 2032
- Figure 13: Asia Pacific Glioma Diagnosis and Treatment Industry Revenue Share (%), by Country 2024 & 2032
- Figure 14: Asia Pacific Glioma Diagnosis and Treatment Industry Volume Share (%), by Country 2024 & 2032
- Figure 15: Middle East and Africa Glioma Diagnosis and Treatment Industry Revenue (Million), by Country 2024 & 2032
- Figure 16: Middle East and Africa Glioma Diagnosis and Treatment Industry Volume (K Unit), by Country 2024 & 2032
- Figure 17: Middle East and Africa Glioma Diagnosis and Treatment Industry Revenue Share (%), by Country 2024 & 2032
- Figure 18: Middle East and Africa Glioma Diagnosis and Treatment Industry Volume Share (%), by Country 2024 & 2032
- Figure 19: South America Glioma Diagnosis and Treatment Industry Revenue (Million), by Country 2024 & 2032
- Figure 20: South America Glioma Diagnosis and Treatment Industry Volume (K Unit), by Country 2024 & 2032
- Figure 21: South America Glioma Diagnosis and Treatment Industry Revenue Share (%), by Country 2024 & 2032
- Figure 22: South America Glioma Diagnosis and Treatment Industry Volume Share (%), by Country 2024 & 2032
- Figure 23: North America Glioma Diagnosis and Treatment Industry Revenue (Million), by Treatment 2024 & 2032
- Figure 24: North America Glioma Diagnosis and Treatment Industry Volume (K Unit), by Treatment 2024 & 2032
- Figure 25: North America Glioma Diagnosis and Treatment Industry Revenue Share (%), by Treatment 2024 & 2032
- Figure 26: North America Glioma Diagnosis and Treatment Industry Volume Share (%), by Treatment 2024 & 2032
- Figure 27: North America Glioma Diagnosis and Treatment Industry Revenue (Million), by End -User 2024 & 2032
- Figure 28: North America Glioma Diagnosis and Treatment Industry Volume (K Unit), by End -User 2024 & 2032
- Figure 29: North America Glioma Diagnosis and Treatment Industry Revenue Share (%), by End -User 2024 & 2032
- Figure 30: North America Glioma Diagnosis and Treatment Industry Volume Share (%), by End -User 2024 & 2032
- Figure 31: North America Glioma Diagnosis and Treatment Industry Revenue (Million), by Country 2024 & 2032
- Figure 32: North America Glioma Diagnosis and Treatment Industry Volume (K Unit), by Country 2024 & 2032
- Figure 33: North America Glioma Diagnosis and Treatment Industry Revenue Share (%), by Country 2024 & 2032
- Figure 34: North America Glioma Diagnosis and Treatment Industry Volume Share (%), by Country 2024 & 2032
- Figure 35: Europe Glioma Diagnosis and Treatment Industry Revenue (Million), by Treatment 2024 & 2032
- Figure 36: Europe Glioma Diagnosis and Treatment Industry Volume (K Unit), by Treatment 2024 & 2032
- Figure 37: Europe Glioma Diagnosis and Treatment Industry Revenue Share (%), by Treatment 2024 & 2032
- Figure 38: Europe Glioma Diagnosis and Treatment Industry Volume Share (%), by Treatment 2024 & 2032
- Figure 39: Europe Glioma Diagnosis and Treatment Industry Revenue (Million), by End -User 2024 & 2032
- Figure 40: Europe Glioma Diagnosis and Treatment Industry Volume (K Unit), by End -User 2024 & 2032
- Figure 41: Europe Glioma Diagnosis and Treatment Industry Revenue Share (%), by End -User 2024 & 2032
- Figure 42: Europe Glioma Diagnosis and Treatment Industry Volume Share (%), by End -User 2024 & 2032
- Figure 43: Europe Glioma Diagnosis and Treatment Industry Revenue (Million), by Country 2024 & 2032
- Figure 44: Europe Glioma Diagnosis and Treatment Industry Volume (K Unit), by Country 2024 & 2032
- Figure 45: Europe Glioma Diagnosis and Treatment Industry Revenue Share (%), by Country 2024 & 2032
- Figure 46: Europe Glioma Diagnosis and Treatment Industry Volume Share (%), by Country 2024 & 2032
- Figure 47: Asia Pacific Glioma Diagnosis and Treatment Industry Revenue (Million), by Treatment 2024 & 2032
- Figure 48: Asia Pacific Glioma Diagnosis and Treatment Industry Volume (K Unit), by Treatment 2024 & 2032
- Figure 49: Asia Pacific Glioma Diagnosis and Treatment Industry Revenue Share (%), by Treatment 2024 & 2032
- Figure 50: Asia Pacific Glioma Diagnosis and Treatment Industry Volume Share (%), by Treatment 2024 & 2032
- Figure 51: Asia Pacific Glioma Diagnosis and Treatment Industry Revenue (Million), by End -User 2024 & 2032
- Figure 52: Asia Pacific Glioma Diagnosis and Treatment Industry Volume (K Unit), by End -User 2024 & 2032
- Figure 53: Asia Pacific Glioma Diagnosis and Treatment Industry Revenue Share (%), by End -User 2024 & 2032
- Figure 54: Asia Pacific Glioma Diagnosis and Treatment Industry Volume Share (%), by End -User 2024 & 2032
- Figure 55: Asia Pacific Glioma Diagnosis and Treatment Industry Revenue (Million), by Country 2024 & 2032
- Figure 56: Asia Pacific Glioma Diagnosis and Treatment Industry Volume (K Unit), by Country 2024 & 2032
- Figure 57: Asia Pacific Glioma Diagnosis and Treatment Industry Revenue Share (%), by Country 2024 & 2032
- Figure 58: Asia Pacific Glioma Diagnosis and Treatment Industry Volume Share (%), by Country 2024 & 2032
- Figure 59: Middle East and Africa Glioma Diagnosis and Treatment Industry Revenue (Million), by Treatment 2024 & 2032
- Figure 60: Middle East and Africa Glioma Diagnosis and Treatment Industry Volume (K Unit), by Treatment 2024 & 2032
- Figure 61: Middle East and Africa Glioma Diagnosis and Treatment Industry Revenue Share (%), by Treatment 2024 & 2032
- Figure 62: Middle East and Africa Glioma Diagnosis and Treatment Industry Volume Share (%), by Treatment 2024 & 2032
- Figure 63: Middle East and Africa Glioma Diagnosis and Treatment Industry Revenue (Million), by End -User 2024 & 2032
- Figure 64: Middle East and Africa Glioma Diagnosis and Treatment Industry Volume (K Unit), by End -User 2024 & 2032
- Figure 65: Middle East and Africa Glioma Diagnosis and Treatment Industry Revenue Share (%), by End -User 2024 & 2032
- Figure 66: Middle East and Africa Glioma Diagnosis and Treatment Industry Volume Share (%), by End -User 2024 & 2032
- Figure 67: Middle East and Africa Glioma Diagnosis and Treatment Industry Revenue (Million), by Country 2024 & 2032
- Figure 68: Middle East and Africa Glioma Diagnosis and Treatment Industry Volume (K Unit), by Country 2024 & 2032
- Figure 69: Middle East and Africa Glioma Diagnosis and Treatment Industry Revenue Share (%), by Country 2024 & 2032
- Figure 70: Middle East and Africa Glioma Diagnosis and Treatment Industry Volume Share (%), by Country 2024 & 2032
- Figure 71: South America Glioma Diagnosis and Treatment Industry Revenue (Million), by Treatment 2024 & 2032
- Figure 72: South America Glioma Diagnosis and Treatment Industry Volume (K Unit), by Treatment 2024 & 2032
- Figure 73: South America Glioma Diagnosis and Treatment Industry Revenue Share (%), by Treatment 2024 & 2032
- Figure 74: South America Glioma Diagnosis and Treatment Industry Volume Share (%), by Treatment 2024 & 2032
- Figure 75: South America Glioma Diagnosis and Treatment Industry Revenue (Million), by End -User 2024 & 2032
- Figure 76: South America Glioma Diagnosis and Treatment Industry Volume (K Unit), by End -User 2024 & 2032
- Figure 77: South America Glioma Diagnosis and Treatment Industry Revenue Share (%), by End -User 2024 & 2032
- Figure 78: South America Glioma Diagnosis and Treatment Industry Volume Share (%), by End -User 2024 & 2032
- Figure 79: South America Glioma Diagnosis and Treatment Industry Revenue (Million), by Country 2024 & 2032
- Figure 80: South America Glioma Diagnosis and Treatment Industry Volume (K Unit), by Country 2024 & 2032
- Figure 81: South America Glioma Diagnosis and Treatment Industry Revenue Share (%), by Country 2024 & 2032
- Figure 82: South America Glioma Diagnosis and Treatment Industry Volume Share (%), by Country 2024 & 2032
List of Tables
- Table 1: Global Glioma Diagnosis and Treatment Industry Revenue Million Forecast, by Region 2019 & 2032
- Table 2: Global Glioma Diagnosis and Treatment Industry Volume K Unit Forecast, by Region 2019 & 2032
- Table 3: Global Glioma Diagnosis and Treatment Industry Revenue Million Forecast, by Treatment 2019 & 2032
- Table 4: Global Glioma Diagnosis and Treatment Industry Volume K Unit Forecast, by Treatment 2019 & 2032
- Table 5: Global Glioma Diagnosis and Treatment Industry Revenue Million Forecast, by End -User 2019 & 2032
- Table 6: Global Glioma Diagnosis and Treatment Industry Volume K Unit Forecast, by End -User 2019 & 2032
- Table 7: Global Glioma Diagnosis and Treatment Industry Revenue Million Forecast, by Region 2019 & 2032
- Table 8: Global Glioma Diagnosis and Treatment Industry Volume K Unit Forecast, by Region 2019 & 2032
- Table 9: Global Glioma Diagnosis and Treatment Industry Revenue Million Forecast, by Country 2019 & 2032
- Table 10: Global Glioma Diagnosis and Treatment Industry Volume K Unit Forecast, by Country 2019 & 2032
- Table 11: United States Glioma Diagnosis and Treatment Industry Revenue (Million) Forecast, by Application 2019 & 2032
- Table 12: United States Glioma Diagnosis and Treatment Industry Volume (K Unit) Forecast, by Application 2019 & 2032
- Table 13: Canada Glioma Diagnosis and Treatment Industry Revenue (Million) Forecast, by Application 2019 & 2032
- Table 14: Canada Glioma Diagnosis and Treatment Industry Volume (K Unit) Forecast, by Application 2019 & 2032
- Table 15: Mexico Glioma Diagnosis and Treatment Industry Revenue (Million) Forecast, by Application 2019 & 2032
- Table 16: Mexico Glioma Diagnosis and Treatment Industry Volume (K Unit) Forecast, by Application 2019 & 2032
- Table 17: Global Glioma Diagnosis and Treatment Industry Revenue Million Forecast, by Country 2019 & 2032
- Table 18: Global Glioma Diagnosis and Treatment Industry Volume K Unit Forecast, by Country 2019 & 2032
- Table 19: Germany Glioma Diagnosis and Treatment Industry Revenue (Million) Forecast, by Application 2019 & 2032
- Table 20: Germany Glioma Diagnosis and Treatment Industry Volume (K Unit) Forecast, by Application 2019 & 2032
- Table 21: United Kingdom Glioma Diagnosis and Treatment Industry Revenue (Million) Forecast, by Application 2019 & 2032
- Table 22: United Kingdom Glioma Diagnosis and Treatment Industry Volume (K Unit) Forecast, by Application 2019 & 2032
- Table 23: France Glioma Diagnosis and Treatment Industry Revenue (Million) Forecast, by Application 2019 & 2032
- Table 24: France Glioma Diagnosis and Treatment Industry Volume (K Unit) Forecast, by Application 2019 & 2032
- Table 25: Italy Glioma Diagnosis and Treatment Industry Revenue (Million) Forecast, by Application 2019 & 2032
- Table 26: Italy Glioma Diagnosis and Treatment Industry Volume (K Unit) Forecast, by Application 2019 & 2032
- Table 27: Spain Glioma Diagnosis and Treatment Industry Revenue (Million) Forecast, by Application 2019 & 2032
- Table 28: Spain Glioma Diagnosis and Treatment Industry Volume (K Unit) Forecast, by Application 2019 & 2032
- Table 29: Rest of Europe Glioma Diagnosis and Treatment Industry Revenue (Million) Forecast, by Application 2019 & 2032
- Table 30: Rest of Europe Glioma Diagnosis and Treatment Industry Volume (K Unit) Forecast, by Application 2019 & 2032
- Table 31: Global Glioma Diagnosis and Treatment Industry Revenue Million Forecast, by Country 2019 & 2032
- Table 32: Global Glioma Diagnosis and Treatment Industry Volume K Unit Forecast, by Country 2019 & 2032
- Table 33: China Glioma Diagnosis and Treatment Industry Revenue (Million) Forecast, by Application 2019 & 2032
- Table 34: China Glioma Diagnosis and Treatment Industry Volume (K Unit) Forecast, by Application 2019 & 2032
- Table 35: Japan Glioma Diagnosis and Treatment Industry Revenue (Million) Forecast, by Application 2019 & 2032
- Table 36: Japan Glioma Diagnosis and Treatment Industry Volume (K Unit) Forecast, by Application 2019 & 2032
- Table 37: India Glioma Diagnosis and Treatment Industry Revenue (Million) Forecast, by Application 2019 & 2032
- Table 38: India Glioma Diagnosis and Treatment Industry Volume (K Unit) Forecast, by Application 2019 & 2032
- Table 39: Australia Glioma Diagnosis and Treatment Industry Revenue (Million) Forecast, by Application 2019 & 2032
- Table 40: Australia Glioma Diagnosis and Treatment Industry Volume (K Unit) Forecast, by Application 2019 & 2032
- Table 41: South Korea Glioma Diagnosis and Treatment Industry Revenue (Million) Forecast, by Application 2019 & 2032
- Table 42: South Korea Glioma Diagnosis and Treatment Industry Volume (K Unit) Forecast, by Application 2019 & 2032
- Table 43: Rest of Asia Pacific Glioma Diagnosis and Treatment Industry Revenue (Million) Forecast, by Application 2019 & 2032
- Table 44: Rest of Asia Pacific Glioma Diagnosis and Treatment Industry Volume (K Unit) Forecast, by Application 2019 & 2032
- Table 45: Global Glioma Diagnosis and Treatment Industry Revenue Million Forecast, by Country 2019 & 2032
- Table 46: Global Glioma Diagnosis and Treatment Industry Volume K Unit Forecast, by Country 2019 & 2032
- Table 47: GCC Glioma Diagnosis and Treatment Industry Revenue (Million) Forecast, by Application 2019 & 2032
- Table 48: GCC Glioma Diagnosis and Treatment Industry Volume (K Unit) Forecast, by Application 2019 & 2032
- Table 49: South Africa Glioma Diagnosis and Treatment Industry Revenue (Million) Forecast, by Application 2019 & 2032
- Table 50: South Africa Glioma Diagnosis and Treatment Industry Volume (K Unit) Forecast, by Application 2019 & 2032
- Table 51: Rest of Middle East and Africa Glioma Diagnosis and Treatment Industry Revenue (Million) Forecast, by Application 2019 & 2032
- Table 52: Rest of Middle East and Africa Glioma Diagnosis and Treatment Industry Volume (K Unit) Forecast, by Application 2019 & 2032
- Table 53: Global Glioma Diagnosis and Treatment Industry Revenue Million Forecast, by Country 2019 & 2032
- Table 54: Global Glioma Diagnosis and Treatment Industry Volume K Unit Forecast, by Country 2019 & 2032
- Table 55: Brazil Glioma Diagnosis and Treatment Industry Revenue (Million) Forecast, by Application 2019 & 2032
- Table 56: Brazil Glioma Diagnosis and Treatment Industry Volume (K Unit) Forecast, by Application 2019 & 2032
- Table 57: Argentina Glioma Diagnosis and Treatment Industry Revenue (Million) Forecast, by Application 2019 & 2032
- Table 58: Argentina Glioma Diagnosis and Treatment Industry Volume (K Unit) Forecast, by Application 2019 & 2032
- Table 59: Rest of South America Glioma Diagnosis and Treatment Industry Revenue (Million) Forecast, by Application 2019 & 2032
- Table 60: Rest of South America Glioma Diagnosis and Treatment Industry Volume (K Unit) Forecast, by Application 2019 & 2032
- Table 61: Global Glioma Diagnosis and Treatment Industry Revenue Million Forecast, by Treatment 2019 & 2032
- Table 62: Global Glioma Diagnosis and Treatment Industry Volume K Unit Forecast, by Treatment 2019 & 2032
- Table 63: Global Glioma Diagnosis and Treatment Industry Revenue Million Forecast, by End -User 2019 & 2032
- Table 64: Global Glioma Diagnosis and Treatment Industry Volume K Unit Forecast, by End -User 2019 & 2032
- Table 65: Global Glioma Diagnosis and Treatment Industry Revenue Million Forecast, by Country 2019 & 2032
- Table 66: Global Glioma Diagnosis and Treatment Industry Volume K Unit Forecast, by Country 2019 & 2032
- Table 67: United States Glioma Diagnosis and Treatment Industry Revenue (Million) Forecast, by Application 2019 & 2032
- Table 68: United States Glioma Diagnosis and Treatment Industry Volume (K Unit) Forecast, by Application 2019 & 2032
- Table 69: Canada Glioma Diagnosis and Treatment Industry Revenue (Million) Forecast, by Application 2019 & 2032
- Table 70: Canada Glioma Diagnosis and Treatment Industry Volume (K Unit) Forecast, by Application 2019 & 2032
- Table 71: Mexico Glioma Diagnosis and Treatment Industry Revenue (Million) Forecast, by Application 2019 & 2032
- Table 72: Mexico Glioma Diagnosis and Treatment Industry Volume (K Unit) Forecast, by Application 2019 & 2032
- Table 73: Global Glioma Diagnosis and Treatment Industry Revenue Million Forecast, by Treatment 2019 & 2032
- Table 74: Global Glioma Diagnosis and Treatment Industry Volume K Unit Forecast, by Treatment 2019 & 2032
- Table 75: Global Glioma Diagnosis and Treatment Industry Revenue Million Forecast, by End -User 2019 & 2032
- Table 76: Global Glioma Diagnosis and Treatment Industry Volume K Unit Forecast, by End -User 2019 & 2032
- Table 77: Global Glioma Diagnosis and Treatment Industry Revenue Million Forecast, by Country 2019 & 2032
- Table 78: Global Glioma Diagnosis and Treatment Industry Volume K Unit Forecast, by Country 2019 & 2032
- Table 79: Germany Glioma Diagnosis and Treatment Industry Revenue (Million) Forecast, by Application 2019 & 2032
- Table 80: Germany Glioma Diagnosis and Treatment Industry Volume (K Unit) Forecast, by Application 2019 & 2032
- Table 81: United Kingdom Glioma Diagnosis and Treatment Industry Revenue (Million) Forecast, by Application 2019 & 2032
- Table 82: United Kingdom Glioma Diagnosis and Treatment Industry Volume (K Unit) Forecast, by Application 2019 & 2032
- Table 83: France Glioma Diagnosis and Treatment Industry Revenue (Million) Forecast, by Application 2019 & 2032
- Table 84: France Glioma Diagnosis and Treatment Industry Volume (K Unit) Forecast, by Application 2019 & 2032
- Table 85: Italy Glioma Diagnosis and Treatment Industry Revenue (Million) Forecast, by Application 2019 & 2032
- Table 86: Italy Glioma Diagnosis and Treatment Industry Volume (K Unit) Forecast, by Application 2019 & 2032
- Table 87: Spain Glioma Diagnosis and Treatment Industry Revenue (Million) Forecast, by Application 2019 & 2032
- Table 88: Spain Glioma Diagnosis and Treatment Industry Volume (K Unit) Forecast, by Application 2019 & 2032
- Table 89: Rest of Europe Glioma Diagnosis and Treatment Industry Revenue (Million) Forecast, by Application 2019 & 2032
- Table 90: Rest of Europe Glioma Diagnosis and Treatment Industry Volume (K Unit) Forecast, by Application 2019 & 2032
- Table 91: Global Glioma Diagnosis and Treatment Industry Revenue Million Forecast, by Treatment 2019 & 2032
- Table 92: Global Glioma Diagnosis and Treatment Industry Volume K Unit Forecast, by Treatment 2019 & 2032
- Table 93: Global Glioma Diagnosis and Treatment Industry Revenue Million Forecast, by End -User 2019 & 2032
- Table 94: Global Glioma Diagnosis and Treatment Industry Volume K Unit Forecast, by End -User 2019 & 2032
- Table 95: Global Glioma Diagnosis and Treatment Industry Revenue Million Forecast, by Country 2019 & 2032
- Table 96: Global Glioma Diagnosis and Treatment Industry Volume K Unit Forecast, by Country 2019 & 2032
- Table 97: China Glioma Diagnosis and Treatment Industry Revenue (Million) Forecast, by Application 2019 & 2032
- Table 98: China Glioma Diagnosis and Treatment Industry Volume (K Unit) Forecast, by Application 2019 & 2032
- Table 99: Japan Glioma Diagnosis and Treatment Industry Revenue (Million) Forecast, by Application 2019 & 2032
- Table 100: Japan Glioma Diagnosis and Treatment Industry Volume (K Unit) Forecast, by Application 2019 & 2032
- Table 101: India Glioma Diagnosis and Treatment Industry Revenue (Million) Forecast, by Application 2019 & 2032
- Table 102: India Glioma Diagnosis and Treatment Industry Volume (K Unit) Forecast, by Application 2019 & 2032
- Table 103: Australia Glioma Diagnosis and Treatment Industry Revenue (Million) Forecast, by Application 2019 & 2032
- Table 104: Australia Glioma Diagnosis and Treatment Industry Volume (K Unit) Forecast, by Application 2019 & 2032
- Table 105: South Korea Glioma Diagnosis and Treatment Industry Revenue (Million) Forecast, by Application 2019 & 2032
- Table 106: South Korea Glioma Diagnosis and Treatment Industry Volume (K Unit) Forecast, by Application 2019 & 2032
- Table 107: Rest of Asia Pacific Glioma Diagnosis and Treatment Industry Revenue (Million) Forecast, by Application 2019 & 2032
- Table 108: Rest of Asia Pacific Glioma Diagnosis and Treatment Industry Volume (K Unit) Forecast, by Application 2019 & 2032
- Table 109: Global Glioma Diagnosis and Treatment Industry Revenue Million Forecast, by Treatment 2019 & 2032
- Table 110: Global Glioma Diagnosis and Treatment Industry Volume K Unit Forecast, by Treatment 2019 & 2032
- Table 111: Global Glioma Diagnosis and Treatment Industry Revenue Million Forecast, by End -User 2019 & 2032
- Table 112: Global Glioma Diagnosis and Treatment Industry Volume K Unit Forecast, by End -User 2019 & 2032
- Table 113: Global Glioma Diagnosis and Treatment Industry Revenue Million Forecast, by Country 2019 & 2032
- Table 114: Global Glioma Diagnosis and Treatment Industry Volume K Unit Forecast, by Country 2019 & 2032
- Table 115: GCC Glioma Diagnosis and Treatment Industry Revenue (Million) Forecast, by Application 2019 & 2032
- Table 116: GCC Glioma Diagnosis and Treatment Industry Volume (K Unit) Forecast, by Application 2019 & 2032
- Table 117: South Africa Glioma Diagnosis and Treatment Industry Revenue (Million) Forecast, by Application 2019 & 2032
- Table 118: South Africa Glioma Diagnosis and Treatment Industry Volume (K Unit) Forecast, by Application 2019 & 2032
- Table 119: Rest of Middle East and Africa Glioma Diagnosis and Treatment Industry Revenue (Million) Forecast, by Application 2019 & 2032
- Table 120: Rest of Middle East and Africa Glioma Diagnosis and Treatment Industry Volume (K Unit) Forecast, by Application 2019 & 2032
- Table 121: Global Glioma Diagnosis and Treatment Industry Revenue Million Forecast, by Treatment 2019 & 2032
- Table 122: Global Glioma Diagnosis and Treatment Industry Volume K Unit Forecast, by Treatment 2019 & 2032
- Table 123: Global Glioma Diagnosis and Treatment Industry Revenue Million Forecast, by End -User 2019 & 2032
- Table 124: Global Glioma Diagnosis and Treatment Industry Volume K Unit Forecast, by End -User 2019 & 2032
- Table 125: Global Glioma Diagnosis and Treatment Industry Revenue Million Forecast, by Country 2019 & 2032
- Table 126: Global Glioma Diagnosis and Treatment Industry Volume K Unit Forecast, by Country 2019 & 2032
- Table 127: Brazil Glioma Diagnosis and Treatment Industry Revenue (Million) Forecast, by Application 2019 & 2032
- Table 128: Brazil Glioma Diagnosis and Treatment Industry Volume (K Unit) Forecast, by Application 2019 & 2032
- Table 129: Argentina Glioma Diagnosis and Treatment Industry Revenue (Million) Forecast, by Application 2019 & 2032
- Table 130: Argentina Glioma Diagnosis and Treatment Industry Volume (K Unit) Forecast, by Application 2019 & 2032
- Table 131: Rest of South America Glioma Diagnosis and Treatment Industry Revenue (Million) Forecast, by Application 2019 & 2032
- Table 132: Rest of South America Glioma Diagnosis and Treatment Industry Volume (K Unit) Forecast, by Application 2019 & 2032
Frequently Asked Questions
1. What is the projected Compound Annual Growth Rate (CAGR) of the Glioma Diagnosis and Treatment Industry?
The projected CAGR is approximately 8.00%.
2. Which companies are prominent players in the Glioma Diagnosis and Treatment Industry?
Key companies in the market include Teva Pharmaceutical Industries Ltd , Arbor Pharmaceuticals LLC, Amgen Inc, Merck & Co Inc, F Hoffmann-La Roche Ltd, Eli Lilly and Company, Sun Pharmaceutical Industries Ltd, Lanthen Pharmaceutical, Bristol-Myers Squibb Company, Pfizer Inc.
3. What are the main segments of the Glioma Diagnosis and Treatment Industry?
The market segments include Treatment, End -User.
4. Can you provide details about the market size?
The market size is estimated to be USD 2.80 Million as of 2022.
5. What are some drivers contributing to market growth?
Increasing Prevalence of Brain Disorders; Strong R&D Initiatives from Key Players; Increasing Aging Population.
6. What are the notable trends driving market growth?
Chemotherapy Segment is Expected to Dominate the Market Over the Forecast Period.
7. Are there any restraints impacting market growth?
Reimbursement Issues and Stringent Regulatory Guidelines; High Cost and Side Effects Associated with Therapies.
8. Can you provide examples of recent developments in the market?
June 2023: Chimeric Therapeutics activated the Phase 1B clinical trial in patients with recurrent and/ or progressive glioblastoma multiforme (GBM) to assess the safety and efficacy of CHM 1101, the company's first-in-class CLTX CAR T cell therapy.
9. What pricing options are available for accessing the report?
Pricing options include single-user, multi-user, and enterprise licenses priced at USD 4750, USD 5250, and USD 8750 respectively.
10. Is the market size provided in terms of value or volume?
The market size is provided in terms of value, measured in Million and volume, measured in K Unit.
11. Are there any specific market keywords associated with the report?
Yes, the market keyword associated with the report is "Glioma Diagnosis and Treatment Industry," which aids in identifying and referencing the specific market segment covered.
12. How do I determine which pricing option suits my needs best?
The pricing options vary based on user requirements and access needs. Individual users may opt for single-user licenses, while businesses requiring broader access may choose multi-user or enterprise licenses for cost-effective access to the report.
13. Are there any additional resources or data provided in the Glioma Diagnosis and Treatment Industry report?
While the report offers comprehensive insights, it's advisable to review the specific contents or supplementary materials provided to ascertain if additional resources or data are available.
14. How can I stay updated on further developments or reports in the Glioma Diagnosis and Treatment Industry?
To stay informed about further developments, trends, and reports in the Glioma Diagnosis and Treatment Industry, consider subscribing to industry newsletters, following relevant companies and organizations, or regularly checking reputable industry news sources and publications.
Methodology
Step 1 - Identification of Relevant Samples Size from Population Database


Step 2 - Approaches for Defining Global Market Size (Value, Volume* & Price*)

Note*: In applicable scenarios
Step 3 - Data Sources
Primary Research
- Web Analytics
- Survey Reports
- Research Institute
- Latest Research Reports
- Opinion Leaders
Secondary Research
- Annual Reports
- White Paper
- Latest Press Release
- Industry Association
- Paid Database
- Investor Presentations

Step 4 - Data Triangulation
Involves using different sources of information in order to increase the validity of a study
These sources are likely to be stakeholders in a program - participants, other researchers, program staff, other community members, and so on.
Then we put all data in single framework & apply various statistical tools to find out the dynamic on the market.
During the analysis stage, feedback from the stakeholder groups would be compared to determine areas of agreement as well as areas of divergence


