
Key Insights
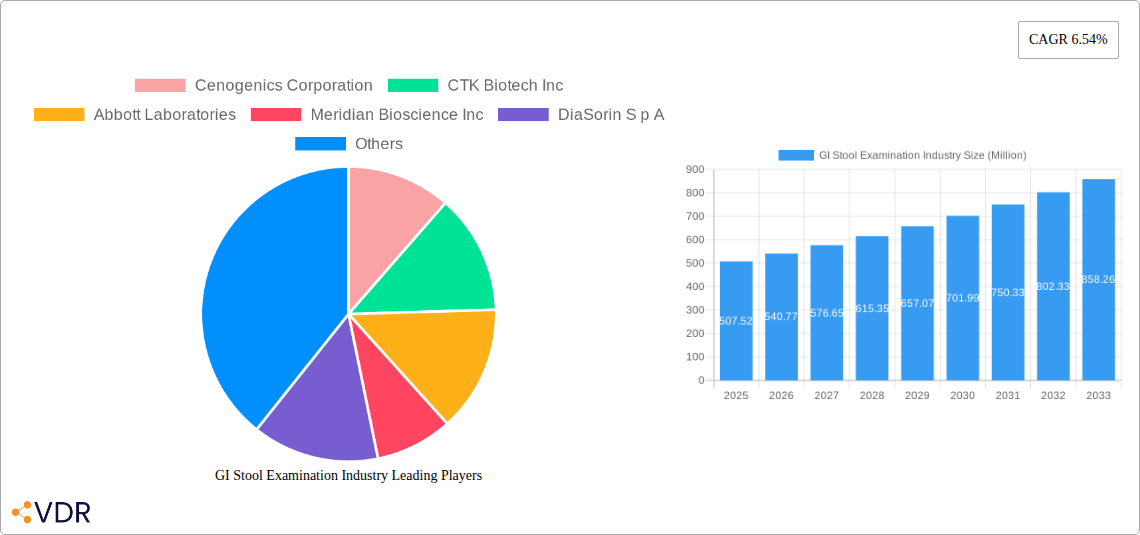
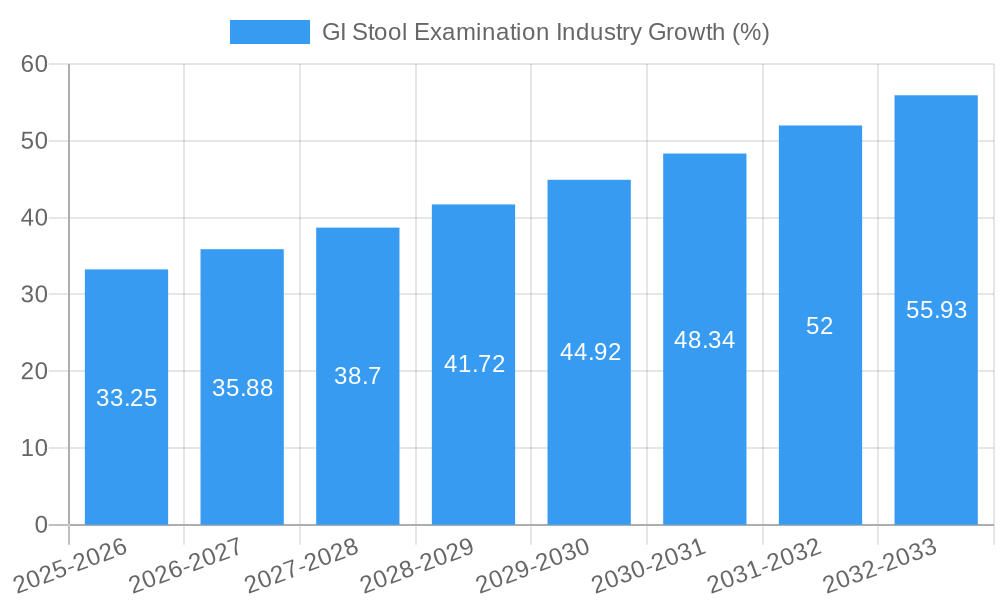
The global gastrointestinal (GI) stool examination market, valued at $507.52 million in 2025, is projected to experience robust growth, driven by increasing prevalence of gastrointestinal disorders, advancements in diagnostic technologies, and rising healthcare expenditure globally. The market's compound annual growth rate (CAGR) of 6.54% from 2025 to 2033 indicates a significant expansion opportunity. Key drivers include the rising incidence of infectious diseases like C. difficile and Salmonella, the growing awareness of colorectal cancer screening, and the increasing adoption of non-invasive diagnostic techniques. Furthermore, the development of sophisticated fecal biomarker tests offering early disease detection and personalized medicine approaches fuels market growth. However, challenges such as the relatively high cost of advanced diagnostic tests and the need for skilled professionals to perform and interpret the results could act as market restraints.
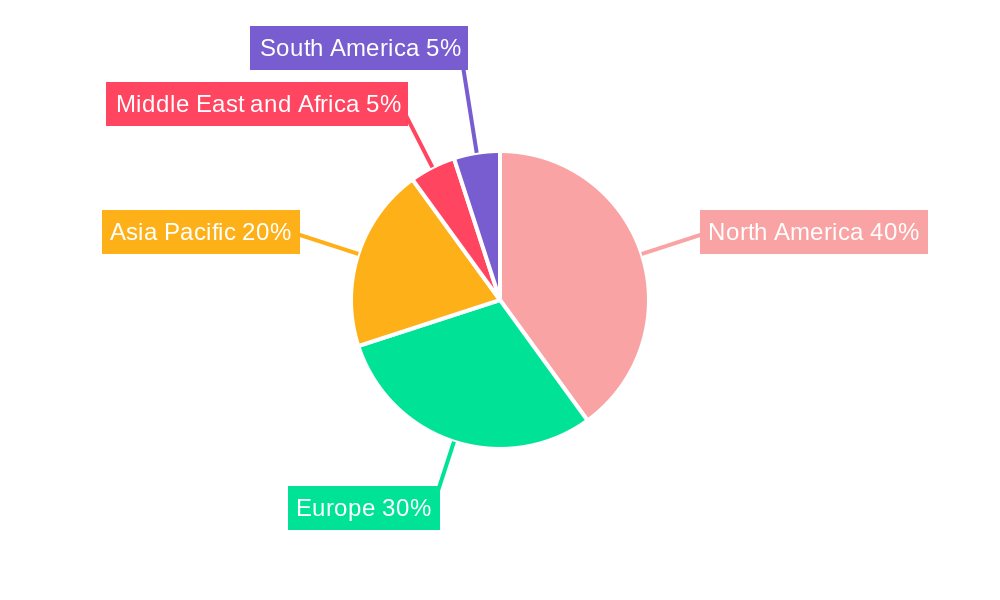
The market segmentation reveals that the 'Instruments' segment within Product Type holds significant market share, owing to technological advancements in microscopy and automated analysis systems. Among Test Types, occult blood tests remain prevalent due to their cost-effectiveness and widespread use in colorectal cancer screening. However, the fecal biomarker tests segment is expected to witness the fastest growth due to their potential for early disease detection and personalized treatment. Geographically, North America currently dominates the market, driven by advanced healthcare infrastructure and high adoption rates of advanced diagnostic tools. However, the Asia-Pacific region is poised for significant growth, fueled by increasing healthcare expenditure and rising awareness of GI health in developing economies. Major players like Abbott Laboratories, Danaher Corporation (Beckman Coulter Inc), and bioMérieux SA are actively investing in research and development, expanding their product portfolios, and strategically entering new markets to capitalize on the growing demand for accurate and efficient GI stool examination services.
GI Stool Examination Industry: A Comprehensive Market Report (2019-2033)
This comprehensive report provides an in-depth analysis of the GI Stool Examination industry, encompassing market dynamics, growth trends, regional segmentation, product landscape, key players, and future outlook. The report covers the period from 2019 to 2033, with a base year of 2025 and a forecast period of 2025-2033. The market is segmented by product type (Instruments, Reagents) and test type (Occult Blood Test, Ova and Parasites Test, Bacteria Test, Fecal Biomarkers Test, Other Test Types). The total market size is predicted to reach xx Million units by 2033.
GI Stool Examination Industry Market Dynamics & Structure
The GI stool examination market is characterized by moderate concentration, with several major players holding significant market share. Technological innovation, particularly in areas like molecular diagnostics and automation, is a key driver, alongside increasing awareness of gastrointestinal diseases and the demand for non-invasive diagnostic tools. Regulatory frameworks, such as FDA approvals for new technologies, significantly influence market growth. Competitive pressure from substitute tests and the ongoing consolidation through mergers and acquisitions (M&A) also shape the industry landscape.
- Market Concentration: Moderately concentrated, with top 5 players holding approximately xx% market share in 2024.
- Technological Innovation: Rapid advancements in molecular diagnostics, automation, and point-of-care testing are driving growth.
- Regulatory Landscape: FDA approvals and international regulatory standards impact market access and product development.
- M&A Activity: A moderate level of M&A activity is observed, with xx deals recorded between 2019 and 2024. This activity is driven by expansion into new markets and technologies.
- End-User Demographics: Growth is driven by an aging population, increasing prevalence of gastrointestinal disorders, and rising healthcare expenditure.
- Innovation Barriers: High R&D costs, stringent regulatory requirements, and the need for high analytical sensitivity pose challenges to innovation.
GI Stool Examination Industry Growth Trends & Insights
The GI stool examination market experienced steady growth during the historical period (2019-2024), with a CAGR of xx%. This growth is primarily attributed to increasing prevalence of gastrointestinal diseases, advancements in diagnostic technologies, and rising healthcare spending. The market is expected to continue its growth trajectory during the forecast period (2025-2033), driven by factors such as increasing adoption of non-invasive testing methods, growing demand for early disease detection, and technological advancements in fecal biomarker analysis. The market penetration rate for fecal biomarker tests is expected to increase from xx% in 2024 to xx% by 2033, further fueling market growth. The adoption of at-home testing kits is also contributing to overall market expansion. Technological disruptions, such as the introduction of AI-powered diagnostic tools and improved automation, are expected to further revolutionize the industry. Consumer behavior shifts towards proactive healthcare and personalized medicine are also positively impacting market growth.
Dominant Regions, Countries, or Segments in GI Stool Examination Industry
North America currently dominates the GI stool examination market, driven by factors such as high healthcare expenditure, advanced healthcare infrastructure, and a high prevalence of gastrointestinal diseases. Within North America, the United States holds the largest market share. Europe is another significant market, showcasing steady growth due to increasing awareness of preventive healthcare and technological advancements. Asia-Pacific is projected to experience the fastest growth rate during the forecast period, driven by expanding healthcare infrastructure, rising disposable incomes, and growing awareness of gastrointestinal disorders.
- Product Type: Reagents currently hold a larger market share compared to instruments, but the demand for automated instruments is growing rapidly.
- Test Type: Occult blood tests currently dominate the market, followed by ova and parasites tests. However, fecal biomarker tests are experiencing the fastest growth due to their potential for early disease detection.
- Key Drivers:
- High prevalence of gastrointestinal disorders
- Increasing healthcare expenditure
- Advancements in diagnostic technologies
- Rising awareness of preventive healthcare
- Government initiatives promoting early disease detection
GI Stool Examination Industry Product Landscape
The GI stool examination market offers a wide range of products, including instruments for sample collection and analysis, reagents for various tests, and software for data management and analysis. Recent innovations include automated systems that improve efficiency and reduce turnaround time, as well as advanced molecular diagnostic tests offering greater sensitivity and specificity. Point-of-care testing solutions are gaining popularity, enabling faster diagnosis and improved patient outcomes. The key selling propositions are accuracy, speed, ease of use, and cost-effectiveness. Miniaturization and integration of multiple testing functionalities into single platforms are ongoing technological advancements.
Key Drivers, Barriers & Challenges in GI Stool Examination Industry
Key Drivers:
- Increasing prevalence of chronic gastrointestinal diseases.
- Rising demand for early and accurate diagnosis.
- Technological advancements in diagnostic technologies.
- Growing adoption of point-of-care testing.
Key Challenges & Restraints:
- High cost of advanced diagnostic tests.
- Stringent regulatory approvals for new products.
- Lack of skilled healthcare professionals in certain regions.
- Competition from alternative diagnostic methods.
Emerging Opportunities in GI Stool Examination Industry
- Expansion into emerging markets with high unmet medical needs.
- Development of novel biomarkers for early disease detection.
- Integration of artificial intelligence (AI) for improved diagnostic accuracy.
- Creation of home-based testing kits for convenient and accessible screening.
Growth Accelerators in the GI Stool Examination Industry Industry
Technological advancements, strategic partnerships between diagnostic companies and healthcare providers, and expansion into untapped markets are key catalysts driving long-term growth. Government initiatives to improve healthcare access and awareness programs promoting preventive screenings further accelerate market expansion.
Key Players Shaping the GI Stool Examination Industry Market
- Cenogenics Corporation
- CTK Biotech Inc
- Abbott Laboratories
- Meridian Bioscience Inc
- DiaSorin S p A
- Epitope Diagnostics Inc
- Cardinal Health
- ScheBo Biotech AG
- Genova Diagnostics
- bioMerieux SA
- Quest Diagnostics Incorporated
- Danaher Corporation (Beckman Coulter Inc )
Notable Milestones in GI Stool Examination Industry Sector
- December 2022: Shineco, Inc. received FDA approval and a US PTO patent for its in-situ fecal specimen sampling device.
- June 2022: Prenetics Group Limited launched the ColoClear at-home colorectal cancer screening test.
In-Depth GI Stool Examination Industry Market Outlook
The GI stool examination market is poised for significant growth over the next decade, driven by technological advancements, increasing disease prevalence, and rising healthcare expenditure. Strategic partnerships, new product launches, and expansion into emerging markets will shape the future of this dynamic industry. Companies focused on innovation and meeting evolving consumer preferences will be well-positioned to capitalize on the significant growth opportunities.
GI Stool Examination Industry Segmentation
-
1. Product Type
- 1.1. Instruments
- 1.2. Reagents
-
2. Test Type
- 2.1. Occult Blood Test
- 2.2. Ova and Parasites Test
- 2.3. Bacteria Test
- 2.4. Fecal Biomarkers Test
- 2.5. Other Test Types
GI Stool Examination Industry Segmentation By Geography
-
1. North America
- 1.1. United States
- 1.2. Canada
- 1.3. Mexico
-
2. Europe
- 2.1. Germany
- 2.2. United Kingdom
- 2.3. France
- 2.4. Italy
- 2.5. Spain
- 2.6. Rest of Europe
-
3. Asia Pacific
- 3.1. China
- 3.2. Japan
- 3.3. India
- 3.4. Australia
- 3.5. South Korea
- 3.6. Rest of Asia Pacific
-
4. Middle East and Africa
- 4.1. GCC
- 4.2. South Africa
- 4.3. Rest of Middle East and Africa
-
5. South America
- 5.1. Brazil
- 5.2. Argentina
- 5.3. Rest of South America
GI Stool Examination Industry REPORT HIGHLIGHTS
| Aspects | Details |
|---|---|
| Study Period | 2019-2033 |
| Base Year | 2024 |
| Estimated Year | 2025 |
| Forecast Period | 2025-2033 |
| Historical Period | 2019-2024 |
| Growth Rate | CAGR of 6.54% from 2019-2033 |
| Segmentation |
|
Table of Contents
- 1. Introduction
- 1.1. Research Scope
- 1.2. Market Segmentation
- 1.3. Research Methodology
- 1.4. Definitions and Assumptions
- 2. Executive Summary
- 2.1. Introduction
- 3. Market Dynamics
- 3.1. Introduction
- 3.2. Market Drivers
- 3.2.1. Growing Burden of Gastrointestinal Diseases; Rising Preference of Point of Care Test
- 3.3. Market Restrains
- 3.3.1. High Cost of Instruments
- 3.4. Market Trends
- 3.4.1. Reagent Segment is Expected to Witness Significant Growth in the GI Stool Testing Market Over the Forecast Period
- 4. Market Factor Analysis
- 4.1. Porters Five Forces
- 4.2. Supply/Value Chain
- 4.3. PESTEL analysis
- 4.4. Market Entropy
- 4.5. Patent/Trademark Analysis
- 5. Global GI Stool Examination Industry Analysis, Insights and Forecast, 2019-2031
- 5.1. Market Analysis, Insights and Forecast - by Product Type
- 5.1.1. Instruments
- 5.1.2. Reagents
- 5.2. Market Analysis, Insights and Forecast - by Test Type
- 5.2.1. Occult Blood Test
- 5.2.2. Ova and Parasites Test
- 5.2.3. Bacteria Test
- 5.2.4. Fecal Biomarkers Test
- 5.2.5. Other Test Types
- 5.3. Market Analysis, Insights and Forecast - by Region
- 5.3.1. North America
- 5.3.2. Europe
- 5.3.3. Asia Pacific
- 5.3.4. Middle East and Africa
- 5.3.5. South America
- 5.1. Market Analysis, Insights and Forecast - by Product Type
- 6. North America GI Stool Examination Industry Analysis, Insights and Forecast, 2019-2031
- 6.1. Market Analysis, Insights and Forecast - by Product Type
- 6.1.1. Instruments
- 6.1.2. Reagents
- 6.2. Market Analysis, Insights and Forecast - by Test Type
- 6.2.1. Occult Blood Test
- 6.2.2. Ova and Parasites Test
- 6.2.3. Bacteria Test
- 6.2.4. Fecal Biomarkers Test
- 6.2.5. Other Test Types
- 6.1. Market Analysis, Insights and Forecast - by Product Type
- 7. Europe GI Stool Examination Industry Analysis, Insights and Forecast, 2019-2031
- 7.1. Market Analysis, Insights and Forecast - by Product Type
- 7.1.1. Instruments
- 7.1.2. Reagents
- 7.2. Market Analysis, Insights and Forecast - by Test Type
- 7.2.1. Occult Blood Test
- 7.2.2. Ova and Parasites Test
- 7.2.3. Bacteria Test
- 7.2.4. Fecal Biomarkers Test
- 7.2.5. Other Test Types
- 7.1. Market Analysis, Insights and Forecast - by Product Type
- 8. Asia Pacific GI Stool Examination Industry Analysis, Insights and Forecast, 2019-2031
- 8.1. Market Analysis, Insights and Forecast - by Product Type
- 8.1.1. Instruments
- 8.1.2. Reagents
- 8.2. Market Analysis, Insights and Forecast - by Test Type
- 8.2.1. Occult Blood Test
- 8.2.2. Ova and Parasites Test
- 8.2.3. Bacteria Test
- 8.2.4. Fecal Biomarkers Test
- 8.2.5. Other Test Types
- 8.1. Market Analysis, Insights and Forecast - by Product Type
- 9. Middle East and Africa GI Stool Examination Industry Analysis, Insights and Forecast, 2019-2031
- 9.1. Market Analysis, Insights and Forecast - by Product Type
- 9.1.1. Instruments
- 9.1.2. Reagents
- 9.2. Market Analysis, Insights and Forecast - by Test Type
- 9.2.1. Occult Blood Test
- 9.2.2. Ova and Parasites Test
- 9.2.3. Bacteria Test
- 9.2.4. Fecal Biomarkers Test
- 9.2.5. Other Test Types
- 9.1. Market Analysis, Insights and Forecast - by Product Type
- 10. South America GI Stool Examination Industry Analysis, Insights and Forecast, 2019-2031
- 10.1. Market Analysis, Insights and Forecast - by Product Type
- 10.1.1. Instruments
- 10.1.2. Reagents
- 10.2. Market Analysis, Insights and Forecast - by Test Type
- 10.2.1. Occult Blood Test
- 10.2.2. Ova and Parasites Test
- 10.2.3. Bacteria Test
- 10.2.4. Fecal Biomarkers Test
- 10.2.5. Other Test Types
- 10.1. Market Analysis, Insights and Forecast - by Product Type
- 11. North America GI Stool Examination Industry Analysis, Insights and Forecast, 2019-2031
- 11.1. Market Analysis, Insights and Forecast - By Country/Sub-region
- 11.1.1 United States
- 11.1.2 Canada
- 11.1.3 Mexico
- 12. Europe GI Stool Examination Industry Analysis, Insights and Forecast, 2019-2031
- 12.1. Market Analysis, Insights and Forecast - By Country/Sub-region
- 12.1.1 Germany
- 12.1.2 United Kingdom
- 12.1.3 France
- 12.1.4 Italy
- 12.1.5 Spain
- 12.1.6 Rest of Europe
- 13. Asia Pacific GI Stool Examination Industry Analysis, Insights and Forecast, 2019-2031
- 13.1. Market Analysis, Insights and Forecast - By Country/Sub-region
- 13.1.1 China
- 13.1.2 Japan
- 13.1.3 India
- 13.1.4 Australia
- 13.1.5 South Korea
- 13.1.6 Rest of Asia Pacific
- 14. Middle East and Africa GI Stool Examination Industry Analysis, Insights and Forecast, 2019-2031
- 14.1. Market Analysis, Insights and Forecast - By Country/Sub-region
- 14.1.1 GCC
- 14.1.2 South Africa
- 14.1.3 Rest of Middle East and Africa
- 15. South America GI Stool Examination Industry Analysis, Insights and Forecast, 2019-2031
- 15.1. Market Analysis, Insights and Forecast - By Country/Sub-region
- 15.1.1 Brazil
- 15.1.2 Argentina
- 15.1.3 Rest of South America
- 16. Competitive Analysis
- 16.1. Global Market Share Analysis 2024
- 16.2. Company Profiles
- 16.2.1 Cenogenics Corporation
- 16.2.1.1. Overview
- 16.2.1.2. Products
- 16.2.1.3. SWOT Analysis
- 16.2.1.4. Recent Developments
- 16.2.1.5. Financials (Based on Availability)
- 16.2.2 CTK Biotech Inc
- 16.2.2.1. Overview
- 16.2.2.2. Products
- 16.2.2.3. SWOT Analysis
- 16.2.2.4. Recent Developments
- 16.2.2.5. Financials (Based on Availability)
- 16.2.3 Abbott Laboratories
- 16.2.3.1. Overview
- 16.2.3.2. Products
- 16.2.3.3. SWOT Analysis
- 16.2.3.4. Recent Developments
- 16.2.3.5. Financials (Based on Availability)
- 16.2.4 Meridian Bioscience Inc
- 16.2.4.1. Overview
- 16.2.4.2. Products
- 16.2.4.3. SWOT Analysis
- 16.2.4.4. Recent Developments
- 16.2.4.5. Financials (Based on Availability)
- 16.2.5 DiaSorin S p A
- 16.2.5.1. Overview
- 16.2.5.2. Products
- 16.2.5.3. SWOT Analysis
- 16.2.5.4. Recent Developments
- 16.2.5.5. Financials (Based on Availability)
- 16.2.6 Epitope Diagnostics Inc
- 16.2.6.1. Overview
- 16.2.6.2. Products
- 16.2.6.3. SWOT Analysis
- 16.2.6.4. Recent Developments
- 16.2.6.5. Financials (Based on Availability)
- 16.2.7 Cardinal Health
- 16.2.7.1. Overview
- 16.2.7.2. Products
- 16.2.7.3. SWOT Analysis
- 16.2.7.4. Recent Developments
- 16.2.7.5. Financials (Based on Availability)
- 16.2.8 ScheBo Biotech AG
- 16.2.8.1. Overview
- 16.2.8.2. Products
- 16.2.8.3. SWOT Analysis
- 16.2.8.4. Recent Developments
- 16.2.8.5. Financials (Based on Availability)
- 16.2.9 Genova Diagnostics
- 16.2.9.1. Overview
- 16.2.9.2. Products
- 16.2.9.3. SWOT Analysis
- 16.2.9.4. Recent Developments
- 16.2.9.5. Financials (Based on Availability)
- 16.2.10 bioMerieux SA
- 16.2.10.1. Overview
- 16.2.10.2. Products
- 16.2.10.3. SWOT Analysis
- 16.2.10.4. Recent Developments
- 16.2.10.5. Financials (Based on Availability)
- 16.2.11 Quest Diagnostics Incorporated
- 16.2.11.1. Overview
- 16.2.11.2. Products
- 16.2.11.3. SWOT Analysis
- 16.2.11.4. Recent Developments
- 16.2.11.5. Financials (Based on Availability)
- 16.2.12 Danaher Corporation (Beckman Coulter Inc )
- 16.2.12.1. Overview
- 16.2.12.2. Products
- 16.2.12.3. SWOT Analysis
- 16.2.12.4. Recent Developments
- 16.2.12.5. Financials (Based on Availability)
- 16.2.1 Cenogenics Corporation
List of Figures
- Figure 1: Global GI Stool Examination Industry Revenue Breakdown (Million, %) by Region 2024 & 2032
- Figure 2: Global GI Stool Examination Industry Volume Breakdown (K Unit, %) by Region 2024 & 2032
- Figure 3: North America GI Stool Examination Industry Revenue (Million), by Country 2024 & 2032
- Figure 4: North America GI Stool Examination Industry Volume (K Unit), by Country 2024 & 2032
- Figure 5: North America GI Stool Examination Industry Revenue Share (%), by Country 2024 & 2032
- Figure 6: North America GI Stool Examination Industry Volume Share (%), by Country 2024 & 2032
- Figure 7: Europe GI Stool Examination Industry Revenue (Million), by Country 2024 & 2032
- Figure 8: Europe GI Stool Examination Industry Volume (K Unit), by Country 2024 & 2032
- Figure 9: Europe GI Stool Examination Industry Revenue Share (%), by Country 2024 & 2032
- Figure 10: Europe GI Stool Examination Industry Volume Share (%), by Country 2024 & 2032
- Figure 11: Asia Pacific GI Stool Examination Industry Revenue (Million), by Country 2024 & 2032
- Figure 12: Asia Pacific GI Stool Examination Industry Volume (K Unit), by Country 2024 & 2032
- Figure 13: Asia Pacific GI Stool Examination Industry Revenue Share (%), by Country 2024 & 2032
- Figure 14: Asia Pacific GI Stool Examination Industry Volume Share (%), by Country 2024 & 2032
- Figure 15: Middle East and Africa GI Stool Examination Industry Revenue (Million), by Country 2024 & 2032
- Figure 16: Middle East and Africa GI Stool Examination Industry Volume (K Unit), by Country 2024 & 2032
- Figure 17: Middle East and Africa GI Stool Examination Industry Revenue Share (%), by Country 2024 & 2032
- Figure 18: Middle East and Africa GI Stool Examination Industry Volume Share (%), by Country 2024 & 2032
- Figure 19: South America GI Stool Examination Industry Revenue (Million), by Country 2024 & 2032
- Figure 20: South America GI Stool Examination Industry Volume (K Unit), by Country 2024 & 2032
- Figure 21: South America GI Stool Examination Industry Revenue Share (%), by Country 2024 & 2032
- Figure 22: South America GI Stool Examination Industry Volume Share (%), by Country 2024 & 2032
- Figure 23: North America GI Stool Examination Industry Revenue (Million), by Product Type 2024 & 2032
- Figure 24: North America GI Stool Examination Industry Volume (K Unit), by Product Type 2024 & 2032
- Figure 25: North America GI Stool Examination Industry Revenue Share (%), by Product Type 2024 & 2032
- Figure 26: North America GI Stool Examination Industry Volume Share (%), by Product Type 2024 & 2032
- Figure 27: North America GI Stool Examination Industry Revenue (Million), by Test Type 2024 & 2032
- Figure 28: North America GI Stool Examination Industry Volume (K Unit), by Test Type 2024 & 2032
- Figure 29: North America GI Stool Examination Industry Revenue Share (%), by Test Type 2024 & 2032
- Figure 30: North America GI Stool Examination Industry Volume Share (%), by Test Type 2024 & 2032
- Figure 31: North America GI Stool Examination Industry Revenue (Million), by Country 2024 & 2032
- Figure 32: North America GI Stool Examination Industry Volume (K Unit), by Country 2024 & 2032
- Figure 33: North America GI Stool Examination Industry Revenue Share (%), by Country 2024 & 2032
- Figure 34: North America GI Stool Examination Industry Volume Share (%), by Country 2024 & 2032
- Figure 35: Europe GI Stool Examination Industry Revenue (Million), by Product Type 2024 & 2032
- Figure 36: Europe GI Stool Examination Industry Volume (K Unit), by Product Type 2024 & 2032
- Figure 37: Europe GI Stool Examination Industry Revenue Share (%), by Product Type 2024 & 2032
- Figure 38: Europe GI Stool Examination Industry Volume Share (%), by Product Type 2024 & 2032
- Figure 39: Europe GI Stool Examination Industry Revenue (Million), by Test Type 2024 & 2032
- Figure 40: Europe GI Stool Examination Industry Volume (K Unit), by Test Type 2024 & 2032
- Figure 41: Europe GI Stool Examination Industry Revenue Share (%), by Test Type 2024 & 2032
- Figure 42: Europe GI Stool Examination Industry Volume Share (%), by Test Type 2024 & 2032
- Figure 43: Europe GI Stool Examination Industry Revenue (Million), by Country 2024 & 2032
- Figure 44: Europe GI Stool Examination Industry Volume (K Unit), by Country 2024 & 2032
- Figure 45: Europe GI Stool Examination Industry Revenue Share (%), by Country 2024 & 2032
- Figure 46: Europe GI Stool Examination Industry Volume Share (%), by Country 2024 & 2032
- Figure 47: Asia Pacific GI Stool Examination Industry Revenue (Million), by Product Type 2024 & 2032
- Figure 48: Asia Pacific GI Stool Examination Industry Volume (K Unit), by Product Type 2024 & 2032
- Figure 49: Asia Pacific GI Stool Examination Industry Revenue Share (%), by Product Type 2024 & 2032
- Figure 50: Asia Pacific GI Stool Examination Industry Volume Share (%), by Product Type 2024 & 2032
- Figure 51: Asia Pacific GI Stool Examination Industry Revenue (Million), by Test Type 2024 & 2032
- Figure 52: Asia Pacific GI Stool Examination Industry Volume (K Unit), by Test Type 2024 & 2032
- Figure 53: Asia Pacific GI Stool Examination Industry Revenue Share (%), by Test Type 2024 & 2032
- Figure 54: Asia Pacific GI Stool Examination Industry Volume Share (%), by Test Type 2024 & 2032
- Figure 55: Asia Pacific GI Stool Examination Industry Revenue (Million), by Country 2024 & 2032
- Figure 56: Asia Pacific GI Stool Examination Industry Volume (K Unit), by Country 2024 & 2032
- Figure 57: Asia Pacific GI Stool Examination Industry Revenue Share (%), by Country 2024 & 2032
- Figure 58: Asia Pacific GI Stool Examination Industry Volume Share (%), by Country 2024 & 2032
- Figure 59: Middle East and Africa GI Stool Examination Industry Revenue (Million), by Product Type 2024 & 2032
- Figure 60: Middle East and Africa GI Stool Examination Industry Volume (K Unit), by Product Type 2024 & 2032
- Figure 61: Middle East and Africa GI Stool Examination Industry Revenue Share (%), by Product Type 2024 & 2032
- Figure 62: Middle East and Africa GI Stool Examination Industry Volume Share (%), by Product Type 2024 & 2032
- Figure 63: Middle East and Africa GI Stool Examination Industry Revenue (Million), by Test Type 2024 & 2032
- Figure 64: Middle East and Africa GI Stool Examination Industry Volume (K Unit), by Test Type 2024 & 2032
- Figure 65: Middle East and Africa GI Stool Examination Industry Revenue Share (%), by Test Type 2024 & 2032
- Figure 66: Middle East and Africa GI Stool Examination Industry Volume Share (%), by Test Type 2024 & 2032
- Figure 67: Middle East and Africa GI Stool Examination Industry Revenue (Million), by Country 2024 & 2032
- Figure 68: Middle East and Africa GI Stool Examination Industry Volume (K Unit), by Country 2024 & 2032
- Figure 69: Middle East and Africa GI Stool Examination Industry Revenue Share (%), by Country 2024 & 2032
- Figure 70: Middle East and Africa GI Stool Examination Industry Volume Share (%), by Country 2024 & 2032
- Figure 71: South America GI Stool Examination Industry Revenue (Million), by Product Type 2024 & 2032
- Figure 72: South America GI Stool Examination Industry Volume (K Unit), by Product Type 2024 & 2032
- Figure 73: South America GI Stool Examination Industry Revenue Share (%), by Product Type 2024 & 2032
- Figure 74: South America GI Stool Examination Industry Volume Share (%), by Product Type 2024 & 2032
- Figure 75: South America GI Stool Examination Industry Revenue (Million), by Test Type 2024 & 2032
- Figure 76: South America GI Stool Examination Industry Volume (K Unit), by Test Type 2024 & 2032
- Figure 77: South America GI Stool Examination Industry Revenue Share (%), by Test Type 2024 & 2032
- Figure 78: South America GI Stool Examination Industry Volume Share (%), by Test Type 2024 & 2032
- Figure 79: South America GI Stool Examination Industry Revenue (Million), by Country 2024 & 2032
- Figure 80: South America GI Stool Examination Industry Volume (K Unit), by Country 2024 & 2032
- Figure 81: South America GI Stool Examination Industry Revenue Share (%), by Country 2024 & 2032
- Figure 82: South America GI Stool Examination Industry Volume Share (%), by Country 2024 & 2032
List of Tables
- Table 1: Global GI Stool Examination Industry Revenue Million Forecast, by Region 2019 & 2032
- Table 2: Global GI Stool Examination Industry Volume K Unit Forecast, by Region 2019 & 2032
- Table 3: Global GI Stool Examination Industry Revenue Million Forecast, by Product Type 2019 & 2032
- Table 4: Global GI Stool Examination Industry Volume K Unit Forecast, by Product Type 2019 & 2032
- Table 5: Global GI Stool Examination Industry Revenue Million Forecast, by Test Type 2019 & 2032
- Table 6: Global GI Stool Examination Industry Volume K Unit Forecast, by Test Type 2019 & 2032
- Table 7: Global GI Stool Examination Industry Revenue Million Forecast, by Region 2019 & 2032
- Table 8: Global GI Stool Examination Industry Volume K Unit Forecast, by Region 2019 & 2032
- Table 9: Global GI Stool Examination Industry Revenue Million Forecast, by Country 2019 & 2032
- Table 10: Global GI Stool Examination Industry Volume K Unit Forecast, by Country 2019 & 2032
- Table 11: United States GI Stool Examination Industry Revenue (Million) Forecast, by Application 2019 & 2032
- Table 12: United States GI Stool Examination Industry Volume (K Unit) Forecast, by Application 2019 & 2032
- Table 13: Canada GI Stool Examination Industry Revenue (Million) Forecast, by Application 2019 & 2032
- Table 14: Canada GI Stool Examination Industry Volume (K Unit) Forecast, by Application 2019 & 2032
- Table 15: Mexico GI Stool Examination Industry Revenue (Million) Forecast, by Application 2019 & 2032
- Table 16: Mexico GI Stool Examination Industry Volume (K Unit) Forecast, by Application 2019 & 2032
- Table 17: Global GI Stool Examination Industry Revenue Million Forecast, by Country 2019 & 2032
- Table 18: Global GI Stool Examination Industry Volume K Unit Forecast, by Country 2019 & 2032
- Table 19: Germany GI Stool Examination Industry Revenue (Million) Forecast, by Application 2019 & 2032
- Table 20: Germany GI Stool Examination Industry Volume (K Unit) Forecast, by Application 2019 & 2032
- Table 21: United Kingdom GI Stool Examination Industry Revenue (Million) Forecast, by Application 2019 & 2032
- Table 22: United Kingdom GI Stool Examination Industry Volume (K Unit) Forecast, by Application 2019 & 2032
- Table 23: France GI Stool Examination Industry Revenue (Million) Forecast, by Application 2019 & 2032
- Table 24: France GI Stool Examination Industry Volume (K Unit) Forecast, by Application 2019 & 2032
- Table 25: Italy GI Stool Examination Industry Revenue (Million) Forecast, by Application 2019 & 2032
- Table 26: Italy GI Stool Examination Industry Volume (K Unit) Forecast, by Application 2019 & 2032
- Table 27: Spain GI Stool Examination Industry Revenue (Million) Forecast, by Application 2019 & 2032
- Table 28: Spain GI Stool Examination Industry Volume (K Unit) Forecast, by Application 2019 & 2032
- Table 29: Rest of Europe GI Stool Examination Industry Revenue (Million) Forecast, by Application 2019 & 2032
- Table 30: Rest of Europe GI Stool Examination Industry Volume (K Unit) Forecast, by Application 2019 & 2032
- Table 31: Global GI Stool Examination Industry Revenue Million Forecast, by Country 2019 & 2032
- Table 32: Global GI Stool Examination Industry Volume K Unit Forecast, by Country 2019 & 2032
- Table 33: China GI Stool Examination Industry Revenue (Million) Forecast, by Application 2019 & 2032
- Table 34: China GI Stool Examination Industry Volume (K Unit) Forecast, by Application 2019 & 2032
- Table 35: Japan GI Stool Examination Industry Revenue (Million) Forecast, by Application 2019 & 2032
- Table 36: Japan GI Stool Examination Industry Volume (K Unit) Forecast, by Application 2019 & 2032
- Table 37: India GI Stool Examination Industry Revenue (Million) Forecast, by Application 2019 & 2032
- Table 38: India GI Stool Examination Industry Volume (K Unit) Forecast, by Application 2019 & 2032
- Table 39: Australia GI Stool Examination Industry Revenue (Million) Forecast, by Application 2019 & 2032
- Table 40: Australia GI Stool Examination Industry Volume (K Unit) Forecast, by Application 2019 & 2032
- Table 41: South Korea GI Stool Examination Industry Revenue (Million) Forecast, by Application 2019 & 2032
- Table 42: South Korea GI Stool Examination Industry Volume (K Unit) Forecast, by Application 2019 & 2032
- Table 43: Rest of Asia Pacific GI Stool Examination Industry Revenue (Million) Forecast, by Application 2019 & 2032
- Table 44: Rest of Asia Pacific GI Stool Examination Industry Volume (K Unit) Forecast, by Application 2019 & 2032
- Table 45: Global GI Stool Examination Industry Revenue Million Forecast, by Country 2019 & 2032
- Table 46: Global GI Stool Examination Industry Volume K Unit Forecast, by Country 2019 & 2032
- Table 47: GCC GI Stool Examination Industry Revenue (Million) Forecast, by Application 2019 & 2032
- Table 48: GCC GI Stool Examination Industry Volume (K Unit) Forecast, by Application 2019 & 2032
- Table 49: South Africa GI Stool Examination Industry Revenue (Million) Forecast, by Application 2019 & 2032
- Table 50: South Africa GI Stool Examination Industry Volume (K Unit) Forecast, by Application 2019 & 2032
- Table 51: Rest of Middle East and Africa GI Stool Examination Industry Revenue (Million) Forecast, by Application 2019 & 2032
- Table 52: Rest of Middle East and Africa GI Stool Examination Industry Volume (K Unit) Forecast, by Application 2019 & 2032
- Table 53: Global GI Stool Examination Industry Revenue Million Forecast, by Country 2019 & 2032
- Table 54: Global GI Stool Examination Industry Volume K Unit Forecast, by Country 2019 & 2032
- Table 55: Brazil GI Stool Examination Industry Revenue (Million) Forecast, by Application 2019 & 2032
- Table 56: Brazil GI Stool Examination Industry Volume (K Unit) Forecast, by Application 2019 & 2032
- Table 57: Argentina GI Stool Examination Industry Revenue (Million) Forecast, by Application 2019 & 2032
- Table 58: Argentina GI Stool Examination Industry Volume (K Unit) Forecast, by Application 2019 & 2032
- Table 59: Rest of South America GI Stool Examination Industry Revenue (Million) Forecast, by Application 2019 & 2032
- Table 60: Rest of South America GI Stool Examination Industry Volume (K Unit) Forecast, by Application 2019 & 2032
- Table 61: Global GI Stool Examination Industry Revenue Million Forecast, by Product Type 2019 & 2032
- Table 62: Global GI Stool Examination Industry Volume K Unit Forecast, by Product Type 2019 & 2032
- Table 63: Global GI Stool Examination Industry Revenue Million Forecast, by Test Type 2019 & 2032
- Table 64: Global GI Stool Examination Industry Volume K Unit Forecast, by Test Type 2019 & 2032
- Table 65: Global GI Stool Examination Industry Revenue Million Forecast, by Country 2019 & 2032
- Table 66: Global GI Stool Examination Industry Volume K Unit Forecast, by Country 2019 & 2032
- Table 67: United States GI Stool Examination Industry Revenue (Million) Forecast, by Application 2019 & 2032
- Table 68: United States GI Stool Examination Industry Volume (K Unit) Forecast, by Application 2019 & 2032
- Table 69: Canada GI Stool Examination Industry Revenue (Million) Forecast, by Application 2019 & 2032
- Table 70: Canada GI Stool Examination Industry Volume (K Unit) Forecast, by Application 2019 & 2032
- Table 71: Mexico GI Stool Examination Industry Revenue (Million) Forecast, by Application 2019 & 2032
- Table 72: Mexico GI Stool Examination Industry Volume (K Unit) Forecast, by Application 2019 & 2032
- Table 73: Global GI Stool Examination Industry Revenue Million Forecast, by Product Type 2019 & 2032
- Table 74: Global GI Stool Examination Industry Volume K Unit Forecast, by Product Type 2019 & 2032
- Table 75: Global GI Stool Examination Industry Revenue Million Forecast, by Test Type 2019 & 2032
- Table 76: Global GI Stool Examination Industry Volume K Unit Forecast, by Test Type 2019 & 2032
- Table 77: Global GI Stool Examination Industry Revenue Million Forecast, by Country 2019 & 2032
- Table 78: Global GI Stool Examination Industry Volume K Unit Forecast, by Country 2019 & 2032
- Table 79: Germany GI Stool Examination Industry Revenue (Million) Forecast, by Application 2019 & 2032
- Table 80: Germany GI Stool Examination Industry Volume (K Unit) Forecast, by Application 2019 & 2032
- Table 81: United Kingdom GI Stool Examination Industry Revenue (Million) Forecast, by Application 2019 & 2032
- Table 82: United Kingdom GI Stool Examination Industry Volume (K Unit) Forecast, by Application 2019 & 2032
- Table 83: France GI Stool Examination Industry Revenue (Million) Forecast, by Application 2019 & 2032
- Table 84: France GI Stool Examination Industry Volume (K Unit) Forecast, by Application 2019 & 2032
- Table 85: Italy GI Stool Examination Industry Revenue (Million) Forecast, by Application 2019 & 2032
- Table 86: Italy GI Stool Examination Industry Volume (K Unit) Forecast, by Application 2019 & 2032
- Table 87: Spain GI Stool Examination Industry Revenue (Million) Forecast, by Application 2019 & 2032
- Table 88: Spain GI Stool Examination Industry Volume (K Unit) Forecast, by Application 2019 & 2032
- Table 89: Rest of Europe GI Stool Examination Industry Revenue (Million) Forecast, by Application 2019 & 2032
- Table 90: Rest of Europe GI Stool Examination Industry Volume (K Unit) Forecast, by Application 2019 & 2032
- Table 91: Global GI Stool Examination Industry Revenue Million Forecast, by Product Type 2019 & 2032
- Table 92: Global GI Stool Examination Industry Volume K Unit Forecast, by Product Type 2019 & 2032
- Table 93: Global GI Stool Examination Industry Revenue Million Forecast, by Test Type 2019 & 2032
- Table 94: Global GI Stool Examination Industry Volume K Unit Forecast, by Test Type 2019 & 2032
- Table 95: Global GI Stool Examination Industry Revenue Million Forecast, by Country 2019 & 2032
- Table 96: Global GI Stool Examination Industry Volume K Unit Forecast, by Country 2019 & 2032
- Table 97: China GI Stool Examination Industry Revenue (Million) Forecast, by Application 2019 & 2032
- Table 98: China GI Stool Examination Industry Volume (K Unit) Forecast, by Application 2019 & 2032
- Table 99: Japan GI Stool Examination Industry Revenue (Million) Forecast, by Application 2019 & 2032
- Table 100: Japan GI Stool Examination Industry Volume (K Unit) Forecast, by Application 2019 & 2032
- Table 101: India GI Stool Examination Industry Revenue (Million) Forecast, by Application 2019 & 2032
- Table 102: India GI Stool Examination Industry Volume (K Unit) Forecast, by Application 2019 & 2032
- Table 103: Australia GI Stool Examination Industry Revenue (Million) Forecast, by Application 2019 & 2032
- Table 104: Australia GI Stool Examination Industry Volume (K Unit) Forecast, by Application 2019 & 2032
- Table 105: South Korea GI Stool Examination Industry Revenue (Million) Forecast, by Application 2019 & 2032
- Table 106: South Korea GI Stool Examination Industry Volume (K Unit) Forecast, by Application 2019 & 2032
- Table 107: Rest of Asia Pacific GI Stool Examination Industry Revenue (Million) Forecast, by Application 2019 & 2032
- Table 108: Rest of Asia Pacific GI Stool Examination Industry Volume (K Unit) Forecast, by Application 2019 & 2032
- Table 109: Global GI Stool Examination Industry Revenue Million Forecast, by Product Type 2019 & 2032
- Table 110: Global GI Stool Examination Industry Volume K Unit Forecast, by Product Type 2019 & 2032
- Table 111: Global GI Stool Examination Industry Revenue Million Forecast, by Test Type 2019 & 2032
- Table 112: Global GI Stool Examination Industry Volume K Unit Forecast, by Test Type 2019 & 2032
- Table 113: Global GI Stool Examination Industry Revenue Million Forecast, by Country 2019 & 2032
- Table 114: Global GI Stool Examination Industry Volume K Unit Forecast, by Country 2019 & 2032
- Table 115: GCC GI Stool Examination Industry Revenue (Million) Forecast, by Application 2019 & 2032
- Table 116: GCC GI Stool Examination Industry Volume (K Unit) Forecast, by Application 2019 & 2032
- Table 117: South Africa GI Stool Examination Industry Revenue (Million) Forecast, by Application 2019 & 2032
- Table 118: South Africa GI Stool Examination Industry Volume (K Unit) Forecast, by Application 2019 & 2032
- Table 119: Rest of Middle East and Africa GI Stool Examination Industry Revenue (Million) Forecast, by Application 2019 & 2032
- Table 120: Rest of Middle East and Africa GI Stool Examination Industry Volume (K Unit) Forecast, by Application 2019 & 2032
- Table 121: Global GI Stool Examination Industry Revenue Million Forecast, by Product Type 2019 & 2032
- Table 122: Global GI Stool Examination Industry Volume K Unit Forecast, by Product Type 2019 & 2032
- Table 123: Global GI Stool Examination Industry Revenue Million Forecast, by Test Type 2019 & 2032
- Table 124: Global GI Stool Examination Industry Volume K Unit Forecast, by Test Type 2019 & 2032
- Table 125: Global GI Stool Examination Industry Revenue Million Forecast, by Country 2019 & 2032
- Table 126: Global GI Stool Examination Industry Volume K Unit Forecast, by Country 2019 & 2032
- Table 127: Brazil GI Stool Examination Industry Revenue (Million) Forecast, by Application 2019 & 2032
- Table 128: Brazil GI Stool Examination Industry Volume (K Unit) Forecast, by Application 2019 & 2032
- Table 129: Argentina GI Stool Examination Industry Revenue (Million) Forecast, by Application 2019 & 2032
- Table 130: Argentina GI Stool Examination Industry Volume (K Unit) Forecast, by Application 2019 & 2032
- Table 131: Rest of South America GI Stool Examination Industry Revenue (Million) Forecast, by Application 2019 & 2032
- Table 132: Rest of South America GI Stool Examination Industry Volume (K Unit) Forecast, by Application 2019 & 2032
Frequently Asked Questions
1. What is the projected Compound Annual Growth Rate (CAGR) of the GI Stool Examination Industry?
The projected CAGR is approximately 6.54%.
2. Which companies are prominent players in the GI Stool Examination Industry?
Key companies in the market include Cenogenics Corporation, CTK Biotech Inc, Abbott Laboratories, Meridian Bioscience Inc, DiaSorin S p A, Epitope Diagnostics Inc, Cardinal Health, ScheBo Biotech AG, Genova Diagnostics, bioMerieux SA, Quest Diagnostics Incorporated, Danaher Corporation (Beckman Coulter Inc ).
3. What are the main segments of the GI Stool Examination Industry?
The market segments include Product Type, Test Type.
4. Can you provide details about the market size?
The market size is estimated to be USD 507.52 Million as of 2022.
5. What are some drivers contributing to market growth?
Growing Burden of Gastrointestinal Diseases; Rising Preference of Point of Care Test.
6. What are the notable trends driving market growth?
Reagent Segment is Expected to Witness Significant Growth in the GI Stool Testing Market Over the Forecast Period.
7. Are there any restraints impacting market growth?
High Cost of Instruments.
8. Can you provide examples of recent developments in the market?
December 2022: Shineco, Inc. received United States Food and Drug FDA approval and a patent grant from the United States Patent and Trademark Office (US PTO) protecting its in-situ fecal specimen sampling device for the use of stool test sample collection. The product provides a massager-like fingertip swab, a collection tube, and a lid with a unidirectional sampling inlet.
9. What pricing options are available for accessing the report?
Pricing options include single-user, multi-user, and enterprise licenses priced at USD 4750, USD 5250, and USD 8750 respectively.
10. Is the market size provided in terms of value or volume?
The market size is provided in terms of value, measured in Million and volume, measured in K Unit.
11. Are there any specific market keywords associated with the report?
Yes, the market keyword associated with the report is "GI Stool Examination Industry," which aids in identifying and referencing the specific market segment covered.
12. How do I determine which pricing option suits my needs best?
The pricing options vary based on user requirements and access needs. Individual users may opt for single-user licenses, while businesses requiring broader access may choose multi-user or enterprise licenses for cost-effective access to the report.
13. Are there any additional resources or data provided in the GI Stool Examination Industry report?
While the report offers comprehensive insights, it's advisable to review the specific contents or supplementary materials provided to ascertain if additional resources or data are available.
14. How can I stay updated on further developments or reports in the GI Stool Examination Industry?
To stay informed about further developments, trends, and reports in the GI Stool Examination Industry, consider subscribing to industry newsletters, following relevant companies and organizations, or regularly checking reputable industry news sources and publications.
Methodology
Step 1 - Identification of Relevant Samples Size from Population Database


Step 2 - Approaches for Defining Global Market Size (Value, Volume* & Price*)

Note*: In applicable scenarios
Step 3 - Data Sources
Primary Research
- Web Analytics
- Survey Reports
- Research Institute
- Latest Research Reports
- Opinion Leaders
Secondary Research
- Annual Reports
- White Paper
- Latest Press Release
- Industry Association
- Paid Database
- Investor Presentations

Step 4 - Data Triangulation
Involves using different sources of information in order to increase the validity of a study
These sources are likely to be stakeholders in a program - participants, other researchers, program staff, other community members, and so on.
Then we put all data in single framework & apply various statistical tools to find out the dynamic on the market.
During the analysis stage, feedback from the stakeholder groups would be compared to determine areas of agreement as well as areas of divergence


