

Key Insights
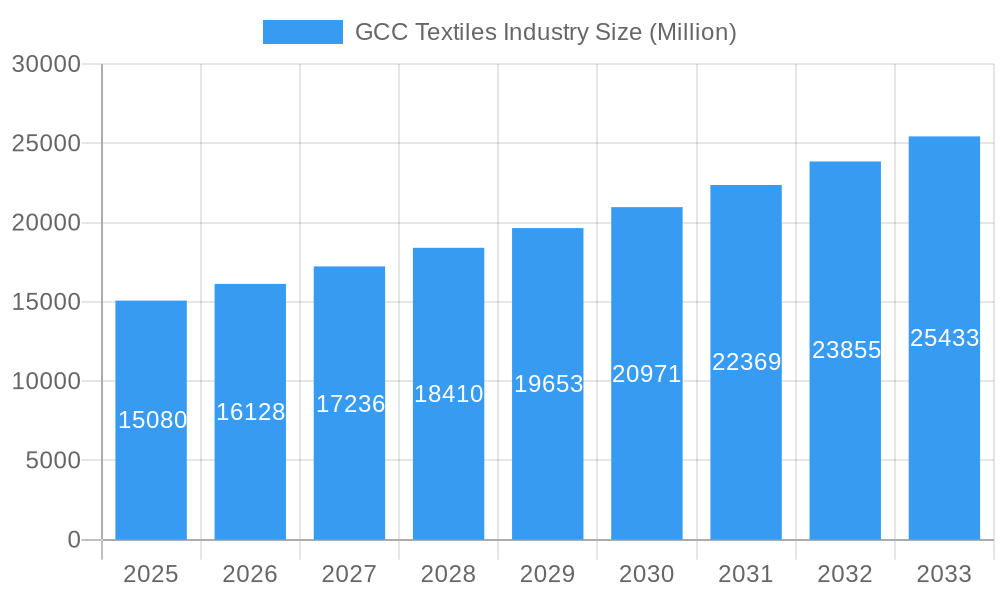
The GCC textiles industry, valued at $15.08 billion in 2025, is projected to experience robust growth, driven by a burgeoning population, increasing disposable incomes, and a rising demand for apparel and home textiles. The 6.78% CAGR from 2019 to 2033 signifies a significant expansion, fueled by factors such as government initiatives promoting local manufacturing, tourism growth boosting demand for textiles, and the region's strategic location facilitating export opportunities. However, the industry faces challenges including competition from cheaper imports, fluctuating cotton prices, and the need for sustainable and ethical production practices. Key segments within the industry include apparel (likely the largest segment), home textiles, technical textiles (growing rapidly due to infrastructure development), and others. Major players such as Unirab & Polvara Spinning Weaving & Silk, Misr Amreya, and AMCO are competing in this dynamic market, often specializing in different segments or leveraging their own unique supply chains and distribution networks. The industry's success will hinge on adapting to evolving consumer preferences, embracing technological advancements in manufacturing and design, and focusing on building strong, sustainable brands.
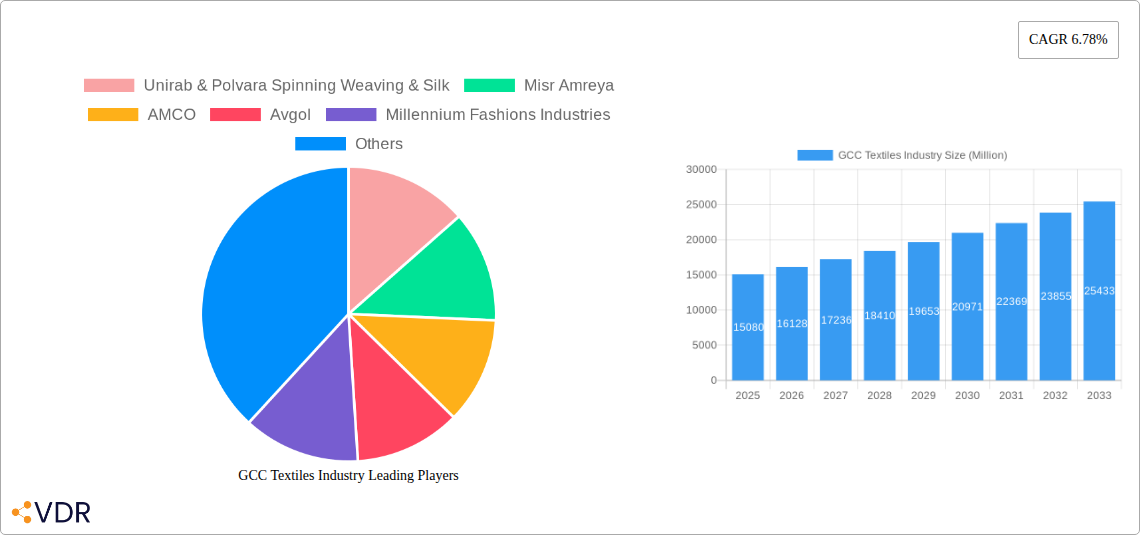
GCC Textiles Industry Market Size (In Billion)
Growth in the coming years will likely be driven by the expanding tourism sector, increasing construction and infrastructure projects (boosting demand for technical textiles), and the continued rise of e-commerce platforms facilitating wider product reach and distribution. While challenges remain, the long-term outlook for the GCC textiles industry remains positive, especially if companies focus on innovation, diversification, and building resilient supply chains. Opportunities exist in niche markets like sustainable textiles and specialized technical fabrics, requiring investment in research and development. The adoption of advanced technologies like automation and precision manufacturing will also play a crucial role in enhancing efficiency and competitiveness. Regional cooperation and strategic partnerships can further strengthen the industry's position in the global market.
GCC Textiles Industry Company Market Share
GCC Textiles Industry: Market Report 2019-2033
This comprehensive report provides an in-depth analysis of the GCC textiles industry, covering market dynamics, growth trends, key players, and future outlook. The study period spans from 2019 to 2033, with 2025 serving as the base and estimated year. This report is essential for industry professionals, investors, and anyone seeking to understand the complexities and opportunities within this dynamic sector. The report utilizes data from various sources, and predicts values where data is unavailable.
GCC Textiles Industry Market Dynamics & Structure
This section analyzes the GCC textiles market's structure, identifying key trends impacting its evolution. The market is characterized by a blend of large multinational corporations and smaller, regionally focused businesses. Market concentration is moderate, with a few dominant players holding significant shares while numerous smaller firms compete in niche segments.
- Market Concentration: xx% held by top 5 players (2024 estimate).
- Technological Innovation: Significant investments in automation and sustainable technologies are driving innovation, albeit facing challenges in adoption rates due to high initial costs and skill gaps.
- Regulatory Framework: The regulatory landscape varies across GCC nations, impacting production costs and compliance requirements. Harmonization efforts are underway but are still in progress.
- Competitive Product Substitutes: The industry faces pressure from synthetic alternatives and imported textiles, particularly in price-sensitive segments.
- End-User Demographics: Growing population and rising disposable incomes are boosting demand for apparel and home textiles, especially within the higher-value segments.
- M&A Trends: A moderate number of M&A deals have been observed in recent years (xx deals in 2019-2024), primarily focused on consolidating market share and accessing new technologies.
GCC Textiles Industry Growth Trends & Insights
The GCC textiles market witnessed substantial growth from 2019 to 2024, driven by factors such as population increase, urbanization, and rising disposable incomes. This trend is projected to continue during the forecast period (2025-2033). While the historical period saw a CAGR of xx%, the forecast period anticipates a more moderate CAGR of xx% due to global economic uncertainty and potential shifts in consumer preference towards sustainable and ethically sourced products. The adoption rate of technologically advanced manufacturing techniques continues to rise, albeit at a slower pace compared to global benchmarks. Consumer behavior is shifting towards higher-value, branded products and a growing preference for sustainable and eco-friendly materials.
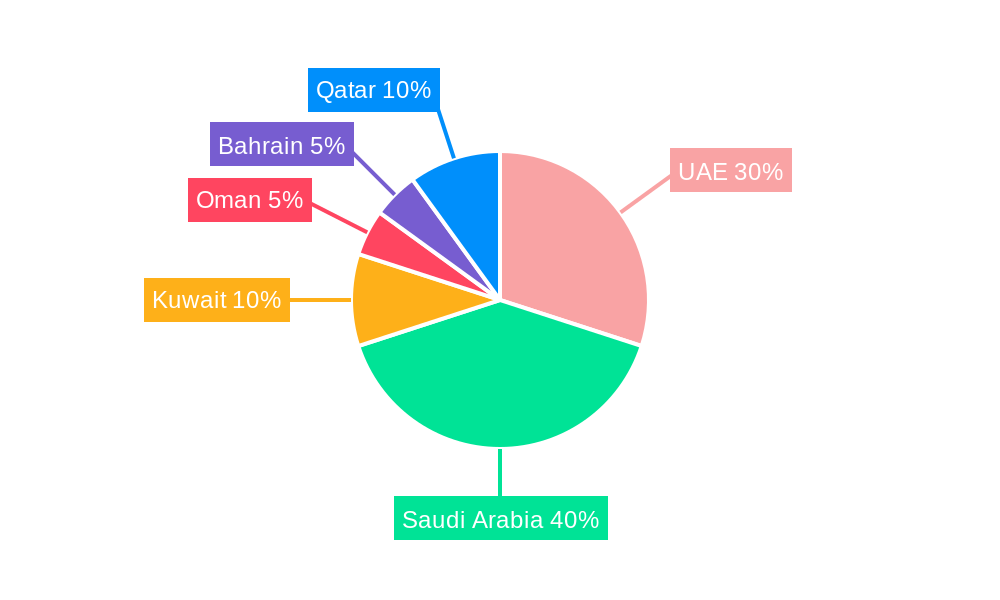
Dominant Regions, Countries, or Segments in GCC Textiles Industry
The UAE and Saudi Arabia are currently the leading markets within the GCC, representing xx% and xx% of the total market value respectively (2024 estimate). This dominance is attributed to several factors:
- UAE: Strong infrastructure, strategic location, and a thriving retail sector contribute to the UAE's leading position.
- Saudi Arabia: Significant government investments in industrial infrastructure and economic diversification initiatives fuel strong growth in the Saudi Arabian textiles sector. Recent initiatives like MODON's USD 1.1 billion textile investment further cement this trend.
- Other GCC Countries: Oman, Kuwait, Qatar, and Bahrain exhibit moderate growth potential, but at a slower pace than the UAE and Saudi Arabia. This variance is driven by factors such as domestic market size, government support, and consumer spending patterns.
GCC Textiles Industry Product Landscape
The GCC textiles industry offers a diverse range of products, including apparel, home textiles, technical textiles, and yarn. Recent innovations focus on enhancing product performance (e.g., moisture-wicking fabrics, antimicrobial treatments) and sustainability (e.g., recycled materials, eco-friendly dyeing processes). This is coupled with a strong emphasis on branding and design, particularly within the higher-value segments of the market.
Key Drivers, Barriers & Challenges in GCC Textiles Industry
Key Drivers:
- Growing Population & Disposable Incomes: Fueling increased demand across all segments.
- Government Initiatives & Investments: Such as Saudi Arabia's MODON initiative are boosting the industry's growth trajectory.
- Tourism: The GCC's thriving tourism sector boosts demand for textiles and apparel.
Challenges:
- Competition from Imports: Particularly from countries with lower production costs.
- Supply Chain Disruptions: Global events and geopolitical instability can negatively impact the supply chain.
- Regulatory Compliance: Varying regulations across GCC nations create complexities. The impact on individual companies depends on their scale and product portfolio. It could amount to an xx% increase in operational costs for some small to medium-sized businesses.
Emerging Opportunities in GCC Textiles Industry
- E-commerce Growth: Expanding online retail channels present significant growth opportunities for textiles companies.
- Sustainable & Ethical Production: Growing consumer preference for sustainable textiles creates opportunities for companies embracing eco-friendly practices.
- Technical Textiles: Expanding use of technical textiles in various industries offers considerable market potential.
Growth Accelerators in the GCC Textiles Industry
Long-term growth will be driven by technological advancements, strategic partnerships (like the Nykaa-Apparel Group collaboration), and expansion into new markets (e.g., e-commerce platforms). The focus on sustainable production practices and the adoption of Industry 4.0 technologies will play a crucial role in shaping the future landscape.
Key Players Shaping the GCC Textiles Industry Market
- Unirab & Polvara Spinning Weaving & Silk
- Misr Amreya
- AMCO
- Avgol
- Millennium Fashions Industries
- Embee Group
- Kabale
- FPC Coated Technical Textiles
- Alyaf Industrial Company Ltd
- Aratex Group
- Lomar Selection
- Valleystar Uniforms (List Not Exhaustive)
Notable Milestones in GCC Textiles Industry Sector
- February 2023: Saudi Arabia's MODON announces USD 1.1 billion in textile investments, signaling significant growth potential.
- October 2022: Nykaa's partnership with Apparel Group marks a significant expansion of its presence in the GCC market.
In-Depth GCC Textiles Industry Market Outlook
The GCC textiles industry is poised for continued growth, driven by favorable demographics, government support, and rising consumer spending. Opportunities exist for companies that focus on innovation, sustainability, and strategic partnerships. The market is expected to reach xx million units by 2033, presenting significant potential for both established players and new entrants. This favorable outlook is predicated on sustained economic growth across the GCC, coupled with proactive government policies and ongoing investments in the sector.
GCC Textiles Industry Segmentation
-
1. Application
- 1.1. Clothing
- 1.2. Industrial/Technical Applications
- 1.3. Household Applications
-
2. Material Type
- 2.1. Cotton
- 2.2. Jute
- 2.3. Silk
- 2.4. Synthetics
- 2.5. Wool
-
3. Process
- 3.1. Woven
- 3.2. Non-woven
GCC Textiles Industry Segmentation By Geography
-
1. North America
- 1.1. United States
- 1.2. Canada
- 1.3. Mexico
-
2. South America
- 2.1. Brazil
- 2.2. Argentina
- 2.3. Rest of South America
-
3. Europe
- 3.1. United Kingdom
- 3.2. Germany
- 3.3. France
- 3.4. Italy
- 3.5. Spain
- 3.6. Russia
- 3.7. Benelux
- 3.8. Nordics
- 3.9. Rest of Europe
-
4. Middle East & Africa
- 4.1. Turkey
- 4.2. Israel
- 4.3. GCC
- 4.4. North Africa
- 4.5. South Africa
- 4.6. Rest of Middle East & Africa
-
5. Asia Pacific
- 5.1. China
- 5.2. India
- 5.3. Japan
- 5.4. South Korea
- 5.5. ASEAN
- 5.6. Oceania
- 5.7. Rest of Asia Pacific
GCC Textiles Industry Regional Market Share
Geographic Coverage of GCC Textiles Industry
GCC Textiles Industry REPORT HIGHLIGHTS
| Aspects | Details |
|---|---|
| Study Period | 2020-2034 |
| Base Year | 2025 |
| Estimated Year | 2026 |
| Forecast Period | 2026-2034 |
| Historical Period | 2020-2025 |
| Growth Rate | CAGR of 6.78% from 2020-2034 |
| Segmentation |
|
Table of Contents
- 1. Introduction
- 1.1. Research Scope
- 1.2. Market Segmentation
- 1.3. Research Objective
- 1.4. Definitions and Assumptions
- 2. Executive Summary
- 2.1. Market Snapshot
- 3. Market Dynamics
- 3.1. Market Drivers
- 3.2. Market Restrains
- 3.3. Market Trends
- 3.4. Market Opportunities
- 4. Market Factor Analysis
- 4.1. Porters Five Forces
- 4.1.1. Bargaining Power of Suppliers
- 4.1.2. Bargaining Power of Buyers
- 4.1.3. Threat of New Entrants
- 4.1.4. Threat of Substitutes
- 4.1.5. Competitive Rivalry
- 4.2. PESTEL analysis
- 4.3. BCG Analysis
- 4.3.1. Stars (High Growth, High Market Share)
- 4.3.2. Cash Cows (Low Growth, High Market Share)
- 4.3.3. Question Mark (High Growth, Low Market Share)
- 4.3.4. Dogs (Low Growth, Low Market Share)
- 4.4. Ansoff Matrix Analysis
- 4.5. Supply Chain Analysis
- 4.6. Regulatory Landscape
- 4.7. Current Market Potential and Opportunity Assessment (TAM–SAM–SOM Framework)
- 4.8. VDR Analyst Note
- 4.1. Porters Five Forces
- 5. Market Analysis, Insights and Forecast 2021-2033
- 5.1. Market Analysis, Insights and Forecast - by Application
- 5.1.1. Clothing
- 5.1.2. Industrial/Technical Applications
- 5.1.3. Household Applications
- 5.2. Market Analysis, Insights and Forecast - by Material Type
- 5.2.1. Cotton
- 5.2.2. Jute
- 5.2.3. Silk
- 5.2.4. Synthetics
- 5.2.5. Wool
- 5.3. Market Analysis, Insights and Forecast - by Process
- 5.3.1. Woven
- 5.3.2. Non-woven
- 5.4. Market Analysis, Insights and Forecast - by Region
- 5.4.1. North America
- 5.4.2. South America
- 5.4.3. Europe
- 5.4.4. Middle East & Africa
- 5.4.5. Asia Pacific
- 5.1. Market Analysis, Insights and Forecast - by Application
- 6. Global GCC Textiles Industry Analysis, Insights and Forecast, 2021-2033
- 6.1. Market Analysis, Insights and Forecast - by Application
- 6.1.1. Clothing
- 6.1.2. Industrial/Technical Applications
- 6.1.3. Household Applications
- 6.2. Market Analysis, Insights and Forecast - by Material Type
- 6.2.1. Cotton
- 6.2.2. Jute
- 6.2.3. Silk
- 6.2.4. Synthetics
- 6.2.5. Wool
- 6.3. Market Analysis, Insights and Forecast - by Process
- 6.3.1. Woven
- 6.3.2. Non-woven
- 6.1. Market Analysis, Insights and Forecast - by Application
- 7. North America GCC Textiles Industry Analysis, Insights and Forecast, 2021-2033
- 7.1. Market Analysis, Insights and Forecast - by Application
- 7.1.1. Clothing
- 7.1.2. Industrial/Technical Applications
- 7.1.3. Household Applications
- 7.2. Market Analysis, Insights and Forecast - by Material Type
- 7.2.1. Cotton
- 7.2.2. Jute
- 7.2.3. Silk
- 7.2.4. Synthetics
- 7.2.5. Wool
- 7.3. Market Analysis, Insights and Forecast - by Process
- 7.3.1. Woven
- 7.3.2. Non-woven
- 7.1. Market Analysis, Insights and Forecast - by Application
- 8. South America GCC Textiles Industry Analysis, Insights and Forecast, 2021-2033
- 8.1. Market Analysis, Insights and Forecast - by Application
- 8.1.1. Clothing
- 8.1.2. Industrial/Technical Applications
- 8.1.3. Household Applications
- 8.2. Market Analysis, Insights and Forecast - by Material Type
- 8.2.1. Cotton
- 8.2.2. Jute
- 8.2.3. Silk
- 8.2.4. Synthetics
- 8.2.5. Wool
- 8.3. Market Analysis, Insights and Forecast - by Process
- 8.3.1. Woven
- 8.3.2. Non-woven
- 8.1. Market Analysis, Insights and Forecast - by Application
- 9. Europe GCC Textiles Industry Analysis, Insights and Forecast, 2021-2033
- 9.1. Market Analysis, Insights and Forecast - by Application
- 9.1.1. Clothing
- 9.1.2. Industrial/Technical Applications
- 9.1.3. Household Applications
- 9.2. Market Analysis, Insights and Forecast - by Material Type
- 9.2.1. Cotton
- 9.2.2. Jute
- 9.2.3. Silk
- 9.2.4. Synthetics
- 9.2.5. Wool
- 9.3. Market Analysis, Insights and Forecast - by Process
- 9.3.1. Woven
- 9.3.2. Non-woven
- 9.1. Market Analysis, Insights and Forecast - by Application
- 10. Middle East & Africa GCC Textiles Industry Analysis, Insights and Forecast, 2021-2033
- 10.1. Market Analysis, Insights and Forecast - by Application
- 10.1.1. Clothing
- 10.1.2. Industrial/Technical Applications
- 10.1.3. Household Applications
- 10.2. Market Analysis, Insights and Forecast - by Material Type
- 10.2.1. Cotton
- 10.2.2. Jute
- 10.2.3. Silk
- 10.2.4. Synthetics
- 10.2.5. Wool
- 10.3. Market Analysis, Insights and Forecast - by Process
- 10.3.1. Woven
- 10.3.2. Non-woven
- 10.1. Market Analysis, Insights and Forecast - by Application
- 11. Asia Pacific GCC Textiles Industry Analysis, Insights and Forecast, 2021-2033
- 11.1. Market Analysis, Insights and Forecast - by Application
- 11.1.1. Clothing
- 11.1.2. Industrial/Technical Applications
- 11.1.3. Household Applications
- 11.2. Market Analysis, Insights and Forecast - by Material Type
- 11.2.1. Cotton
- 11.2.2. Jute
- 11.2.3. Silk
- 11.2.4. Synthetics
- 11.2.5. Wool
- 11.3. Market Analysis, Insights and Forecast - by Process
- 11.3.1. Woven
- 11.3.2. Non-woven
- 11.1. Market Analysis, Insights and Forecast - by Application
- 12. Competitive Analysis
- 12.1. Company Profiles
- 12.1.1 Unirab & Polvara Spinning Weaving & Silk
- 12.1.1.1. Company Overview
- 12.1.1.2. Products
- 12.1.1.3. Company Financials
- 12.1.1.4. SWOT Analysis
- 12.1.2 Misr Amreya
- 12.1.2.1. Company Overview
- 12.1.2.2. Products
- 12.1.2.3. Company Financials
- 12.1.2.4. SWOT Analysis
- 12.1.3 AMCO
- 12.1.3.1. Company Overview
- 12.1.3.2. Products
- 12.1.3.3. Company Financials
- 12.1.3.4. SWOT Analysis
- 12.1.4 Avgol
- 12.1.4.1. Company Overview
- 12.1.4.2. Products
- 12.1.4.3. Company Financials
- 12.1.4.4. SWOT Analysis
- 12.1.5 Millennium Fashions Industries
- 12.1.5.1. Company Overview
- 12.1.5.2. Products
- 12.1.5.3. Company Financials
- 12.1.5.4. SWOT Analysis
- 12.1.6 Embee Group
- 12.1.6.1. Company Overview
- 12.1.6.2. Products
- 12.1.6.3. Company Financials
- 12.1.6.4. SWOT Analysis
- 12.1.7 Kabale
- 12.1.7.1. Company Overview
- 12.1.7.2. Products
- 12.1.7.3. Company Financials
- 12.1.7.4. SWOT Analysis
- 12.1.8 FPC Coated Technical Textiles
- 12.1.8.1. Company Overview
- 12.1.8.2. Products
- 12.1.8.3. Company Financials
- 12.1.8.4. SWOT Analysis
- 12.1.9 Alyaf Industrial Company Ltd
- 12.1.9.1. Company Overview
- 12.1.9.2. Products
- 12.1.9.3. Company Financials
- 12.1.9.4. SWOT Analysis
- 12.1.10 Aratex Group
- 12.1.10.1. Company Overview
- 12.1.10.2. Products
- 12.1.10.3. Company Financials
- 12.1.10.4. SWOT Analysis
- 12.1.11 Lomar Selection
- 12.1.11.1. Company Overview
- 12.1.11.2. Products
- 12.1.11.3. Company Financials
- 12.1.11.4. SWOT Analysis
- 12.1.12 Valleystar Uniforms**List Not Exhaustive
- 12.1.12.1. Company Overview
- 12.1.12.2. Products
- 12.1.12.3. Company Financials
- 12.1.12.4. SWOT Analysis
- 12.1.1 Unirab & Polvara Spinning Weaving & Silk
- 12.2. Market Entropy
- 12.2.1 Company's Key Areas Served
- 12.2.2 Recent Developments
- 12.3. Company Market Share Analysis 2025
- 12.3.1 Top 5 Companies Market Share Analysis
- 12.3.2 Top 3 Companies Market Share Analysis
- 12.4. List of Potential Customers
- 13. Research Methodology
List of Figures
- Figure 1: Global GCC Textiles Industry Revenue Breakdown (Million, %) by Region 2025 & 2033
- Figure 2: Global GCC Textiles Industry Volume Breakdown (Billion, %) by Region 2025 & 2033
- Figure 3: North America GCC Textiles Industry Revenue (Million), by Application 2025 & 2033
- Figure 4: North America GCC Textiles Industry Volume (Billion), by Application 2025 & 2033
- Figure 5: North America GCC Textiles Industry Revenue Share (%), by Application 2025 & 2033
- Figure 6: North America GCC Textiles Industry Volume Share (%), by Application 2025 & 2033
- Figure 7: North America GCC Textiles Industry Revenue (Million), by Material Type 2025 & 2033
- Figure 8: North America GCC Textiles Industry Volume (Billion), by Material Type 2025 & 2033
- Figure 9: North America GCC Textiles Industry Revenue Share (%), by Material Type 2025 & 2033
- Figure 10: North America GCC Textiles Industry Volume Share (%), by Material Type 2025 & 2033
- Figure 11: North America GCC Textiles Industry Revenue (Million), by Process 2025 & 2033
- Figure 12: North America GCC Textiles Industry Volume (Billion), by Process 2025 & 2033
- Figure 13: North America GCC Textiles Industry Revenue Share (%), by Process 2025 & 2033
- Figure 14: North America GCC Textiles Industry Volume Share (%), by Process 2025 & 2033
- Figure 15: North America GCC Textiles Industry Revenue (Million), by Country 2025 & 2033
- Figure 16: North America GCC Textiles Industry Volume (Billion), by Country 2025 & 2033
- Figure 17: North America GCC Textiles Industry Revenue Share (%), by Country 2025 & 2033
- Figure 18: North America GCC Textiles Industry Volume Share (%), by Country 2025 & 2033
- Figure 19: South America GCC Textiles Industry Revenue (Million), by Application 2025 & 2033
- Figure 20: South America GCC Textiles Industry Volume (Billion), by Application 2025 & 2033
- Figure 21: South America GCC Textiles Industry Revenue Share (%), by Application 2025 & 2033
- Figure 22: South America GCC Textiles Industry Volume Share (%), by Application 2025 & 2033
- Figure 23: South America GCC Textiles Industry Revenue (Million), by Material Type 2025 & 2033
- Figure 24: South America GCC Textiles Industry Volume (Billion), by Material Type 2025 & 2033
- Figure 25: South America GCC Textiles Industry Revenue Share (%), by Material Type 2025 & 2033
- Figure 26: South America GCC Textiles Industry Volume Share (%), by Material Type 2025 & 2033
- Figure 27: South America GCC Textiles Industry Revenue (Million), by Process 2025 & 2033
- Figure 28: South America GCC Textiles Industry Volume (Billion), by Process 2025 & 2033
- Figure 29: South America GCC Textiles Industry Revenue Share (%), by Process 2025 & 2033
- Figure 30: South America GCC Textiles Industry Volume Share (%), by Process 2025 & 2033
- Figure 31: South America GCC Textiles Industry Revenue (Million), by Country 2025 & 2033
- Figure 32: South America GCC Textiles Industry Volume (Billion), by Country 2025 & 2033
- Figure 33: South America GCC Textiles Industry Revenue Share (%), by Country 2025 & 2033
- Figure 34: South America GCC Textiles Industry Volume Share (%), by Country 2025 & 2033
- Figure 35: Europe GCC Textiles Industry Revenue (Million), by Application 2025 & 2033
- Figure 36: Europe GCC Textiles Industry Volume (Billion), by Application 2025 & 2033
- Figure 37: Europe GCC Textiles Industry Revenue Share (%), by Application 2025 & 2033
- Figure 38: Europe GCC Textiles Industry Volume Share (%), by Application 2025 & 2033
- Figure 39: Europe GCC Textiles Industry Revenue (Million), by Material Type 2025 & 2033
- Figure 40: Europe GCC Textiles Industry Volume (Billion), by Material Type 2025 & 2033
- Figure 41: Europe GCC Textiles Industry Revenue Share (%), by Material Type 2025 & 2033
- Figure 42: Europe GCC Textiles Industry Volume Share (%), by Material Type 2025 & 2033
- Figure 43: Europe GCC Textiles Industry Revenue (Million), by Process 2025 & 2033
- Figure 44: Europe GCC Textiles Industry Volume (Billion), by Process 2025 & 2033
- Figure 45: Europe GCC Textiles Industry Revenue Share (%), by Process 2025 & 2033
- Figure 46: Europe GCC Textiles Industry Volume Share (%), by Process 2025 & 2033
- Figure 47: Europe GCC Textiles Industry Revenue (Million), by Country 2025 & 2033
- Figure 48: Europe GCC Textiles Industry Volume (Billion), by Country 2025 & 2033
- Figure 49: Europe GCC Textiles Industry Revenue Share (%), by Country 2025 & 2033
- Figure 50: Europe GCC Textiles Industry Volume Share (%), by Country 2025 & 2033
- Figure 51: Middle East & Africa GCC Textiles Industry Revenue (Million), by Application 2025 & 2033
- Figure 52: Middle East & Africa GCC Textiles Industry Volume (Billion), by Application 2025 & 2033
- Figure 53: Middle East & Africa GCC Textiles Industry Revenue Share (%), by Application 2025 & 2033
- Figure 54: Middle East & Africa GCC Textiles Industry Volume Share (%), by Application 2025 & 2033
- Figure 55: Middle East & Africa GCC Textiles Industry Revenue (Million), by Material Type 2025 & 2033
- Figure 56: Middle East & Africa GCC Textiles Industry Volume (Billion), by Material Type 2025 & 2033
- Figure 57: Middle East & Africa GCC Textiles Industry Revenue Share (%), by Material Type 2025 & 2033
- Figure 58: Middle East & Africa GCC Textiles Industry Volume Share (%), by Material Type 2025 & 2033
- Figure 59: Middle East & Africa GCC Textiles Industry Revenue (Million), by Process 2025 & 2033
- Figure 60: Middle East & Africa GCC Textiles Industry Volume (Billion), by Process 2025 & 2033
- Figure 61: Middle East & Africa GCC Textiles Industry Revenue Share (%), by Process 2025 & 2033
- Figure 62: Middle East & Africa GCC Textiles Industry Volume Share (%), by Process 2025 & 2033
- Figure 63: Middle East & Africa GCC Textiles Industry Revenue (Million), by Country 2025 & 2033
- Figure 64: Middle East & Africa GCC Textiles Industry Volume (Billion), by Country 2025 & 2033
- Figure 65: Middle East & Africa GCC Textiles Industry Revenue Share (%), by Country 2025 & 2033
- Figure 66: Middle East & Africa GCC Textiles Industry Volume Share (%), by Country 2025 & 2033
- Figure 67: Asia Pacific GCC Textiles Industry Revenue (Million), by Application 2025 & 2033
- Figure 68: Asia Pacific GCC Textiles Industry Volume (Billion), by Application 2025 & 2033
- Figure 69: Asia Pacific GCC Textiles Industry Revenue Share (%), by Application 2025 & 2033
- Figure 70: Asia Pacific GCC Textiles Industry Volume Share (%), by Application 2025 & 2033
- Figure 71: Asia Pacific GCC Textiles Industry Revenue (Million), by Material Type 2025 & 2033
- Figure 72: Asia Pacific GCC Textiles Industry Volume (Billion), by Material Type 2025 & 2033
- Figure 73: Asia Pacific GCC Textiles Industry Revenue Share (%), by Material Type 2025 & 2033
- Figure 74: Asia Pacific GCC Textiles Industry Volume Share (%), by Material Type 2025 & 2033
- Figure 75: Asia Pacific GCC Textiles Industry Revenue (Million), by Process 2025 & 2033
- Figure 76: Asia Pacific GCC Textiles Industry Volume (Billion), by Process 2025 & 2033
- Figure 77: Asia Pacific GCC Textiles Industry Revenue Share (%), by Process 2025 & 2033
- Figure 78: Asia Pacific GCC Textiles Industry Volume Share (%), by Process 2025 & 2033
- Figure 79: Asia Pacific GCC Textiles Industry Revenue (Million), by Country 2025 & 2033
- Figure 80: Asia Pacific GCC Textiles Industry Volume (Billion), by Country 2025 & 2033
- Figure 81: Asia Pacific GCC Textiles Industry Revenue Share (%), by Country 2025 & 2033
- Figure 82: Asia Pacific GCC Textiles Industry Volume Share (%), by Country 2025 & 2033
List of Tables
- Table 1: Global GCC Textiles Industry Revenue Million Forecast, by Application 2020 & 2033
- Table 2: Global GCC Textiles Industry Volume Billion Forecast, by Application 2020 & 2033
- Table 3: Global GCC Textiles Industry Revenue Million Forecast, by Material Type 2020 & 2033
- Table 4: Global GCC Textiles Industry Volume Billion Forecast, by Material Type 2020 & 2033
- Table 5: Global GCC Textiles Industry Revenue Million Forecast, by Process 2020 & 2033
- Table 6: Global GCC Textiles Industry Volume Billion Forecast, by Process 2020 & 2033
- Table 7: Global GCC Textiles Industry Revenue Million Forecast, by Region 2020 & 2033
- Table 8: Global GCC Textiles Industry Volume Billion Forecast, by Region 2020 & 2033
- Table 9: Global GCC Textiles Industry Revenue Million Forecast, by Application 2020 & 2033
- Table 10: Global GCC Textiles Industry Volume Billion Forecast, by Application 2020 & 2033
- Table 11: Global GCC Textiles Industry Revenue Million Forecast, by Material Type 2020 & 2033
- Table 12: Global GCC Textiles Industry Volume Billion Forecast, by Material Type 2020 & 2033
- Table 13: Global GCC Textiles Industry Revenue Million Forecast, by Process 2020 & 2033
- Table 14: Global GCC Textiles Industry Volume Billion Forecast, by Process 2020 & 2033
- Table 15: Global GCC Textiles Industry Revenue Million Forecast, by Country 2020 & 2033
- Table 16: Global GCC Textiles Industry Volume Billion Forecast, by Country 2020 & 2033
- Table 17: United States GCC Textiles Industry Revenue (Million) Forecast, by Application 2020 & 2033
- Table 18: United States GCC Textiles Industry Volume (Billion) Forecast, by Application 2020 & 2033
- Table 19: Canada GCC Textiles Industry Revenue (Million) Forecast, by Application 2020 & 2033
- Table 20: Canada GCC Textiles Industry Volume (Billion) Forecast, by Application 2020 & 2033
- Table 21: Mexico GCC Textiles Industry Revenue (Million) Forecast, by Application 2020 & 2033
- Table 22: Mexico GCC Textiles Industry Volume (Billion) Forecast, by Application 2020 & 2033
- Table 23: Global GCC Textiles Industry Revenue Million Forecast, by Application 2020 & 2033
- Table 24: Global GCC Textiles Industry Volume Billion Forecast, by Application 2020 & 2033
- Table 25: Global GCC Textiles Industry Revenue Million Forecast, by Material Type 2020 & 2033
- Table 26: Global GCC Textiles Industry Volume Billion Forecast, by Material Type 2020 & 2033
- Table 27: Global GCC Textiles Industry Revenue Million Forecast, by Process 2020 & 2033
- Table 28: Global GCC Textiles Industry Volume Billion Forecast, by Process 2020 & 2033
- Table 29: Global GCC Textiles Industry Revenue Million Forecast, by Country 2020 & 2033
- Table 30: Global GCC Textiles Industry Volume Billion Forecast, by Country 2020 & 2033
- Table 31: Brazil GCC Textiles Industry Revenue (Million) Forecast, by Application 2020 & 2033
- Table 32: Brazil GCC Textiles Industry Volume (Billion) Forecast, by Application 2020 & 2033
- Table 33: Argentina GCC Textiles Industry Revenue (Million) Forecast, by Application 2020 & 2033
- Table 34: Argentina GCC Textiles Industry Volume (Billion) Forecast, by Application 2020 & 2033
- Table 35: Rest of South America GCC Textiles Industry Revenue (Million) Forecast, by Application 2020 & 2033
- Table 36: Rest of South America GCC Textiles Industry Volume (Billion) Forecast, by Application 2020 & 2033
- Table 37: Global GCC Textiles Industry Revenue Million Forecast, by Application 2020 & 2033
- Table 38: Global GCC Textiles Industry Volume Billion Forecast, by Application 2020 & 2033
- Table 39: Global GCC Textiles Industry Revenue Million Forecast, by Material Type 2020 & 2033
- Table 40: Global GCC Textiles Industry Volume Billion Forecast, by Material Type 2020 & 2033
- Table 41: Global GCC Textiles Industry Revenue Million Forecast, by Process 2020 & 2033
- Table 42: Global GCC Textiles Industry Volume Billion Forecast, by Process 2020 & 2033
- Table 43: Global GCC Textiles Industry Revenue Million Forecast, by Country 2020 & 2033
- Table 44: Global GCC Textiles Industry Volume Billion Forecast, by Country 2020 & 2033
- Table 45: United Kingdom GCC Textiles Industry Revenue (Million) Forecast, by Application 2020 & 2033
- Table 46: United Kingdom GCC Textiles Industry Volume (Billion) Forecast, by Application 2020 & 2033
- Table 47: Germany GCC Textiles Industry Revenue (Million) Forecast, by Application 2020 & 2033
- Table 48: Germany GCC Textiles Industry Volume (Billion) Forecast, by Application 2020 & 2033
- Table 49: France GCC Textiles Industry Revenue (Million) Forecast, by Application 2020 & 2033
- Table 50: France GCC Textiles Industry Volume (Billion) Forecast, by Application 2020 & 2033
- Table 51: Italy GCC Textiles Industry Revenue (Million) Forecast, by Application 2020 & 2033
- Table 52: Italy GCC Textiles Industry Volume (Billion) Forecast, by Application 2020 & 2033
- Table 53: Spain GCC Textiles Industry Revenue (Million) Forecast, by Application 2020 & 2033
- Table 54: Spain GCC Textiles Industry Volume (Billion) Forecast, by Application 2020 & 2033
- Table 55: Russia GCC Textiles Industry Revenue (Million) Forecast, by Application 2020 & 2033
- Table 56: Russia GCC Textiles Industry Volume (Billion) Forecast, by Application 2020 & 2033
- Table 57: Benelux GCC Textiles Industry Revenue (Million) Forecast, by Application 2020 & 2033
- Table 58: Benelux GCC Textiles Industry Volume (Billion) Forecast, by Application 2020 & 2033
- Table 59: Nordics GCC Textiles Industry Revenue (Million) Forecast, by Application 2020 & 2033
- Table 60: Nordics GCC Textiles Industry Volume (Billion) Forecast, by Application 2020 & 2033
- Table 61: Rest of Europe GCC Textiles Industry Revenue (Million) Forecast, by Application 2020 & 2033
- Table 62: Rest of Europe GCC Textiles Industry Volume (Billion) Forecast, by Application 2020 & 2033
- Table 63: Global GCC Textiles Industry Revenue Million Forecast, by Application 2020 & 2033
- Table 64: Global GCC Textiles Industry Volume Billion Forecast, by Application 2020 & 2033
- Table 65: Global GCC Textiles Industry Revenue Million Forecast, by Material Type 2020 & 2033
- Table 66: Global GCC Textiles Industry Volume Billion Forecast, by Material Type 2020 & 2033
- Table 67: Global GCC Textiles Industry Revenue Million Forecast, by Process 2020 & 2033
- Table 68: Global GCC Textiles Industry Volume Billion Forecast, by Process 2020 & 2033
- Table 69: Global GCC Textiles Industry Revenue Million Forecast, by Country 2020 & 2033
- Table 70: Global GCC Textiles Industry Volume Billion Forecast, by Country 2020 & 2033
- Table 71: Turkey GCC Textiles Industry Revenue (Million) Forecast, by Application 2020 & 2033
- Table 72: Turkey GCC Textiles Industry Volume (Billion) Forecast, by Application 2020 & 2033
- Table 73: Israel GCC Textiles Industry Revenue (Million) Forecast, by Application 2020 & 2033
- Table 74: Israel GCC Textiles Industry Volume (Billion) Forecast, by Application 2020 & 2033
- Table 75: GCC GCC Textiles Industry Revenue (Million) Forecast, by Application 2020 & 2033
- Table 76: GCC GCC Textiles Industry Volume (Billion) Forecast, by Application 2020 & 2033
- Table 77: North Africa GCC Textiles Industry Revenue (Million) Forecast, by Application 2020 & 2033
- Table 78: North Africa GCC Textiles Industry Volume (Billion) Forecast, by Application 2020 & 2033
- Table 79: South Africa GCC Textiles Industry Revenue (Million) Forecast, by Application 2020 & 2033
- Table 80: South Africa GCC Textiles Industry Volume (Billion) Forecast, by Application 2020 & 2033
- Table 81: Rest of Middle East & Africa GCC Textiles Industry Revenue (Million) Forecast, by Application 2020 & 2033
- Table 82: Rest of Middle East & Africa GCC Textiles Industry Volume (Billion) Forecast, by Application 2020 & 2033
- Table 83: Global GCC Textiles Industry Revenue Million Forecast, by Application 2020 & 2033
- Table 84: Global GCC Textiles Industry Volume Billion Forecast, by Application 2020 & 2033
- Table 85: Global GCC Textiles Industry Revenue Million Forecast, by Material Type 2020 & 2033
- Table 86: Global GCC Textiles Industry Volume Billion Forecast, by Material Type 2020 & 2033
- Table 87: Global GCC Textiles Industry Revenue Million Forecast, by Process 2020 & 2033
- Table 88: Global GCC Textiles Industry Volume Billion Forecast, by Process 2020 & 2033
- Table 89: Global GCC Textiles Industry Revenue Million Forecast, by Country 2020 & 2033
- Table 90: Global GCC Textiles Industry Volume Billion Forecast, by Country 2020 & 2033
- Table 91: China GCC Textiles Industry Revenue (Million) Forecast, by Application 2020 & 2033
- Table 92: China GCC Textiles Industry Volume (Billion) Forecast, by Application 2020 & 2033
- Table 93: India GCC Textiles Industry Revenue (Million) Forecast, by Application 2020 & 2033
- Table 94: India GCC Textiles Industry Volume (Billion) Forecast, by Application 2020 & 2033
- Table 95: Japan GCC Textiles Industry Revenue (Million) Forecast, by Application 2020 & 2033
- Table 96: Japan GCC Textiles Industry Volume (Billion) Forecast, by Application 2020 & 2033
- Table 97: South Korea GCC Textiles Industry Revenue (Million) Forecast, by Application 2020 & 2033
- Table 98: South Korea GCC Textiles Industry Volume (Billion) Forecast, by Application 2020 & 2033
- Table 99: ASEAN GCC Textiles Industry Revenue (Million) Forecast, by Application 2020 & 2033
- Table 100: ASEAN GCC Textiles Industry Volume (Billion) Forecast, by Application 2020 & 2033
- Table 101: Oceania GCC Textiles Industry Revenue (Million) Forecast, by Application 2020 & 2033
- Table 102: Oceania GCC Textiles Industry Volume (Billion) Forecast, by Application 2020 & 2033
- Table 103: Rest of Asia Pacific GCC Textiles Industry Revenue (Million) Forecast, by Application 2020 & 2033
- Table 104: Rest of Asia Pacific GCC Textiles Industry Volume (Billion) Forecast, by Application 2020 & 2033
Frequently Asked Questions
1. What is the projected Compound Annual Growth Rate (CAGR) of the GCC Textiles Industry?
The projected CAGR is approximately 6.78%.
2. Which companies are prominent players in the GCC Textiles Industry?
Key companies in the market include Unirab & Polvara Spinning Weaving & Silk, Misr Amreya, AMCO, Avgol, Millennium Fashions Industries, Embee Group, Kabale, FPC Coated Technical Textiles, Alyaf Industrial Company Ltd, Aratex Group, Lomar Selection, Valleystar Uniforms**List Not Exhaustive.
3. What are the main segments of the GCC Textiles Industry?
The market segments include Application, Material Type, Process.
4. Can you provide details about the market size?
The market size is estimated to be USD 15.08 Million as of 2022.
5. What are some drivers contributing to market growth?
3.; Growing fashion consciousness3.; Export Opportunities.
6. What are the notable trends driving market growth?
Rising Textile and Apparels Demand in UAE.
7. Are there any restraints impacting market growth?
3.; Growing fashion consciousness3.; Export Opportunities.
8. Can you provide examples of recent developments in the market?
Febuary 2023, Saudi’s MODON announces USD 1.1bn textile investments. These investments are distributed over 125 industrial contracts in 19 industrial cities, covering a total area of more than one million square meters. According to Al-Argoubi, the textiles and men’s supplies sector is experiencing high growth in the Kingdom.
9. What pricing options are available for accessing the report?
Pricing options include single-user, multi-user, and enterprise licenses priced at USD 3800, USD 4500, and USD 5800 respectively.
10. Is the market size provided in terms of value or volume?
The market size is provided in terms of value, measured in Million and volume, measured in Billion.
11. Are there any specific market keywords associated with the report?
Yes, the market keyword associated with the report is "GCC Textiles Industry," which aids in identifying and referencing the specific market segment covered.
12. How do I determine which pricing option suits my needs best?
The pricing options vary based on user requirements and access needs. Individual users may opt for single-user licenses, while businesses requiring broader access may choose multi-user or enterprise licenses for cost-effective access to the report.
13. Are there any additional resources or data provided in the GCC Textiles Industry report?
While the report offers comprehensive insights, it's advisable to review the specific contents or supplementary materials provided to ascertain if additional resources or data are available.
14. How can I stay updated on further developments or reports in the GCC Textiles Industry?
To stay informed about further developments, trends, and reports in the GCC Textiles Industry, consider subscribing to industry newsletters, following relevant companies and organizations, or regularly checking reputable industry news sources and publications.
Methodology
Step 1 - Identification of Relevant Samples Size from Population Database


Step 2 - Approaches for Defining Global Market Size (Value, Volume* & Price*)

Note*: In applicable scenarios
Step 3 - Data Sources
Primary Research
- Web Analytics
- Survey Reports
- Research Institute
- Latest Research Reports
- Opinion Leaders
Secondary Research
- Annual Reports
- White Paper
- Latest Press Release
- Industry Association
- Paid Database
- Investor Presentations

Step 4 - Data Triangulation
Involves using different sources of information in order to increase the validity of a study
These sources are likely to be stakeholders in a program - participants, other researchers, program staff, other community members, and so on.
Then we put all data in single framework & apply various statistical tools to find out the dynamic on the market.
During the analysis stage, feedback from the stakeholder groups would be compared to determine areas of agreement as well as areas of divergence