
Key Insights
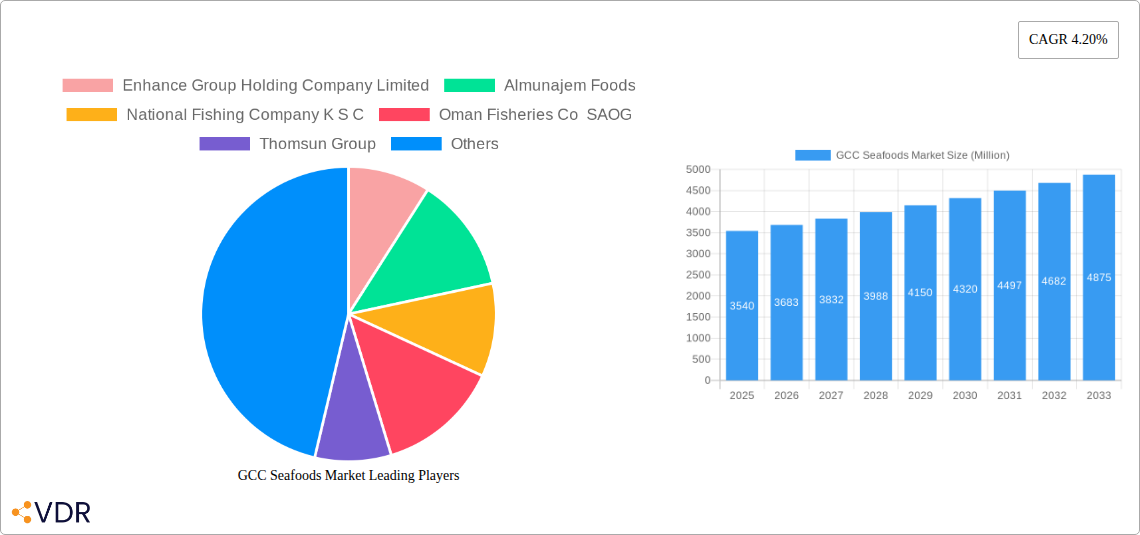
The GCC seafood market, valued at $3.54 billion in 2025, is projected to experience robust growth, driven by several key factors. Rising disposable incomes within the region, coupled with a growing preference for healthy and diverse dietary options, are significantly boosting seafood consumption. The increasing popularity of seafood in restaurants and the expansion of organized retail channels, particularly supermarkets and hypermarkets offering a wider variety of fresh, frozen, and processed seafood, contribute to this upward trend. Furthermore, government initiatives promoting sustainable fishing practices and aquaculture development are supporting market expansion. While challenges exist, such as fluctuations in global seafood prices and concerns about food safety and traceability, the overall market outlook remains positive. The strong tourism sector in the GCC also fuels demand, particularly in the on-trade segment. Specific segment growth will vary; for instance, the demand for convenient processed seafood is expected to outpace that of fresh seafood in certain areas, while the canned seafood segment may show more moderate growth. The distribution channel breakdown will likely favor off-trade channels due to the expanding retail landscape, although the on-trade segment (restaurants, hotels) will maintain a significant share, especially for higher-value seafood products.
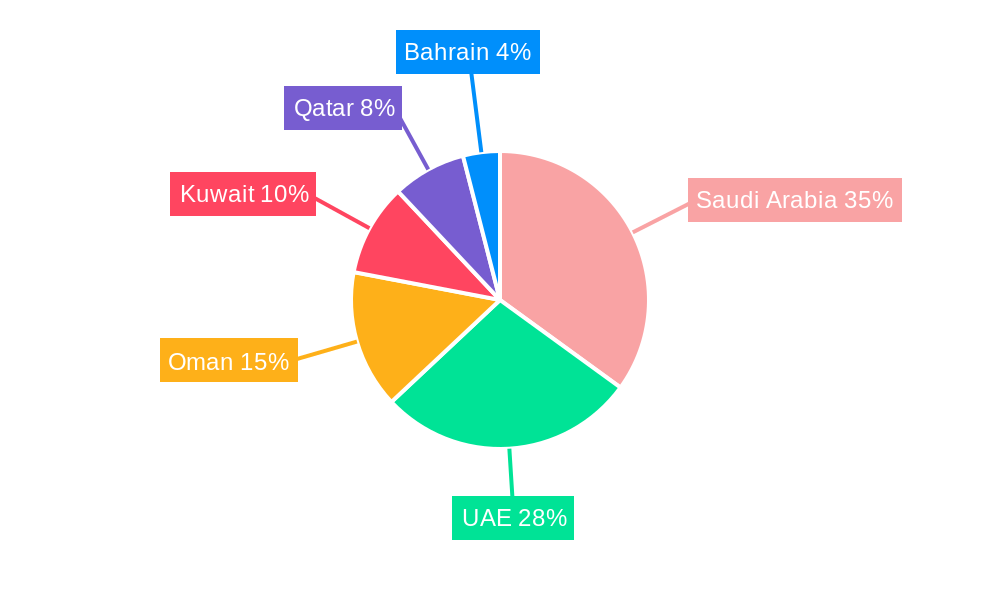
The market's segmentation highlights the diverse nature of the GCC seafood industry. Within the GCC, Saudi Arabia and the UAE are expected to remain the largest markets, owing to their larger populations and higher per capita incomes. However, other countries like Oman and Kuwait are also showing promising growth trajectories, fueled by investments in infrastructure and expanding tourism sectors. Competition within the market is fierce, with both regional players and international companies vying for market share. Successful players are likely to focus on supply chain efficiency, quality control, and brand building to gain a competitive edge. Future growth hinges on effective management of resources, adherence to sustainability standards, and leveraging technological advancements to improve processing, distribution, and traceability. The forecast period of 2025-2033 will see the market continue its upward trajectory, though the specific growth rate might fluctuate depending on global economic conditions and consumer spending patterns.
GCC Seafoods Market: A Comprehensive Market Report (2019-2033)
This comprehensive report provides a detailed analysis of the GCC seafoods market, encompassing market dynamics, growth trends, dominant segments, and key players. The study period covers 2019-2033, with a base year of 2025 and a forecast period of 2025-2033. The report offers invaluable insights for industry professionals, investors, and businesses seeking to capitalize on the lucrative opportunities within this rapidly evolving market. Market size is presented in Million units.
GCC Seafoods Market Dynamics & Structure
The GCC seafoods market is characterized by moderate concentration, with several key players holding significant market share. Technological innovation, particularly in processing and preservation techniques, is a crucial driver. Stringent regulatory frameworks governing food safety and sustainability influence market practices. Competitive substitutes, such as plant-based alternatives, are emerging, albeit slowly. The end-user demographic is diverse, ranging from individual consumers to large foodservice establishments. M&A activity has been moderate, with a noticeable uptick in recent years driven by expansion strategies and consolidation efforts. Market share is approximately distributed as follows: Top 3 players (xx%), next 5 players (xx%), remaining players (xx%). The average deal size for M&A transactions in the last five years was approximately xx Million.
- Market Concentration: Moderate, with a few dominant players.
- Technological Innovation: Focus on improved processing, preservation, and sustainable fishing practices.
- Regulatory Framework: Stringent food safety and sustainability regulations.
- Competitive Substitutes: Plant-based alternatives are emerging, posing a minor threat currently.
- End-User Demographics: Diverse, including retail consumers, foodservice, and wholesale buyers.
- M&A Trends: Moderate activity, primarily driven by expansion and consolidation.
GCC Seafoods Market Growth Trends & Insights
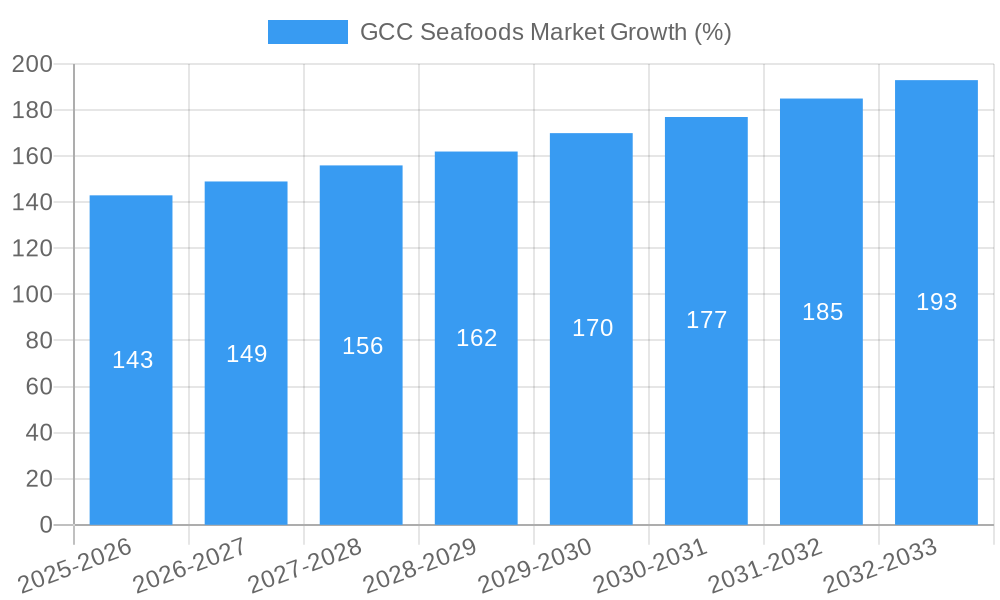
The GCC seafoods market has witnessed a steady growth trajectory over the past few years, driven by rising disposable incomes, increasing demand for high-quality protein, and changing consumer preferences. The market size in 2024 was estimated to be xx Million, and is projected to reach xx Million by 2033, representing a CAGR of xx%. This growth is fueled by factors like the rising popularity of seafood as a healthy dietary choice, increased tourism, and government initiatives promoting sustainable aquaculture. Technological advancements in processing and packaging have also contributed positively. Consumer behavior is shifting towards premium products and sustainably sourced seafood.
Dominant Regions, Countries, or Segments in GCC Seafoods Market
The UAE currently holds the largest market share within the GCC region due to its robust infrastructure, high per capita income, and large population. The Frozen segment dominates in terms of form, driven by its convenience and longer shelf life. Off-trade distribution channels, comprising supermarkets and hypermarkets, account for the significant portion of sales. Shrimp holds the highest share in the type category, followed by fish.
- Leading Region: United Arab Emirates (UAE)
- Dominant Form: Frozen
- Key Distribution Channel: Off-Trade
- Leading Type: Shrimp
Drivers for UAE dominance:
- High per capita income and strong purchasing power.
- Well-developed retail infrastructure.
- High tourism rates.
- Growing preference for processed & convenient foods.
GCC Seafoods Market Product Landscape
The GCC seafoods market showcases a wide range of products, including canned, fresh/chilled, frozen, and processed seafood. Innovation focuses on extending shelf life through advanced packaging, developing value-added products, and catering to diverse consumer preferences (e.g., organic, sustainably sourced). Key selling points include quality, freshness, convenience, and sustainability certifications. Technological advancements are focused on automation in processing plants, improving traceability systems, and enhancing food safety measures.
Key Drivers, Barriers & Challenges in GCC Seafoods Market
Key Drivers:
- Increasing per capita income and rising demand for protein.
- Growing awareness of seafood’s health benefits.
- Tourism and the hospitality sector.
Challenges and Restraints:
- Fluctuations in seafood supply due to overfishing and climate change.
- Stringent regulations and compliance costs impacting profitability.
- Competition from imported seafood and plant-based alternatives.
Emerging Opportunities in GCC Seafoods Market
Opportunities lie in expanding into niche markets, such as value-added and processed seafood, tapping into the growing demand for sustainable and traceable products, and exploring innovative packaging solutions to extend shelf life. There is also room for further penetration in the foodservice sector and the development of premium seafood offerings. The rising middle class and increased health consciousness present strong growth potential.
Growth Accelerators in the GCC Seafoods Market Industry
Technological advancements in processing, packaging, and sustainable aquaculture are significant long-term growth drivers. Strategic partnerships and collaborations among industry players, including fishing companies, processors, and retailers, can streamline supply chains and enhance efficiency. Furthermore, government initiatives focused on promoting sustainable fishing practices and supporting the aquaculture industry can further accelerate market expansion.
Key Players Shaping the GCC Seafoods Market Market
- Enhance Group Holding Company Limited
- Almunajem Foods
- National Fishing Company K S C
- Oman Fisheries Co SAOG
- Thomsun Group
- Sea Pride LLC
- Albatha Group
- The Deep Seafood Company
- Blue Island PLC
- Yamama Al-Baida Gen Trading & Cont Est
Notable Milestones in GCC Seafoods Market Sector
- May 2022: Gulf Japan Food Fund invested in Oman Fisheries Co SAOG, boosting its global expansion capabilities.
- February 2022: Asmak secured a strategic distribution agreement with Fish Farm, expanding its market reach.
In-Depth GCC Seafoods Market Market Outlook
The GCC seafoods market is poised for continued growth over the forecast period, driven by strong underlying fundamentals. Opportunities exist in developing innovative products, enhancing supply chain efficiency, and embracing sustainable practices. Strategic partnerships, technological advancements, and government support will be key factors in realizing the market’s full potential. The market is projected to witness significant expansion in value-added products and increased penetration within the food service and hospitality sectors.
GCC Seafoods Market Segmentation
-
1. Type
- 1.1. Fish
- 1.2. Shrimp
- 1.3. Other Seafood
-
2. Form
- 2.1. Canned
- 2.2. Fresh / Chilled
- 2.3. Frozen
- 2.4. Processed
-
3. Distribution Channel
-
3.1. Off-Trade
- 3.1.1. Convenience Stores
- 3.1.2. Online Channel
- 3.1.3. Supermarkets and Hypermarkets
- 3.1.4. Others
- 3.2. On-Trade
-
3.1. Off-Trade
GCC Seafoods Market Segmentation By Geography
-
1. North America
- 1.1. United States
- 1.2. Canada
- 1.3. Mexico
-
2. South America
- 2.1. Brazil
- 2.2. Argentina
- 2.3. Rest of South America
-
3. Europe
- 3.1. United Kingdom
- 3.2. Germany
- 3.3. France
- 3.4. Italy
- 3.5. Spain
- 3.6. Russia
- 3.7. Benelux
- 3.8. Nordics
- 3.9. Rest of Europe
-
4. Middle East & Africa
- 4.1. Turkey
- 4.2. Israel
- 4.3. GCC
- 4.4. North Africa
- 4.5. South Africa
- 4.6. Rest of Middle East & Africa
-
5. Asia Pacific
- 5.1. China
- 5.2. India
- 5.3. Japan
- 5.4. South Korea
- 5.5. ASEAN
- 5.6. Oceania
- 5.7. Rest of Asia Pacific
GCC Seafoods Market REPORT HIGHLIGHTS
| Aspects | Details |
|---|---|
| Study Period | 2019-2033 |
| Base Year | 2024 |
| Estimated Year | 2025 |
| Forecast Period | 2025-2033 |
| Historical Period | 2019-2024 |
| Growth Rate | CAGR of 4.20% from 2019-2033 |
| Segmentation |
|
Table of Contents
- 1. Introduction
- 1.1. Research Scope
- 1.2. Market Segmentation
- 1.3. Research Methodology
- 1.4. Definitions and Assumptions
- 2. Executive Summary
- 2.1. Introduction
- 3. Market Dynamics
- 3.1. Introduction
- 3.2. Market Drivers
- 3.2.1. Escalating Demand for Processed Poultry Products; Favorable Government Initiatives to Boost Production
- 3.3. Market Restrains
- 3.3.1. Rising Vegan Trend among Young Consumers; Deeper Penetration of Red Meat Across Saudi Arabia
- 3.4. Market Trends
- 3.4.1. OTHER KEY INDUSTRY TRENDS COVERED IN THE REPORT
- 4. Market Factor Analysis
- 4.1. Porters Five Forces
- 4.2. Supply/Value Chain
- 4.3. PESTEL analysis
- 4.4. Market Entropy
- 4.5. Patent/Trademark Analysis
- 5. Global GCC Seafoods Market Analysis, Insights and Forecast, 2019-2031
- 5.1. Market Analysis, Insights and Forecast - by Type
- 5.1.1. Fish
- 5.1.2. Shrimp
- 5.1.3. Other Seafood
- 5.2. Market Analysis, Insights and Forecast - by Form
- 5.2.1. Canned
- 5.2.2. Fresh / Chilled
- 5.2.3. Frozen
- 5.2.4. Processed
- 5.3. Market Analysis, Insights and Forecast - by Distribution Channel
- 5.3.1. Off-Trade
- 5.3.1.1. Convenience Stores
- 5.3.1.2. Online Channel
- 5.3.1.3. Supermarkets and Hypermarkets
- 5.3.1.4. Others
- 5.3.2. On-Trade
- 5.3.1. Off-Trade
- 5.4. Market Analysis, Insights and Forecast - by Region
- 5.4.1. North America
- 5.4.2. South America
- 5.4.3. Europe
- 5.4.4. Middle East & Africa
- 5.4.5. Asia Pacific
- 5.1. Market Analysis, Insights and Forecast - by Type
- 6. North America GCC Seafoods Market Analysis, Insights and Forecast, 2019-2031
- 6.1. Market Analysis, Insights and Forecast - by Type
- 6.1.1. Fish
- 6.1.2. Shrimp
- 6.1.3. Other Seafood
- 6.2. Market Analysis, Insights and Forecast - by Form
- 6.2.1. Canned
- 6.2.2. Fresh / Chilled
- 6.2.3. Frozen
- 6.2.4. Processed
- 6.3. Market Analysis, Insights and Forecast - by Distribution Channel
- 6.3.1. Off-Trade
- 6.3.1.1. Convenience Stores
- 6.3.1.2. Online Channel
- 6.3.1.3. Supermarkets and Hypermarkets
- 6.3.1.4. Others
- 6.3.2. On-Trade
- 6.3.1. Off-Trade
- 6.1. Market Analysis, Insights and Forecast - by Type
- 7. South America GCC Seafoods Market Analysis, Insights and Forecast, 2019-2031
- 7.1. Market Analysis, Insights and Forecast - by Type
- 7.1.1. Fish
- 7.1.2. Shrimp
- 7.1.3. Other Seafood
- 7.2. Market Analysis, Insights and Forecast - by Form
- 7.2.1. Canned
- 7.2.2. Fresh / Chilled
- 7.2.3. Frozen
- 7.2.4. Processed
- 7.3. Market Analysis, Insights and Forecast - by Distribution Channel
- 7.3.1. Off-Trade
- 7.3.1.1. Convenience Stores
- 7.3.1.2. Online Channel
- 7.3.1.3. Supermarkets and Hypermarkets
- 7.3.1.4. Others
- 7.3.2. On-Trade
- 7.3.1. Off-Trade
- 7.1. Market Analysis, Insights and Forecast - by Type
- 8. Europe GCC Seafoods Market Analysis, Insights and Forecast, 2019-2031
- 8.1. Market Analysis, Insights and Forecast - by Type
- 8.1.1. Fish
- 8.1.2. Shrimp
- 8.1.3. Other Seafood
- 8.2. Market Analysis, Insights and Forecast - by Form
- 8.2.1. Canned
- 8.2.2. Fresh / Chilled
- 8.2.3. Frozen
- 8.2.4. Processed
- 8.3. Market Analysis, Insights and Forecast - by Distribution Channel
- 8.3.1. Off-Trade
- 8.3.1.1. Convenience Stores
- 8.3.1.2. Online Channel
- 8.3.1.3. Supermarkets and Hypermarkets
- 8.3.1.4. Others
- 8.3.2. On-Trade
- 8.3.1. Off-Trade
- 8.1. Market Analysis, Insights and Forecast - by Type
- 9. Middle East & Africa GCC Seafoods Market Analysis, Insights and Forecast, 2019-2031
- 9.1. Market Analysis, Insights and Forecast - by Type
- 9.1.1. Fish
- 9.1.2. Shrimp
- 9.1.3. Other Seafood
- 9.2. Market Analysis, Insights and Forecast - by Form
- 9.2.1. Canned
- 9.2.2. Fresh / Chilled
- 9.2.3. Frozen
- 9.2.4. Processed
- 9.3. Market Analysis, Insights and Forecast - by Distribution Channel
- 9.3.1. Off-Trade
- 9.3.1.1. Convenience Stores
- 9.3.1.2. Online Channel
- 9.3.1.3. Supermarkets and Hypermarkets
- 9.3.1.4. Others
- 9.3.2. On-Trade
- 9.3.1. Off-Trade
- 9.1. Market Analysis, Insights and Forecast - by Type
- 10. Asia Pacific GCC Seafoods Market Analysis, Insights and Forecast, 2019-2031
- 10.1. Market Analysis, Insights and Forecast - by Type
- 10.1.1. Fish
- 10.1.2. Shrimp
- 10.1.3. Other Seafood
- 10.2. Market Analysis, Insights and Forecast - by Form
- 10.2.1. Canned
- 10.2.2. Fresh / Chilled
- 10.2.3. Frozen
- 10.2.4. Processed
- 10.3. Market Analysis, Insights and Forecast - by Distribution Channel
- 10.3.1. Off-Trade
- 10.3.1.1. Convenience Stores
- 10.3.1.2. Online Channel
- 10.3.1.3. Supermarkets and Hypermarkets
- 10.3.1.4. Others
- 10.3.2. On-Trade
- 10.3.1. Off-Trade
- 10.1. Market Analysis, Insights and Forecast - by Type
- 11. North America GCC Seafoods Market Analysis, Insights and Forecast, 2019-2031
- 11.1. Market Analysis, Insights and Forecast - By Country/Sub-region
- 11.1.1 United States
- 11.1.2 Canada
- 11.1.3 Mexico
- 11.1.4 Rest of North America
- 12. Europe GCC Seafoods Market Analysis, Insights and Forecast, 2019-2031
- 12.1. Market Analysis, Insights and Forecast - By Country/Sub-region
- 12.1.1 United Kingdom
- 12.1.2 Germany
- 12.1.3 France
- 12.1.4 Russia
- 12.1.5 Italy
- 12.1.6 Spain
- 12.1.7 Rest of Europe
- 13. Asia Pacific GCC Seafoods Market Analysis, Insights and Forecast, 2019-2031
- 13.1. Market Analysis, Insights and Forecast - By Country/Sub-region
- 13.1.1 India
- 13.1.2 China
- 13.1.3 Japan
- 13.1.4 Australia
- 13.1.5 Rest of Asia Pacific
- 14. South America GCC Seafoods Market Analysis, Insights and Forecast, 2019-2031
- 14.1. Market Analysis, Insights and Forecast - By Country/Sub-region
- 14.1.1 Brazil
- 14.1.2 Argentina
- 14.1.3 Rest of South America
- 15. Middle East and Africa GCC Seafoods Market Analysis, Insights and Forecast, 2019-2031
- 15.1. Market Analysis, Insights and Forecast - By Country/Sub-region
- 15.1.1 South Africa
- 15.1.2 United Arab Emirates
- 15.1.3 Rest of Middle East and Africa
- 16. Competitive Analysis
- 16.1. Global Market Share Analysis 2024
- 16.2. Company Profiles
- 16.2.1 Enhance Group Holding Company Limited
- 16.2.1.1. Overview
- 16.2.1.2. Products
- 16.2.1.3. SWOT Analysis
- 16.2.1.4. Recent Developments
- 16.2.1.5. Financials (Based on Availability)
- 16.2.2 Almunajem Foods
- 16.2.2.1. Overview
- 16.2.2.2. Products
- 16.2.2.3. SWOT Analysis
- 16.2.2.4. Recent Developments
- 16.2.2.5. Financials (Based on Availability)
- 16.2.3 National Fishing Company K S C
- 16.2.3.1. Overview
- 16.2.3.2. Products
- 16.2.3.3. SWOT Analysis
- 16.2.3.4. Recent Developments
- 16.2.3.5. Financials (Based on Availability)
- 16.2.4 Oman Fisheries Co SAOG
- 16.2.4.1. Overview
- 16.2.4.2. Products
- 16.2.4.3. SWOT Analysis
- 16.2.4.4. Recent Developments
- 16.2.4.5. Financials (Based on Availability)
- 16.2.5 Thomsun Group
- 16.2.5.1. Overview
- 16.2.5.2. Products
- 16.2.5.3. SWOT Analysis
- 16.2.5.4. Recent Developments
- 16.2.5.5. Financials (Based on Availability)
- 16.2.6 Sea Pride LLC
- 16.2.6.1. Overview
- 16.2.6.2. Products
- 16.2.6.3. SWOT Analysis
- 16.2.6.4. Recent Developments
- 16.2.6.5. Financials (Based on Availability)
- 16.2.7 Albatha Group
- 16.2.7.1. Overview
- 16.2.7.2. Products
- 16.2.7.3. SWOT Analysis
- 16.2.7.4. Recent Developments
- 16.2.7.5. Financials (Based on Availability)
- 16.2.8 The Deep Seafood Company
- 16.2.8.1. Overview
- 16.2.8.2. Products
- 16.2.8.3. SWOT Analysis
- 16.2.8.4. Recent Developments
- 16.2.8.5. Financials (Based on Availability)
- 16.2.9 Blue Island PLC
- 16.2.9.1. Overview
- 16.2.9.2. Products
- 16.2.9.3. SWOT Analysis
- 16.2.9.4. Recent Developments
- 16.2.9.5. Financials (Based on Availability)
- 16.2.10 Yamama Al-Baida Gen Trading & Cont Est
- 16.2.10.1. Overview
- 16.2.10.2. Products
- 16.2.10.3. SWOT Analysis
- 16.2.10.4. Recent Developments
- 16.2.10.5. Financials (Based on Availability)
- 16.2.1 Enhance Group Holding Company Limited
List of Figures
- Figure 1: Global GCC Seafoods Market Revenue Breakdown (Million, %) by Region 2024 & 2032
- Figure 2: Global GCC Seafoods Market Volume Breakdown (Tons, %) by Region 2024 & 2032
- Figure 3: North America GCC Seafoods Market Revenue (Million), by Country 2024 & 2032
- Figure 4: North America GCC Seafoods Market Volume (Tons), by Country 2024 & 2032
- Figure 5: North America GCC Seafoods Market Revenue Share (%), by Country 2024 & 2032
- Figure 6: North America GCC Seafoods Market Volume Share (%), by Country 2024 & 2032
- Figure 7: Europe GCC Seafoods Market Revenue (Million), by Country 2024 & 2032
- Figure 8: Europe GCC Seafoods Market Volume (Tons), by Country 2024 & 2032
- Figure 9: Europe GCC Seafoods Market Revenue Share (%), by Country 2024 & 2032
- Figure 10: Europe GCC Seafoods Market Volume Share (%), by Country 2024 & 2032
- Figure 11: Asia Pacific GCC Seafoods Market Revenue (Million), by Country 2024 & 2032
- Figure 12: Asia Pacific GCC Seafoods Market Volume (Tons), by Country 2024 & 2032
- Figure 13: Asia Pacific GCC Seafoods Market Revenue Share (%), by Country 2024 & 2032
- Figure 14: Asia Pacific GCC Seafoods Market Volume Share (%), by Country 2024 & 2032
- Figure 15: South America GCC Seafoods Market Revenue (Million), by Country 2024 & 2032
- Figure 16: South America GCC Seafoods Market Volume (Tons), by Country 2024 & 2032
- Figure 17: South America GCC Seafoods Market Revenue Share (%), by Country 2024 & 2032
- Figure 18: South America GCC Seafoods Market Volume Share (%), by Country 2024 & 2032
- Figure 19: Middle East and Africa GCC Seafoods Market Revenue (Million), by Country 2024 & 2032
- Figure 20: Middle East and Africa GCC Seafoods Market Volume (Tons), by Country 2024 & 2032
- Figure 21: Middle East and Africa GCC Seafoods Market Revenue Share (%), by Country 2024 & 2032
- Figure 22: Middle East and Africa GCC Seafoods Market Volume Share (%), by Country 2024 & 2032
- Figure 23: North America GCC Seafoods Market Revenue (Million), by Type 2024 & 2032
- Figure 24: North America GCC Seafoods Market Volume (Tons), by Type 2024 & 2032
- Figure 25: North America GCC Seafoods Market Revenue Share (%), by Type 2024 & 2032
- Figure 26: North America GCC Seafoods Market Volume Share (%), by Type 2024 & 2032
- Figure 27: North America GCC Seafoods Market Revenue (Million), by Form 2024 & 2032
- Figure 28: North America GCC Seafoods Market Volume (Tons), by Form 2024 & 2032
- Figure 29: North America GCC Seafoods Market Revenue Share (%), by Form 2024 & 2032
- Figure 30: North America GCC Seafoods Market Volume Share (%), by Form 2024 & 2032
- Figure 31: North America GCC Seafoods Market Revenue (Million), by Distribution Channel 2024 & 2032
- Figure 32: North America GCC Seafoods Market Volume (Tons), by Distribution Channel 2024 & 2032
- Figure 33: North America GCC Seafoods Market Revenue Share (%), by Distribution Channel 2024 & 2032
- Figure 34: North America GCC Seafoods Market Volume Share (%), by Distribution Channel 2024 & 2032
- Figure 35: North America GCC Seafoods Market Revenue (Million), by Country 2024 & 2032
- Figure 36: North America GCC Seafoods Market Volume (Tons), by Country 2024 & 2032
- Figure 37: North America GCC Seafoods Market Revenue Share (%), by Country 2024 & 2032
- Figure 38: North America GCC Seafoods Market Volume Share (%), by Country 2024 & 2032
- Figure 39: South America GCC Seafoods Market Revenue (Million), by Type 2024 & 2032
- Figure 40: South America GCC Seafoods Market Volume (Tons), by Type 2024 & 2032
- Figure 41: South America GCC Seafoods Market Revenue Share (%), by Type 2024 & 2032
- Figure 42: South America GCC Seafoods Market Volume Share (%), by Type 2024 & 2032
- Figure 43: South America GCC Seafoods Market Revenue (Million), by Form 2024 & 2032
- Figure 44: South America GCC Seafoods Market Volume (Tons), by Form 2024 & 2032
- Figure 45: South America GCC Seafoods Market Revenue Share (%), by Form 2024 & 2032
- Figure 46: South America GCC Seafoods Market Volume Share (%), by Form 2024 & 2032
- Figure 47: South America GCC Seafoods Market Revenue (Million), by Distribution Channel 2024 & 2032
- Figure 48: South America GCC Seafoods Market Volume (Tons), by Distribution Channel 2024 & 2032
- Figure 49: South America GCC Seafoods Market Revenue Share (%), by Distribution Channel 2024 & 2032
- Figure 50: South America GCC Seafoods Market Volume Share (%), by Distribution Channel 2024 & 2032
- Figure 51: South America GCC Seafoods Market Revenue (Million), by Country 2024 & 2032
- Figure 52: South America GCC Seafoods Market Volume (Tons), by Country 2024 & 2032
- Figure 53: South America GCC Seafoods Market Revenue Share (%), by Country 2024 & 2032
- Figure 54: South America GCC Seafoods Market Volume Share (%), by Country 2024 & 2032
- Figure 55: Europe GCC Seafoods Market Revenue (Million), by Type 2024 & 2032
- Figure 56: Europe GCC Seafoods Market Volume (Tons), by Type 2024 & 2032
- Figure 57: Europe GCC Seafoods Market Revenue Share (%), by Type 2024 & 2032
- Figure 58: Europe GCC Seafoods Market Volume Share (%), by Type 2024 & 2032
- Figure 59: Europe GCC Seafoods Market Revenue (Million), by Form 2024 & 2032
- Figure 60: Europe GCC Seafoods Market Volume (Tons), by Form 2024 & 2032
- Figure 61: Europe GCC Seafoods Market Revenue Share (%), by Form 2024 & 2032
- Figure 62: Europe GCC Seafoods Market Volume Share (%), by Form 2024 & 2032
- Figure 63: Europe GCC Seafoods Market Revenue (Million), by Distribution Channel 2024 & 2032
- Figure 64: Europe GCC Seafoods Market Volume (Tons), by Distribution Channel 2024 & 2032
- Figure 65: Europe GCC Seafoods Market Revenue Share (%), by Distribution Channel 2024 & 2032
- Figure 66: Europe GCC Seafoods Market Volume Share (%), by Distribution Channel 2024 & 2032
- Figure 67: Europe GCC Seafoods Market Revenue (Million), by Country 2024 & 2032
- Figure 68: Europe GCC Seafoods Market Volume (Tons), by Country 2024 & 2032
- Figure 69: Europe GCC Seafoods Market Revenue Share (%), by Country 2024 & 2032
- Figure 70: Europe GCC Seafoods Market Volume Share (%), by Country 2024 & 2032
- Figure 71: Middle East & Africa GCC Seafoods Market Revenue (Million), by Type 2024 & 2032
- Figure 72: Middle East & Africa GCC Seafoods Market Volume (Tons), by Type 2024 & 2032
- Figure 73: Middle East & Africa GCC Seafoods Market Revenue Share (%), by Type 2024 & 2032
- Figure 74: Middle East & Africa GCC Seafoods Market Volume Share (%), by Type 2024 & 2032
- Figure 75: Middle East & Africa GCC Seafoods Market Revenue (Million), by Form 2024 & 2032
- Figure 76: Middle East & Africa GCC Seafoods Market Volume (Tons), by Form 2024 & 2032
- Figure 77: Middle East & Africa GCC Seafoods Market Revenue Share (%), by Form 2024 & 2032
- Figure 78: Middle East & Africa GCC Seafoods Market Volume Share (%), by Form 2024 & 2032
- Figure 79: Middle East & Africa GCC Seafoods Market Revenue (Million), by Distribution Channel 2024 & 2032
- Figure 80: Middle East & Africa GCC Seafoods Market Volume (Tons), by Distribution Channel 2024 & 2032
- Figure 81: Middle East & Africa GCC Seafoods Market Revenue Share (%), by Distribution Channel 2024 & 2032
- Figure 82: Middle East & Africa GCC Seafoods Market Volume Share (%), by Distribution Channel 2024 & 2032
- Figure 83: Middle East & Africa GCC Seafoods Market Revenue (Million), by Country 2024 & 2032
- Figure 84: Middle East & Africa GCC Seafoods Market Volume (Tons), by Country 2024 & 2032
- Figure 85: Middle East & Africa GCC Seafoods Market Revenue Share (%), by Country 2024 & 2032
- Figure 86: Middle East & Africa GCC Seafoods Market Volume Share (%), by Country 2024 & 2032
- Figure 87: Asia Pacific GCC Seafoods Market Revenue (Million), by Type 2024 & 2032
- Figure 88: Asia Pacific GCC Seafoods Market Volume (Tons), by Type 2024 & 2032
- Figure 89: Asia Pacific GCC Seafoods Market Revenue Share (%), by Type 2024 & 2032
- Figure 90: Asia Pacific GCC Seafoods Market Volume Share (%), by Type 2024 & 2032
- Figure 91: Asia Pacific GCC Seafoods Market Revenue (Million), by Form 2024 & 2032
- Figure 92: Asia Pacific GCC Seafoods Market Volume (Tons), by Form 2024 & 2032
- Figure 93: Asia Pacific GCC Seafoods Market Revenue Share (%), by Form 2024 & 2032
- Figure 94: Asia Pacific GCC Seafoods Market Volume Share (%), by Form 2024 & 2032
- Figure 95: Asia Pacific GCC Seafoods Market Revenue (Million), by Distribution Channel 2024 & 2032
- Figure 96: Asia Pacific GCC Seafoods Market Volume (Tons), by Distribution Channel 2024 & 2032
- Figure 97: Asia Pacific GCC Seafoods Market Revenue Share (%), by Distribution Channel 2024 & 2032
- Figure 98: Asia Pacific GCC Seafoods Market Volume Share (%), by Distribution Channel 2024 & 2032
- Figure 99: Asia Pacific GCC Seafoods Market Revenue (Million), by Country 2024 & 2032
- Figure 100: Asia Pacific GCC Seafoods Market Volume (Tons), by Country 2024 & 2032
- Figure 101: Asia Pacific GCC Seafoods Market Revenue Share (%), by Country 2024 & 2032
- Figure 102: Asia Pacific GCC Seafoods Market Volume Share (%), by Country 2024 & 2032
List of Tables
- Table 1: Global GCC Seafoods Market Revenue Million Forecast, by Region 2019 & 2032
- Table 2: Global GCC Seafoods Market Volume Tons Forecast, by Region 2019 & 2032
- Table 3: Global GCC Seafoods Market Revenue Million Forecast, by Type 2019 & 2032
- Table 4: Global GCC Seafoods Market Volume Tons Forecast, by Type 2019 & 2032
- Table 5: Global GCC Seafoods Market Revenue Million Forecast, by Form 2019 & 2032
- Table 6: Global GCC Seafoods Market Volume Tons Forecast, by Form 2019 & 2032
- Table 7: Global GCC Seafoods Market Revenue Million Forecast, by Distribution Channel 2019 & 2032
- Table 8: Global GCC Seafoods Market Volume Tons Forecast, by Distribution Channel 2019 & 2032
- Table 9: Global GCC Seafoods Market Revenue Million Forecast, by Region 2019 & 2032
- Table 10: Global GCC Seafoods Market Volume Tons Forecast, by Region 2019 & 2032
- Table 11: Global GCC Seafoods Market Revenue Million Forecast, by Country 2019 & 2032
- Table 12: Global GCC Seafoods Market Volume Tons Forecast, by Country 2019 & 2032
- Table 13: United States GCC Seafoods Market Revenue (Million) Forecast, by Application 2019 & 2032
- Table 14: United States GCC Seafoods Market Volume (Tons) Forecast, by Application 2019 & 2032
- Table 15: Canada GCC Seafoods Market Revenue (Million) Forecast, by Application 2019 & 2032
- Table 16: Canada GCC Seafoods Market Volume (Tons) Forecast, by Application 2019 & 2032
- Table 17: Mexico GCC Seafoods Market Revenue (Million) Forecast, by Application 2019 & 2032
- Table 18: Mexico GCC Seafoods Market Volume (Tons) Forecast, by Application 2019 & 2032
- Table 19: Rest of North America GCC Seafoods Market Revenue (Million) Forecast, by Application 2019 & 2032
- Table 20: Rest of North America GCC Seafoods Market Volume (Tons) Forecast, by Application 2019 & 2032
- Table 21: Global GCC Seafoods Market Revenue Million Forecast, by Country 2019 & 2032
- Table 22: Global GCC Seafoods Market Volume Tons Forecast, by Country 2019 & 2032
- Table 23: United Kingdom GCC Seafoods Market Revenue (Million) Forecast, by Application 2019 & 2032
- Table 24: United Kingdom GCC Seafoods Market Volume (Tons) Forecast, by Application 2019 & 2032
- Table 25: Germany GCC Seafoods Market Revenue (Million) Forecast, by Application 2019 & 2032
- Table 26: Germany GCC Seafoods Market Volume (Tons) Forecast, by Application 2019 & 2032
- Table 27: France GCC Seafoods Market Revenue (Million) Forecast, by Application 2019 & 2032
- Table 28: France GCC Seafoods Market Volume (Tons) Forecast, by Application 2019 & 2032
- Table 29: Russia GCC Seafoods Market Revenue (Million) Forecast, by Application 2019 & 2032
- Table 30: Russia GCC Seafoods Market Volume (Tons) Forecast, by Application 2019 & 2032
- Table 31: Italy GCC Seafoods Market Revenue (Million) Forecast, by Application 2019 & 2032
- Table 32: Italy GCC Seafoods Market Volume (Tons) Forecast, by Application 2019 & 2032
- Table 33: Spain GCC Seafoods Market Revenue (Million) Forecast, by Application 2019 & 2032
- Table 34: Spain GCC Seafoods Market Volume (Tons) Forecast, by Application 2019 & 2032
- Table 35: Rest of Europe GCC Seafoods Market Revenue (Million) Forecast, by Application 2019 & 2032
- Table 36: Rest of Europe GCC Seafoods Market Volume (Tons) Forecast, by Application 2019 & 2032
- Table 37: Global GCC Seafoods Market Revenue Million Forecast, by Country 2019 & 2032
- Table 38: Global GCC Seafoods Market Volume Tons Forecast, by Country 2019 & 2032
- Table 39: India GCC Seafoods Market Revenue (Million) Forecast, by Application 2019 & 2032
- Table 40: India GCC Seafoods Market Volume (Tons) Forecast, by Application 2019 & 2032
- Table 41: China GCC Seafoods Market Revenue (Million) Forecast, by Application 2019 & 2032
- Table 42: China GCC Seafoods Market Volume (Tons) Forecast, by Application 2019 & 2032
- Table 43: Japan GCC Seafoods Market Revenue (Million) Forecast, by Application 2019 & 2032
- Table 44: Japan GCC Seafoods Market Volume (Tons) Forecast, by Application 2019 & 2032
- Table 45: Australia GCC Seafoods Market Revenue (Million) Forecast, by Application 2019 & 2032
- Table 46: Australia GCC Seafoods Market Volume (Tons) Forecast, by Application 2019 & 2032
- Table 47: Rest of Asia Pacific GCC Seafoods Market Revenue (Million) Forecast, by Application 2019 & 2032
- Table 48: Rest of Asia Pacific GCC Seafoods Market Volume (Tons) Forecast, by Application 2019 & 2032
- Table 49: Global GCC Seafoods Market Revenue Million Forecast, by Country 2019 & 2032
- Table 50: Global GCC Seafoods Market Volume Tons Forecast, by Country 2019 & 2032
- Table 51: Brazil GCC Seafoods Market Revenue (Million) Forecast, by Application 2019 & 2032
- Table 52: Brazil GCC Seafoods Market Volume (Tons) Forecast, by Application 2019 & 2032
- Table 53: Argentina GCC Seafoods Market Revenue (Million) Forecast, by Application 2019 & 2032
- Table 54: Argentina GCC Seafoods Market Volume (Tons) Forecast, by Application 2019 & 2032
- Table 55: Rest of South America GCC Seafoods Market Revenue (Million) Forecast, by Application 2019 & 2032
- Table 56: Rest of South America GCC Seafoods Market Volume (Tons) Forecast, by Application 2019 & 2032
- Table 57: Global GCC Seafoods Market Revenue Million Forecast, by Country 2019 & 2032
- Table 58: Global GCC Seafoods Market Volume Tons Forecast, by Country 2019 & 2032
- Table 59: South Africa GCC Seafoods Market Revenue (Million) Forecast, by Application 2019 & 2032
- Table 60: South Africa GCC Seafoods Market Volume (Tons) Forecast, by Application 2019 & 2032
- Table 61: United Arab Emirates GCC Seafoods Market Revenue (Million) Forecast, by Application 2019 & 2032
- Table 62: United Arab Emirates GCC Seafoods Market Volume (Tons) Forecast, by Application 2019 & 2032
- Table 63: Rest of Middle East and Africa GCC Seafoods Market Revenue (Million) Forecast, by Application 2019 & 2032
- Table 64: Rest of Middle East and Africa GCC Seafoods Market Volume (Tons) Forecast, by Application 2019 & 2032
- Table 65: Global GCC Seafoods Market Revenue Million Forecast, by Type 2019 & 2032
- Table 66: Global GCC Seafoods Market Volume Tons Forecast, by Type 2019 & 2032
- Table 67: Global GCC Seafoods Market Revenue Million Forecast, by Form 2019 & 2032
- Table 68: Global GCC Seafoods Market Volume Tons Forecast, by Form 2019 & 2032
- Table 69: Global GCC Seafoods Market Revenue Million Forecast, by Distribution Channel 2019 & 2032
- Table 70: Global GCC Seafoods Market Volume Tons Forecast, by Distribution Channel 2019 & 2032
- Table 71: Global GCC Seafoods Market Revenue Million Forecast, by Country 2019 & 2032
- Table 72: Global GCC Seafoods Market Volume Tons Forecast, by Country 2019 & 2032
- Table 73: United States GCC Seafoods Market Revenue (Million) Forecast, by Application 2019 & 2032
- Table 74: United States GCC Seafoods Market Volume (Tons) Forecast, by Application 2019 & 2032
- Table 75: Canada GCC Seafoods Market Revenue (Million) Forecast, by Application 2019 & 2032
- Table 76: Canada GCC Seafoods Market Volume (Tons) Forecast, by Application 2019 & 2032
- Table 77: Mexico GCC Seafoods Market Revenue (Million) Forecast, by Application 2019 & 2032
- Table 78: Mexico GCC Seafoods Market Volume (Tons) Forecast, by Application 2019 & 2032
- Table 79: Global GCC Seafoods Market Revenue Million Forecast, by Type 2019 & 2032
- Table 80: Global GCC Seafoods Market Volume Tons Forecast, by Type 2019 & 2032
- Table 81: Global GCC Seafoods Market Revenue Million Forecast, by Form 2019 & 2032
- Table 82: Global GCC Seafoods Market Volume Tons Forecast, by Form 2019 & 2032
- Table 83: Global GCC Seafoods Market Revenue Million Forecast, by Distribution Channel 2019 & 2032
- Table 84: Global GCC Seafoods Market Volume Tons Forecast, by Distribution Channel 2019 & 2032
- Table 85: Global GCC Seafoods Market Revenue Million Forecast, by Country 2019 & 2032
- Table 86: Global GCC Seafoods Market Volume Tons Forecast, by Country 2019 & 2032
- Table 87: Brazil GCC Seafoods Market Revenue (Million) Forecast, by Application 2019 & 2032
- Table 88: Brazil GCC Seafoods Market Volume (Tons) Forecast, by Application 2019 & 2032
- Table 89: Argentina GCC Seafoods Market Revenue (Million) Forecast, by Application 2019 & 2032
- Table 90: Argentina GCC Seafoods Market Volume (Tons) Forecast, by Application 2019 & 2032
- Table 91: Rest of South America GCC Seafoods Market Revenue (Million) Forecast, by Application 2019 & 2032
- Table 92: Rest of South America GCC Seafoods Market Volume (Tons) Forecast, by Application 2019 & 2032
- Table 93: Global GCC Seafoods Market Revenue Million Forecast, by Type 2019 & 2032
- Table 94: Global GCC Seafoods Market Volume Tons Forecast, by Type 2019 & 2032
- Table 95: Global GCC Seafoods Market Revenue Million Forecast, by Form 2019 & 2032
- Table 96: Global GCC Seafoods Market Volume Tons Forecast, by Form 2019 & 2032
- Table 97: Global GCC Seafoods Market Revenue Million Forecast, by Distribution Channel 2019 & 2032
- Table 98: Global GCC Seafoods Market Volume Tons Forecast, by Distribution Channel 2019 & 2032
- Table 99: Global GCC Seafoods Market Revenue Million Forecast, by Country 2019 & 2032
- Table 100: Global GCC Seafoods Market Volume Tons Forecast, by Country 2019 & 2032
- Table 101: United Kingdom GCC Seafoods Market Revenue (Million) Forecast, by Application 2019 & 2032
- Table 102: United Kingdom GCC Seafoods Market Volume (Tons) Forecast, by Application 2019 & 2032
- Table 103: Germany GCC Seafoods Market Revenue (Million) Forecast, by Application 2019 & 2032
- Table 104: Germany GCC Seafoods Market Volume (Tons) Forecast, by Application 2019 & 2032
- Table 105: France GCC Seafoods Market Revenue (Million) Forecast, by Application 2019 & 2032
- Table 106: France GCC Seafoods Market Volume (Tons) Forecast, by Application 2019 & 2032
- Table 107: Italy GCC Seafoods Market Revenue (Million) Forecast, by Application 2019 & 2032
- Table 108: Italy GCC Seafoods Market Volume (Tons) Forecast, by Application 2019 & 2032
- Table 109: Spain GCC Seafoods Market Revenue (Million) Forecast, by Application 2019 & 2032
- Table 110: Spain GCC Seafoods Market Volume (Tons) Forecast, by Application 2019 & 2032
- Table 111: Russia GCC Seafoods Market Revenue (Million) Forecast, by Application 2019 & 2032
- Table 112: Russia GCC Seafoods Market Volume (Tons) Forecast, by Application 2019 & 2032
- Table 113: Benelux GCC Seafoods Market Revenue (Million) Forecast, by Application 2019 & 2032
- Table 114: Benelux GCC Seafoods Market Volume (Tons) Forecast, by Application 2019 & 2032
- Table 115: Nordics GCC Seafoods Market Revenue (Million) Forecast, by Application 2019 & 2032
- Table 116: Nordics GCC Seafoods Market Volume (Tons) Forecast, by Application 2019 & 2032
- Table 117: Rest of Europe GCC Seafoods Market Revenue (Million) Forecast, by Application 2019 & 2032
- Table 118: Rest of Europe GCC Seafoods Market Volume (Tons) Forecast, by Application 2019 & 2032
- Table 119: Global GCC Seafoods Market Revenue Million Forecast, by Type 2019 & 2032
- Table 120: Global GCC Seafoods Market Volume Tons Forecast, by Type 2019 & 2032
- Table 121: Global GCC Seafoods Market Revenue Million Forecast, by Form 2019 & 2032
- Table 122: Global GCC Seafoods Market Volume Tons Forecast, by Form 2019 & 2032
- Table 123: Global GCC Seafoods Market Revenue Million Forecast, by Distribution Channel 2019 & 2032
- Table 124: Global GCC Seafoods Market Volume Tons Forecast, by Distribution Channel 2019 & 2032
- Table 125: Global GCC Seafoods Market Revenue Million Forecast, by Country 2019 & 2032
- Table 126: Global GCC Seafoods Market Volume Tons Forecast, by Country 2019 & 2032
- Table 127: Turkey GCC Seafoods Market Revenue (Million) Forecast, by Application 2019 & 2032
- Table 128: Turkey GCC Seafoods Market Volume (Tons) Forecast, by Application 2019 & 2032
- Table 129: Israel GCC Seafoods Market Revenue (Million) Forecast, by Application 2019 & 2032
- Table 130: Israel GCC Seafoods Market Volume (Tons) Forecast, by Application 2019 & 2032
- Table 131: GCC GCC Seafoods Market Revenue (Million) Forecast, by Application 2019 & 2032
- Table 132: GCC GCC Seafoods Market Volume (Tons) Forecast, by Application 2019 & 2032
- Table 133: North Africa GCC Seafoods Market Revenue (Million) Forecast, by Application 2019 & 2032
- Table 134: North Africa GCC Seafoods Market Volume (Tons) Forecast, by Application 2019 & 2032
- Table 135: South Africa GCC Seafoods Market Revenue (Million) Forecast, by Application 2019 & 2032
- Table 136: South Africa GCC Seafoods Market Volume (Tons) Forecast, by Application 2019 & 2032
- Table 137: Rest of Middle East & Africa GCC Seafoods Market Revenue (Million) Forecast, by Application 2019 & 2032
- Table 138: Rest of Middle East & Africa GCC Seafoods Market Volume (Tons) Forecast, by Application 2019 & 2032
- Table 139: Global GCC Seafoods Market Revenue Million Forecast, by Type 2019 & 2032
- Table 140: Global GCC Seafoods Market Volume Tons Forecast, by Type 2019 & 2032
- Table 141: Global GCC Seafoods Market Revenue Million Forecast, by Form 2019 & 2032
- Table 142: Global GCC Seafoods Market Volume Tons Forecast, by Form 2019 & 2032
- Table 143: Global GCC Seafoods Market Revenue Million Forecast, by Distribution Channel 2019 & 2032
- Table 144: Global GCC Seafoods Market Volume Tons Forecast, by Distribution Channel 2019 & 2032
- Table 145: Global GCC Seafoods Market Revenue Million Forecast, by Country 2019 & 2032
- Table 146: Global GCC Seafoods Market Volume Tons Forecast, by Country 2019 & 2032
- Table 147: China GCC Seafoods Market Revenue (Million) Forecast, by Application 2019 & 2032
- Table 148: China GCC Seafoods Market Volume (Tons) Forecast, by Application 2019 & 2032
- Table 149: India GCC Seafoods Market Revenue (Million) Forecast, by Application 2019 & 2032
- Table 150: India GCC Seafoods Market Volume (Tons) Forecast, by Application 2019 & 2032
- Table 151: Japan GCC Seafoods Market Revenue (Million) Forecast, by Application 2019 & 2032
- Table 152: Japan GCC Seafoods Market Volume (Tons) Forecast, by Application 2019 & 2032
- Table 153: South Korea GCC Seafoods Market Revenue (Million) Forecast, by Application 2019 & 2032
- Table 154: South Korea GCC Seafoods Market Volume (Tons) Forecast, by Application 2019 & 2032
- Table 155: ASEAN GCC Seafoods Market Revenue (Million) Forecast, by Application 2019 & 2032
- Table 156: ASEAN GCC Seafoods Market Volume (Tons) Forecast, by Application 2019 & 2032
- Table 157: Oceania GCC Seafoods Market Revenue (Million) Forecast, by Application 2019 & 2032
- Table 158: Oceania GCC Seafoods Market Volume (Tons) Forecast, by Application 2019 & 2032
- Table 159: Rest of Asia Pacific GCC Seafoods Market Revenue (Million) Forecast, by Application 2019 & 2032
- Table 160: Rest of Asia Pacific GCC Seafoods Market Volume (Tons) Forecast, by Application 2019 & 2032
Frequently Asked Questions
1. What is the projected Compound Annual Growth Rate (CAGR) of the GCC Seafoods Market?
The projected CAGR is approximately 4.20%.
2. Which companies are prominent players in the GCC Seafoods Market?
Key companies in the market include Enhance Group Holding Company Limited, Almunajem Foods, National Fishing Company K S C, Oman Fisheries Co SAOG, Thomsun Group, Sea Pride LLC, Albatha Group, The Deep Seafood Company, Blue Island PLC, Yamama Al-Baida Gen Trading & Cont Est.
3. What are the main segments of the GCC Seafoods Market?
The market segments include Type, Form, Distribution Channel.
4. Can you provide details about the market size?
The market size is estimated to be USD 3.54 Million as of 2022.
5. What are some drivers contributing to market growth?
Escalating Demand for Processed Poultry Products; Favorable Government Initiatives to Boost Production.
6. What are the notable trends driving market growth?
OTHER KEY INDUSTRY TRENDS COVERED IN THE REPORT.
7. Are there any restraints impacting market growth?
Rising Vegan Trend among Young Consumers; Deeper Penetration of Red Meat Across Saudi Arabia.
8. Can you provide examples of recent developments in the market?
May 2022: Gulf Japan Food Fund has invested in Oman Fisheries Co SAOG. This help to take Oman Fisheries' capability to expand its footprint across the global markets.February 2022: Asmak announced a strategic distribution agreement with Fish Farm, a UAE-based aquaculture company. Under this agreement, Asmak distributes fish farm products to capture a wider audience locally and regionally through its processing facility and strong distribution channels, including wholesale, foodservice, and retail.
9. What pricing options are available for accessing the report?
Pricing options include single-user, multi-user, and enterprise licenses priced at USD 3800, USD 4500, and USD 5800 respectively.
10. Is the market size provided in terms of value or volume?
The market size is provided in terms of value, measured in Million and volume, measured in Tons.
11. Are there any specific market keywords associated with the report?
Yes, the market keyword associated with the report is "GCC Seafoods Market," which aids in identifying and referencing the specific market segment covered.
12. How do I determine which pricing option suits my needs best?
The pricing options vary based on user requirements and access needs. Individual users may opt for single-user licenses, while businesses requiring broader access may choose multi-user or enterprise licenses for cost-effective access to the report.
13. Are there any additional resources or data provided in the GCC Seafoods Market report?
While the report offers comprehensive insights, it's advisable to review the specific contents or supplementary materials provided to ascertain if additional resources or data are available.
14. How can I stay updated on further developments or reports in the GCC Seafoods Market?
To stay informed about further developments, trends, and reports in the GCC Seafoods Market, consider subscribing to industry newsletters, following relevant companies and organizations, or regularly checking reputable industry news sources and publications.
Methodology
Step 1 - Identification of Relevant Samples Size from Population Database


Step 2 - Approaches for Defining Global Market Size (Value, Volume* & Price*)

Note*: In applicable scenarios
Step 3 - Data Sources
Primary Research
- Web Analytics
- Survey Reports
- Research Institute
- Latest Research Reports
- Opinion Leaders
Secondary Research
- Annual Reports
- White Paper
- Latest Press Release
- Industry Association
- Paid Database
- Investor Presentations

Step 4 - Data Triangulation
Involves using different sources of information in order to increase the validity of a study
These sources are likely to be stakeholders in a program - participants, other researchers, program staff, other community members, and so on.
Then we put all data in single framework & apply various statistical tools to find out the dynamic on the market.
During the analysis stage, feedback from the stakeholder groups would be compared to determine areas of agreement as well as areas of divergence


