
Key Insights
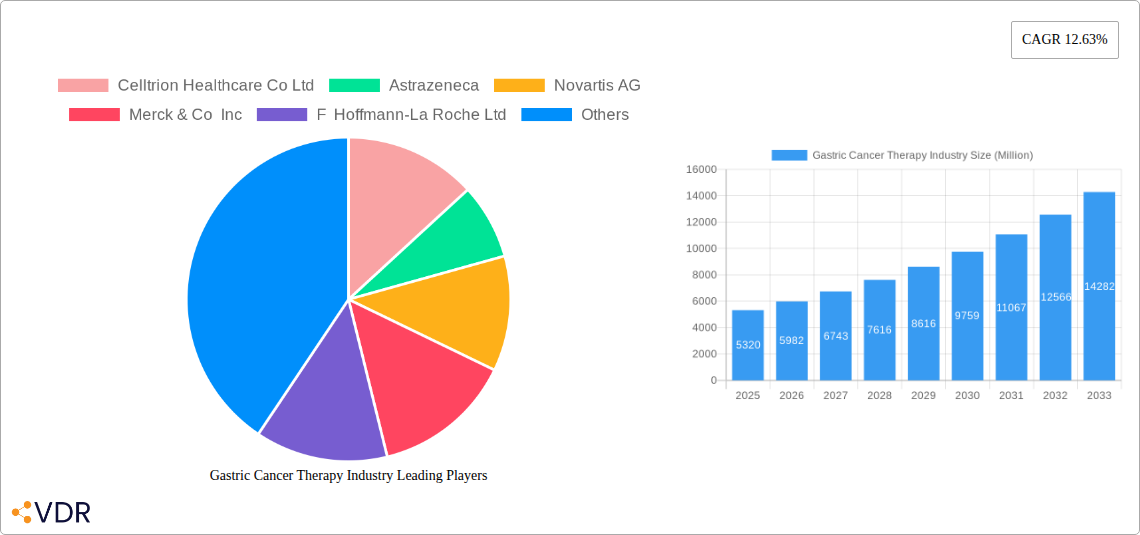
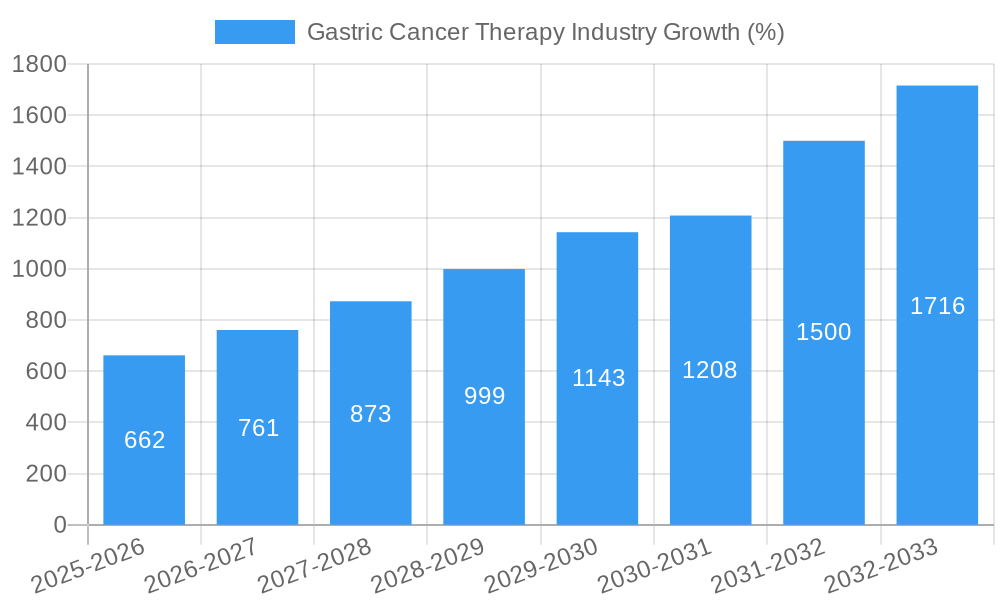
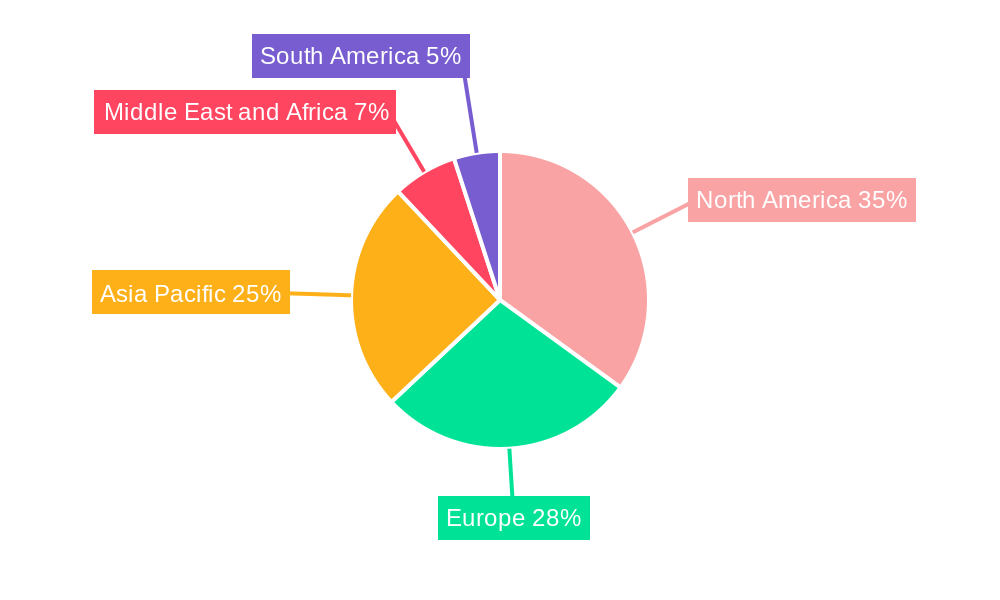
The global gastric cancer therapy market, valued at $5.32 billion in 2025, is projected to experience robust growth, driven by a rising incidence of gastric cancer globally, an aging population increasing susceptibility, and advancements in treatment modalities. The market's Compound Annual Growth Rate (CAGR) of 12.63% from 2025 to 2033 indicates significant expansion. Key drivers include the increasing adoption of targeted therapies, immunotherapies, and minimally invasive surgical techniques offering improved patient outcomes and quality of life. The rising prevalence of Helicobacter pylori infections, a significant risk factor for gastric cancer, further fuels market growth. However, high treatment costs, particularly for advanced therapies like immunotherapy, and regional disparities in healthcare access pose significant restraints. The market is segmented by therapy type (chemotherapy, targeted therapy, immunotherapy, radiation therapy, surgery) and end-user (ambulatory surgery centers, hospitals and specialty clinics, other end-users). Major players like Celltrion Healthcare, AstraZeneca, Novartis, Merck, Roche, Amgen, Eli Lilly, Otsuka, GSK, Imugene, Bristol-Myers Squibb, Sanofi, and Pfizer are shaping the competitive landscape through research and development, strategic partnerships, and market expansion initiatives. Regional variations exist, with North America and Europe currently holding significant market share, while the Asia-Pacific region is anticipated to witness substantial growth driven by rising awareness and improved healthcare infrastructure.
The continued development of innovative therapies, including personalized medicine approaches and combination therapies, will further propel market growth. Furthermore, increasing government funding for cancer research and initiatives aimed at improving early detection and prevention strategies will contribute to the overall market expansion. However, challenges remain in addressing treatment resistance and managing side effects associated with certain therapies. Future growth will likely be influenced by the success of ongoing clinical trials, the regulatory approval of new drugs, and the affordability and accessibility of advanced therapies globally. The market's trajectory suggests a promising outlook, although continued focus on addressing existing challenges will be crucial for sustained and equitable growth.
Gastric Cancer Therapy Industry Market Report: 2019-2033
This comprehensive report provides a detailed analysis of the Gastric Cancer Therapy market, encompassing market dynamics, growth trends, regional segmentation, product landscape, and key players. The report covers the period from 2019 to 2033, with a focus on the forecast period 2025-2033 and a base year of 2025. It delves into both parent and child market segments, offering valuable insights for industry professionals, investors, and stakeholders. The market is segmented by therapy type (Chemotherapy, Targeted Therapy, Immunotherapy, Radiation Therapy, Surgery) and end-user (Ambulatory Surgery Centers, Hospitals and Specialty Clinics, Other End-users). The total market size is projected to reach xx Million by 2033.
Gastric Cancer Therapy Industry Market Dynamics & Structure
The global gastric cancer therapy market is characterized by a moderately concentrated structure, with a few dominant players holding significant market share. The market size reached approximately 8000 Million in 2024. Technological innovation, particularly in immunotherapy and targeted therapies, is a key growth driver. However, stringent regulatory frameworks and the high cost of developing new therapies present significant challenges. The emergence of biosimilars is also impacting the competitive landscape. Mergers and acquisitions (M&A) are frequent, reflecting the industry's dynamic nature and companies' pursuit of growth and expansion.
- Market Concentration: Top 5 players hold approximately 60% market share (2024).
- Technological Innovation: Focus on personalized medicine, targeted therapies, and immunotherapy driving innovation.
- Regulatory Framework: Stringent approval processes impact time-to-market and increase development costs.
- Competitive Substitutes: Biosimilars and alternative treatment approaches create competitive pressure.
- End-User Demographics: Aging population and increasing prevalence of gastric cancer fuels market growth.
- M&A Trends: High volume of M&A activity, driven by market consolidation and access to new technologies. xx deals recorded in the last 5 years.
Gastric Cancer Therapy Industry Growth Trends & Insights
The global gastric cancer therapy market exhibits robust growth, driven by several factors. The increasing prevalence of gastric cancer, coupled with advancements in treatment modalities, is fueling market expansion. The market experienced a CAGR of xx% during the historical period (2019-2024) and is projected to maintain a CAGR of xx% during the forecast period (2025-2033), reaching a projected value of xx Million by 2033. Technological advancements, such as the development of novel targeted therapies and immunotherapies, have significantly improved treatment outcomes, boosting market adoption rates. Changes in consumer behavior, including increased awareness of treatment options and demand for personalized medicine, further contribute to market growth. Furthermore, the expansion of healthcare infrastructure, particularly in emerging economies, presents significant growth opportunities.
Dominant Regions, Countries, or Segments in Gastric Cancer Therapy Industry
North America currently dominates the gastric cancer therapy market, driven by factors such as advanced healthcare infrastructure, high healthcare expenditure, and a significant prevalence of gastric cancer. However, Asia-Pacific is expected to witness substantial growth due to increasing awareness, rising disposable incomes, and the expanding healthcare sector in the region.
By Therapy Type:
- Immunotherapy: Fastest-growing segment, driven by its high efficacy and less toxicity.
- Targeted Therapy: Significant market share, driven by its ability to target specific cancer cells.
- Chemotherapy: Largest segment, but facing decline due to emergence of more effective therapies.
By End-User:
- Hospitals and Specialty Clinics: Largest segment due to advanced treatment capabilities.
- Ambulatory Surgery Centers: Growing segment driven by cost-effectiveness and convenience.
Gastric Cancer Therapy Industry Product Landscape
The gastric cancer therapy product landscape is rapidly evolving, with a continuous influx of novel therapies. Key innovations include improved targeted therapies with enhanced specificity and reduced side effects, novel immunotherapies designed to enhance the immune response against cancer cells, and advancements in minimally invasive surgical techniques. These innovations contribute to improved treatment efficacy, reduced treatment time, and enhanced patient outcomes, thereby shaping the competitive landscape and driving market expansion.
Key Drivers, Barriers & Challenges in Gastric Cancer Therapy Industry
Key Drivers:
- Technological advancements in targeted therapies and immunotherapies.
- Increasing prevalence of gastric cancer globally.
- Rising healthcare expenditure and insurance coverage.
Key Challenges:
- High cost of developing and manufacturing novel therapies.
- Stringent regulatory approval processes.
- Emergence of biosimilars impacting pricing and profitability. This results in an estimated xx% reduction in pricing of some key therapies annually.
Emerging Opportunities in Gastric Cancer Therapy Industry
- Untapped markets in developing countries.
- Growing demand for personalized medicine and companion diagnostics.
- Development of novel drug delivery systems for enhanced efficacy and reduced side effects.
Growth Accelerators in the Gastric Cancer Therapy Industry
Technological breakthroughs in immunotherapy and targeted therapy, combined with strategic partnerships between pharmaceutical companies and research institutions, are accelerating market growth. Furthermore, expansion into emerging markets through collaborations and distribution agreements is creating new revenue streams and driving market penetration.
Key Players Shaping the Gastric Cancer Therapy Industry Market
- Celltrion Healthcare Co Ltd
- Astrazeneca
- Novartis AG
- Merck & Co Inc
- F Hoffmann-La Roche Ltd
- Amgen
- Eli Lilly and Company
- Otsuka Holdings Co Ltd
- GSK plc
- Imugene Limited
- Bristol-Myers Squibb Company
- Sanofi S A
- Pfizer Inc
Notable Milestones in Gastric Cancer Therapy Industry Sector
- March 2023: Akeso, Inc. completes patient enrollment for its pivotal Phase III clinical trial of cadonilimab (PD-1/CTLA-4 bi-specific antibody, AK104), a groundbreaking dual-immune checkpoint bi-specific antibody drug.
- January 2023: Eisai Co., Ltd. presents research on various gastrointestinal cancers at the 2023 ASCO Gastrointestinal Cancers Symposium (#GI23).
In-Depth Gastric Cancer Therapy Industry Market Outlook
The gastric cancer therapy market is poised for continued expansion, driven by the factors outlined above. Strategic investments in research and development, innovative product launches, and expansion into untapped markets will further shape the market landscape. The focus on personalized medicine and the development of more effective and less toxic therapies will create substantial growth opportunities for key players in the years to come.
Gastric Cancer Therapy Industry Segmentation
-
1. Therapy Type
- 1.1. Chemotherapy
- 1.2. Targeted Therapy
- 1.3. Immunotherapy
- 1.4. Radiation Therapy
- 1.5. Surgery
-
2. End-User
- 2.1. Ambulatory Surgery Centers
- 2.2. Hospitals and Specialty Clinics
- 2.3. Other End-users
Gastric Cancer Therapy Industry Segmentation By Geography
-
1. North America
- 1.1. United States
- 1.2. Canada
- 1.3. Mexico
-
2. Europe
- 2.1. Germany
- 2.2. United Kingdom
- 2.3. France
- 2.4. Italy
- 2.5. Spain
- 2.6. Rest of Europe
-
3. Asia Pacific
- 3.1. China
- 3.2. Japan
- 3.3. India
- 3.4. Australia
- 3.5. South Korea
- 3.6. Rest of Asia Pacific
-
4. Middle East and Africa
- 4.1. GCC
- 4.2. South Africa
- 4.3. Rest of Middle East and Africa
-
5. South America
- 5.1. Brazil
- 5.2. Argentina
- 5.3. Rest of South America
Gastric Cancer Therapy Industry REPORT HIGHLIGHTS
| Aspects | Details |
|---|---|
| Study Period | 2019-2033 |
| Base Year | 2024 |
| Estimated Year | 2025 |
| Forecast Period | 2025-2033 |
| Historical Period | 2019-2024 |
| Growth Rate | CAGR of 12.63% from 2019-2033 |
| Segmentation |
|
Table of Contents
- 1. Introduction
- 1.1. Research Scope
- 1.2. Market Segmentation
- 1.3. Research Methodology
- 1.4. Definitions and Assumptions
- 2. Executive Summary
- 2.1. Introduction
- 3. Market Dynamics
- 3.1. Introduction
- 3.2. Market Drivers
- 3.2.1. Growing Burden of Gastric Cancer; Increase in Research and Development for Novel Therapies Coupled with Government Initiatives
- 3.3. Market Restrains
- 3.3.1. High Cost of Cancer Therapy and Side Effects of Cancer Drugs
- 3.4. Market Trends
- 3.4.1. Targeted Segment is Expected to Hold a Significant Share of the Market Over the Forecast Period
- 4. Market Factor Analysis
- 4.1. Porters Five Forces
- 4.2. Supply/Value Chain
- 4.3. PESTEL analysis
- 4.4. Market Entropy
- 4.5. Patent/Trademark Analysis
- 5. Global Gastric Cancer Therapy Industry Analysis, Insights and Forecast, 2019-2031
- 5.1. Market Analysis, Insights and Forecast - by Therapy Type
- 5.1.1. Chemotherapy
- 5.1.2. Targeted Therapy
- 5.1.3. Immunotherapy
- 5.1.4. Radiation Therapy
- 5.1.5. Surgery
- 5.2. Market Analysis, Insights and Forecast - by End-User
- 5.2.1. Ambulatory Surgery Centers
- 5.2.2. Hospitals and Specialty Clinics
- 5.2.3. Other End-users
- 5.3. Market Analysis, Insights and Forecast - by Region
- 5.3.1. North America
- 5.3.2. Europe
- 5.3.3. Asia Pacific
- 5.3.4. Middle East and Africa
- 5.3.5. South America
- 5.1. Market Analysis, Insights and Forecast - by Therapy Type
- 6. North America Gastric Cancer Therapy Industry Analysis, Insights and Forecast, 2019-2031
- 6.1. Market Analysis, Insights and Forecast - by Therapy Type
- 6.1.1. Chemotherapy
- 6.1.2. Targeted Therapy
- 6.1.3. Immunotherapy
- 6.1.4. Radiation Therapy
- 6.1.5. Surgery
- 6.2. Market Analysis, Insights and Forecast - by End-User
- 6.2.1. Ambulatory Surgery Centers
- 6.2.2. Hospitals and Specialty Clinics
- 6.2.3. Other End-users
- 6.1. Market Analysis, Insights and Forecast - by Therapy Type
- 7. Europe Gastric Cancer Therapy Industry Analysis, Insights and Forecast, 2019-2031
- 7.1. Market Analysis, Insights and Forecast - by Therapy Type
- 7.1.1. Chemotherapy
- 7.1.2. Targeted Therapy
- 7.1.3. Immunotherapy
- 7.1.4. Radiation Therapy
- 7.1.5. Surgery
- 7.2. Market Analysis, Insights and Forecast - by End-User
- 7.2.1. Ambulatory Surgery Centers
- 7.2.2. Hospitals and Specialty Clinics
- 7.2.3. Other End-users
- 7.1. Market Analysis, Insights and Forecast - by Therapy Type
- 8. Asia Pacific Gastric Cancer Therapy Industry Analysis, Insights and Forecast, 2019-2031
- 8.1. Market Analysis, Insights and Forecast - by Therapy Type
- 8.1.1. Chemotherapy
- 8.1.2. Targeted Therapy
- 8.1.3. Immunotherapy
- 8.1.4. Radiation Therapy
- 8.1.5. Surgery
- 8.2. Market Analysis, Insights and Forecast - by End-User
- 8.2.1. Ambulatory Surgery Centers
- 8.2.2. Hospitals and Specialty Clinics
- 8.2.3. Other End-users
- 8.1. Market Analysis, Insights and Forecast - by Therapy Type
- 9. Middle East and Africa Gastric Cancer Therapy Industry Analysis, Insights and Forecast, 2019-2031
- 9.1. Market Analysis, Insights and Forecast - by Therapy Type
- 9.1.1. Chemotherapy
- 9.1.2. Targeted Therapy
- 9.1.3. Immunotherapy
- 9.1.4. Radiation Therapy
- 9.1.5. Surgery
- 9.2. Market Analysis, Insights and Forecast - by End-User
- 9.2.1. Ambulatory Surgery Centers
- 9.2.2. Hospitals and Specialty Clinics
- 9.2.3. Other End-users
- 9.1. Market Analysis, Insights and Forecast - by Therapy Type
- 10. South America Gastric Cancer Therapy Industry Analysis, Insights and Forecast, 2019-2031
- 10.1. Market Analysis, Insights and Forecast - by Therapy Type
- 10.1.1. Chemotherapy
- 10.1.2. Targeted Therapy
- 10.1.3. Immunotherapy
- 10.1.4. Radiation Therapy
- 10.1.5. Surgery
- 10.2. Market Analysis, Insights and Forecast - by End-User
- 10.2.1. Ambulatory Surgery Centers
- 10.2.2. Hospitals and Specialty Clinics
- 10.2.3. Other End-users
- 10.1. Market Analysis, Insights and Forecast - by Therapy Type
- 11. North America Gastric Cancer Therapy Industry Analysis, Insights and Forecast, 2019-2031
- 11.1. Market Analysis, Insights and Forecast - By Country/Sub-region
- 11.1.1 United States
- 11.1.2 Canada
- 11.1.3 Mexico
- 12. Europe Gastric Cancer Therapy Industry Analysis, Insights and Forecast, 2019-2031
- 12.1. Market Analysis, Insights and Forecast - By Country/Sub-region
- 12.1.1 Germany
- 12.1.2 United Kingdom
- 12.1.3 France
- 12.1.4 Italy
- 12.1.5 Spain
- 12.1.6 Rest of Europe
- 13. Asia Pacific Gastric Cancer Therapy Industry Analysis, Insights and Forecast, 2019-2031
- 13.1. Market Analysis, Insights and Forecast - By Country/Sub-region
- 13.1.1 China
- 13.1.2 Japan
- 13.1.3 India
- 13.1.4 Australia
- 13.1.5 South Korea
- 13.1.6 Rest of Asia Pacific
- 14. Middle East and Africa Gastric Cancer Therapy Industry Analysis, Insights and Forecast, 2019-2031
- 14.1. Market Analysis, Insights and Forecast - By Country/Sub-region
- 14.1.1 GCC
- 14.1.2 South Africa
- 14.1.3 Rest of Middle East and Africa
- 15. South America Gastric Cancer Therapy Industry Analysis, Insights and Forecast, 2019-2031
- 15.1. Market Analysis, Insights and Forecast - By Country/Sub-region
- 15.1.1 Brazil
- 15.1.2 Argentina
- 15.1.3 Rest of South America
- 16. Competitive Analysis
- 16.1. Global Market Share Analysis 2024
- 16.2. Company Profiles
- 16.2.1 Celltrion Healthcare Co Ltd
- 16.2.1.1. Overview
- 16.2.1.2. Products
- 16.2.1.3. SWOT Analysis
- 16.2.1.4. Recent Developments
- 16.2.1.5. Financials (Based on Availability)
- 16.2.2 Astrazeneca
- 16.2.2.1. Overview
- 16.2.2.2. Products
- 16.2.2.3. SWOT Analysis
- 16.2.2.4. Recent Developments
- 16.2.2.5. Financials (Based on Availability)
- 16.2.3 Novartis AG
- 16.2.3.1. Overview
- 16.2.3.2. Products
- 16.2.3.3. SWOT Analysis
- 16.2.3.4. Recent Developments
- 16.2.3.5. Financials (Based on Availability)
- 16.2.4 Merck & Co Inc
- 16.2.4.1. Overview
- 16.2.4.2. Products
- 16.2.4.3. SWOT Analysis
- 16.2.4.4. Recent Developments
- 16.2.4.5. Financials (Based on Availability)
- 16.2.5 F Hoffmann-La Roche Ltd
- 16.2.5.1. Overview
- 16.2.5.2. Products
- 16.2.5.3. SWOT Analysis
- 16.2.5.4. Recent Developments
- 16.2.5.5. Financials (Based on Availability)
- 16.2.6 Amgen*List Not Exhaustive
- 16.2.6.1. Overview
- 16.2.6.2. Products
- 16.2.6.3. SWOT Analysis
- 16.2.6.4. Recent Developments
- 16.2.6.5. Financials (Based on Availability)
- 16.2.7 Eli Lilly and Company
- 16.2.7.1. Overview
- 16.2.7.2. Products
- 16.2.7.3. SWOT Analysis
- 16.2.7.4. Recent Developments
- 16.2.7.5. Financials (Based on Availability)
- 16.2.8 Otsuka Holdings Co Ltd
- 16.2.8.1. Overview
- 16.2.8.2. Products
- 16.2.8.3. SWOT Analysis
- 16.2.8.4. Recent Developments
- 16.2.8.5. Financials (Based on Availability)
- 16.2.9 GSK plc
- 16.2.9.1. Overview
- 16.2.9.2. Products
- 16.2.9.3. SWOT Analysis
- 16.2.9.4. Recent Developments
- 16.2.9.5. Financials (Based on Availability)
- 16.2.10 Imugene Limited
- 16.2.10.1. Overview
- 16.2.10.2. Products
- 16.2.10.3. SWOT Analysis
- 16.2.10.4. Recent Developments
- 16.2.10.5. Financials (Based on Availability)
- 16.2.11 Bristol-Myers Squibb Company
- 16.2.11.1. Overview
- 16.2.11.2. Products
- 16.2.11.3. SWOT Analysis
- 16.2.11.4. Recent Developments
- 16.2.11.5. Financials (Based on Availability)
- 16.2.12 Sanofi S A
- 16.2.12.1. Overview
- 16.2.12.2. Products
- 16.2.12.3. SWOT Analysis
- 16.2.12.4. Recent Developments
- 16.2.12.5. Financials (Based on Availability)
- 16.2.13 Pfizer Inc
- 16.2.13.1. Overview
- 16.2.13.2. Products
- 16.2.13.3. SWOT Analysis
- 16.2.13.4. Recent Developments
- 16.2.13.5. Financials (Based on Availability)
- 16.2.1 Celltrion Healthcare Co Ltd
List of Figures
- Figure 1: Global Gastric Cancer Therapy Industry Revenue Breakdown (Million, %) by Region 2024 & 2032
- Figure 2: North America Gastric Cancer Therapy Industry Revenue (Million), by Country 2024 & 2032
- Figure 3: North America Gastric Cancer Therapy Industry Revenue Share (%), by Country 2024 & 2032
- Figure 4: Europe Gastric Cancer Therapy Industry Revenue (Million), by Country 2024 & 2032
- Figure 5: Europe Gastric Cancer Therapy Industry Revenue Share (%), by Country 2024 & 2032
- Figure 6: Asia Pacific Gastric Cancer Therapy Industry Revenue (Million), by Country 2024 & 2032
- Figure 7: Asia Pacific Gastric Cancer Therapy Industry Revenue Share (%), by Country 2024 & 2032
- Figure 8: Middle East and Africa Gastric Cancer Therapy Industry Revenue (Million), by Country 2024 & 2032
- Figure 9: Middle East and Africa Gastric Cancer Therapy Industry Revenue Share (%), by Country 2024 & 2032
- Figure 10: South America Gastric Cancer Therapy Industry Revenue (Million), by Country 2024 & 2032
- Figure 11: South America Gastric Cancer Therapy Industry Revenue Share (%), by Country 2024 & 2032
- Figure 12: North America Gastric Cancer Therapy Industry Revenue (Million), by Therapy Type 2024 & 2032
- Figure 13: North America Gastric Cancer Therapy Industry Revenue Share (%), by Therapy Type 2024 & 2032
- Figure 14: North America Gastric Cancer Therapy Industry Revenue (Million), by End-User 2024 & 2032
- Figure 15: North America Gastric Cancer Therapy Industry Revenue Share (%), by End-User 2024 & 2032
- Figure 16: North America Gastric Cancer Therapy Industry Revenue (Million), by Country 2024 & 2032
- Figure 17: North America Gastric Cancer Therapy Industry Revenue Share (%), by Country 2024 & 2032
- Figure 18: Europe Gastric Cancer Therapy Industry Revenue (Million), by Therapy Type 2024 & 2032
- Figure 19: Europe Gastric Cancer Therapy Industry Revenue Share (%), by Therapy Type 2024 & 2032
- Figure 20: Europe Gastric Cancer Therapy Industry Revenue (Million), by End-User 2024 & 2032
- Figure 21: Europe Gastric Cancer Therapy Industry Revenue Share (%), by End-User 2024 & 2032
- Figure 22: Europe Gastric Cancer Therapy Industry Revenue (Million), by Country 2024 & 2032
- Figure 23: Europe Gastric Cancer Therapy Industry Revenue Share (%), by Country 2024 & 2032
- Figure 24: Asia Pacific Gastric Cancer Therapy Industry Revenue (Million), by Therapy Type 2024 & 2032
- Figure 25: Asia Pacific Gastric Cancer Therapy Industry Revenue Share (%), by Therapy Type 2024 & 2032
- Figure 26: Asia Pacific Gastric Cancer Therapy Industry Revenue (Million), by End-User 2024 & 2032
- Figure 27: Asia Pacific Gastric Cancer Therapy Industry Revenue Share (%), by End-User 2024 & 2032
- Figure 28: Asia Pacific Gastric Cancer Therapy Industry Revenue (Million), by Country 2024 & 2032
- Figure 29: Asia Pacific Gastric Cancer Therapy Industry Revenue Share (%), by Country 2024 & 2032
- Figure 30: Middle East and Africa Gastric Cancer Therapy Industry Revenue (Million), by Therapy Type 2024 & 2032
- Figure 31: Middle East and Africa Gastric Cancer Therapy Industry Revenue Share (%), by Therapy Type 2024 & 2032
- Figure 32: Middle East and Africa Gastric Cancer Therapy Industry Revenue (Million), by End-User 2024 & 2032
- Figure 33: Middle East and Africa Gastric Cancer Therapy Industry Revenue Share (%), by End-User 2024 & 2032
- Figure 34: Middle East and Africa Gastric Cancer Therapy Industry Revenue (Million), by Country 2024 & 2032
- Figure 35: Middle East and Africa Gastric Cancer Therapy Industry Revenue Share (%), by Country 2024 & 2032
- Figure 36: South America Gastric Cancer Therapy Industry Revenue (Million), by Therapy Type 2024 & 2032
- Figure 37: South America Gastric Cancer Therapy Industry Revenue Share (%), by Therapy Type 2024 & 2032
- Figure 38: South America Gastric Cancer Therapy Industry Revenue (Million), by End-User 2024 & 2032
- Figure 39: South America Gastric Cancer Therapy Industry Revenue Share (%), by End-User 2024 & 2032
- Figure 40: South America Gastric Cancer Therapy Industry Revenue (Million), by Country 2024 & 2032
- Figure 41: South America Gastric Cancer Therapy Industry Revenue Share (%), by Country 2024 & 2032
List of Tables
- Table 1: Global Gastric Cancer Therapy Industry Revenue Million Forecast, by Region 2019 & 2032
- Table 2: Global Gastric Cancer Therapy Industry Revenue Million Forecast, by Therapy Type 2019 & 2032
- Table 3: Global Gastric Cancer Therapy Industry Revenue Million Forecast, by End-User 2019 & 2032
- Table 4: Global Gastric Cancer Therapy Industry Revenue Million Forecast, by Region 2019 & 2032
- Table 5: Global Gastric Cancer Therapy Industry Revenue Million Forecast, by Country 2019 & 2032
- Table 6: United States Gastric Cancer Therapy Industry Revenue (Million) Forecast, by Application 2019 & 2032
- Table 7: Canada Gastric Cancer Therapy Industry Revenue (Million) Forecast, by Application 2019 & 2032
- Table 8: Mexico Gastric Cancer Therapy Industry Revenue (Million) Forecast, by Application 2019 & 2032
- Table 9: Global Gastric Cancer Therapy Industry Revenue Million Forecast, by Country 2019 & 2032
- Table 10: Germany Gastric Cancer Therapy Industry Revenue (Million) Forecast, by Application 2019 & 2032
- Table 11: United Kingdom Gastric Cancer Therapy Industry Revenue (Million) Forecast, by Application 2019 & 2032
- Table 12: France Gastric Cancer Therapy Industry Revenue (Million) Forecast, by Application 2019 & 2032
- Table 13: Italy Gastric Cancer Therapy Industry Revenue (Million) Forecast, by Application 2019 & 2032
- Table 14: Spain Gastric Cancer Therapy Industry Revenue (Million) Forecast, by Application 2019 & 2032
- Table 15: Rest of Europe Gastric Cancer Therapy Industry Revenue (Million) Forecast, by Application 2019 & 2032
- Table 16: Global Gastric Cancer Therapy Industry Revenue Million Forecast, by Country 2019 & 2032
- Table 17: China Gastric Cancer Therapy Industry Revenue (Million) Forecast, by Application 2019 & 2032
- Table 18: Japan Gastric Cancer Therapy Industry Revenue (Million) Forecast, by Application 2019 & 2032
- Table 19: India Gastric Cancer Therapy Industry Revenue (Million) Forecast, by Application 2019 & 2032
- Table 20: Australia Gastric Cancer Therapy Industry Revenue (Million) Forecast, by Application 2019 & 2032
- Table 21: South Korea Gastric Cancer Therapy Industry Revenue (Million) Forecast, by Application 2019 & 2032
- Table 22: Rest of Asia Pacific Gastric Cancer Therapy Industry Revenue (Million) Forecast, by Application 2019 & 2032
- Table 23: Global Gastric Cancer Therapy Industry Revenue Million Forecast, by Country 2019 & 2032
- Table 24: GCC Gastric Cancer Therapy Industry Revenue (Million) Forecast, by Application 2019 & 2032
- Table 25: South Africa Gastric Cancer Therapy Industry Revenue (Million) Forecast, by Application 2019 & 2032
- Table 26: Rest of Middle East and Africa Gastric Cancer Therapy Industry Revenue (Million) Forecast, by Application 2019 & 2032
- Table 27: Global Gastric Cancer Therapy Industry Revenue Million Forecast, by Country 2019 & 2032
- Table 28: Brazil Gastric Cancer Therapy Industry Revenue (Million) Forecast, by Application 2019 & 2032
- Table 29: Argentina Gastric Cancer Therapy Industry Revenue (Million) Forecast, by Application 2019 & 2032
- Table 30: Rest of South America Gastric Cancer Therapy Industry Revenue (Million) Forecast, by Application 2019 & 2032
- Table 31: Global Gastric Cancer Therapy Industry Revenue Million Forecast, by Therapy Type 2019 & 2032
- Table 32: Global Gastric Cancer Therapy Industry Revenue Million Forecast, by End-User 2019 & 2032
- Table 33: Global Gastric Cancer Therapy Industry Revenue Million Forecast, by Country 2019 & 2032
- Table 34: United States Gastric Cancer Therapy Industry Revenue (Million) Forecast, by Application 2019 & 2032
- Table 35: Canada Gastric Cancer Therapy Industry Revenue (Million) Forecast, by Application 2019 & 2032
- Table 36: Mexico Gastric Cancer Therapy Industry Revenue (Million) Forecast, by Application 2019 & 2032
- Table 37: Global Gastric Cancer Therapy Industry Revenue Million Forecast, by Therapy Type 2019 & 2032
- Table 38: Global Gastric Cancer Therapy Industry Revenue Million Forecast, by End-User 2019 & 2032
- Table 39: Global Gastric Cancer Therapy Industry Revenue Million Forecast, by Country 2019 & 2032
- Table 40: Germany Gastric Cancer Therapy Industry Revenue (Million) Forecast, by Application 2019 & 2032
- Table 41: United Kingdom Gastric Cancer Therapy Industry Revenue (Million) Forecast, by Application 2019 & 2032
- Table 42: France Gastric Cancer Therapy Industry Revenue (Million) Forecast, by Application 2019 & 2032
- Table 43: Italy Gastric Cancer Therapy Industry Revenue (Million) Forecast, by Application 2019 & 2032
- Table 44: Spain Gastric Cancer Therapy Industry Revenue (Million) Forecast, by Application 2019 & 2032
- Table 45: Rest of Europe Gastric Cancer Therapy Industry Revenue (Million) Forecast, by Application 2019 & 2032
- Table 46: Global Gastric Cancer Therapy Industry Revenue Million Forecast, by Therapy Type 2019 & 2032
- Table 47: Global Gastric Cancer Therapy Industry Revenue Million Forecast, by End-User 2019 & 2032
- Table 48: Global Gastric Cancer Therapy Industry Revenue Million Forecast, by Country 2019 & 2032
- Table 49: China Gastric Cancer Therapy Industry Revenue (Million) Forecast, by Application 2019 & 2032
- Table 50: Japan Gastric Cancer Therapy Industry Revenue (Million) Forecast, by Application 2019 & 2032
- Table 51: India Gastric Cancer Therapy Industry Revenue (Million) Forecast, by Application 2019 & 2032
- Table 52: Australia Gastric Cancer Therapy Industry Revenue (Million) Forecast, by Application 2019 & 2032
- Table 53: South Korea Gastric Cancer Therapy Industry Revenue (Million) Forecast, by Application 2019 & 2032
- Table 54: Rest of Asia Pacific Gastric Cancer Therapy Industry Revenue (Million) Forecast, by Application 2019 & 2032
- Table 55: Global Gastric Cancer Therapy Industry Revenue Million Forecast, by Therapy Type 2019 & 2032
- Table 56: Global Gastric Cancer Therapy Industry Revenue Million Forecast, by End-User 2019 & 2032
- Table 57: Global Gastric Cancer Therapy Industry Revenue Million Forecast, by Country 2019 & 2032
- Table 58: GCC Gastric Cancer Therapy Industry Revenue (Million) Forecast, by Application 2019 & 2032
- Table 59: South Africa Gastric Cancer Therapy Industry Revenue (Million) Forecast, by Application 2019 & 2032
- Table 60: Rest of Middle East and Africa Gastric Cancer Therapy Industry Revenue (Million) Forecast, by Application 2019 & 2032
- Table 61: Global Gastric Cancer Therapy Industry Revenue Million Forecast, by Therapy Type 2019 & 2032
- Table 62: Global Gastric Cancer Therapy Industry Revenue Million Forecast, by End-User 2019 & 2032
- Table 63: Global Gastric Cancer Therapy Industry Revenue Million Forecast, by Country 2019 & 2032
- Table 64: Brazil Gastric Cancer Therapy Industry Revenue (Million) Forecast, by Application 2019 & 2032
- Table 65: Argentina Gastric Cancer Therapy Industry Revenue (Million) Forecast, by Application 2019 & 2032
- Table 66: Rest of South America Gastric Cancer Therapy Industry Revenue (Million) Forecast, by Application 2019 & 2032
Frequently Asked Questions
1. What is the projected Compound Annual Growth Rate (CAGR) of the Gastric Cancer Therapy Industry?
The projected CAGR is approximately 12.63%.
2. Which companies are prominent players in the Gastric Cancer Therapy Industry?
Key companies in the market include Celltrion Healthcare Co Ltd, Astrazeneca, Novartis AG, Merck & Co Inc, F Hoffmann-La Roche Ltd, Amgen*List Not Exhaustive, Eli Lilly and Company, Otsuka Holdings Co Ltd, GSK plc, Imugene Limited, Bristol-Myers Squibb Company, Sanofi S A, Pfizer Inc.
3. What are the main segments of the Gastric Cancer Therapy Industry?
The market segments include Therapy Type, End-User.
4. Can you provide details about the market size?
The market size is estimated to be USD 5.32 Million as of 2022.
5. What are some drivers contributing to market growth?
Growing Burden of Gastric Cancer; Increase in Research and Development for Novel Therapies Coupled with Government Initiatives.
6. What are the notable trends driving market growth?
Targeted Segment is Expected to Hold a Significant Share of the Market Over the Forecast Period.
7. Are there any restraints impacting market growth?
High Cost of Cancer Therapy and Side Effects of Cancer Drugs.
8. Can you provide examples of recent developments in the market?
March 2023: Akeso, Inc., completed the patient enrollment for its pivotal Phase III clinical trial involving cadonilimab (PD-1/CTLA-4 bi-specific antibody, AK104), which stands as the world's pioneering dual-immune checkpoint bi-specific antibody drug to be approved and brought to market. This marks a step closer to the launch of cadonilimab for a major indication after the indication for treatment of cervical cancer has been approved.
9. What pricing options are available for accessing the report?
Pricing options include single-user, multi-user, and enterprise licenses priced at USD 4750, USD 5250, and USD 8750 respectively.
10. Is the market size provided in terms of value or volume?
The market size is provided in terms of value, measured in Million.
11. Are there any specific market keywords associated with the report?
Yes, the market keyword associated with the report is "Gastric Cancer Therapy Industry," which aids in identifying and referencing the specific market segment covered.
12. How do I determine which pricing option suits my needs best?
The pricing options vary based on user requirements and access needs. Individual users may opt for single-user licenses, while businesses requiring broader access may choose multi-user or enterprise licenses for cost-effective access to the report.
13. Are there any additional resources or data provided in the Gastric Cancer Therapy Industry report?
While the report offers comprehensive insights, it's advisable to review the specific contents or supplementary materials provided to ascertain if additional resources or data are available.
14. How can I stay updated on further developments or reports in the Gastric Cancer Therapy Industry?
To stay informed about further developments, trends, and reports in the Gastric Cancer Therapy Industry, consider subscribing to industry newsletters, following relevant companies and organizations, or regularly checking reputable industry news sources and publications.
Methodology
Step 1 - Identification of Relevant Samples Size from Population Database


Step 2 - Approaches for Defining Global Market Size (Value, Volume* & Price*)

Note*: In applicable scenarios
Step 3 - Data Sources
Primary Research
- Web Analytics
- Survey Reports
- Research Institute
- Latest Research Reports
- Opinion Leaders
Secondary Research
- Annual Reports
- White Paper
- Latest Press Release
- Industry Association
- Paid Database
- Investor Presentations

Step 4 - Data Triangulation
Involves using different sources of information in order to increase the validity of a study
These sources are likely to be stakeholders in a program - participants, other researchers, program staff, other community members, and so on.
Then we put all data in single framework & apply various statistical tools to find out the dynamic on the market.
During the analysis stage, feedback from the stakeholder groups would be compared to determine areas of agreement as well as areas of divergence


