
Key Insights
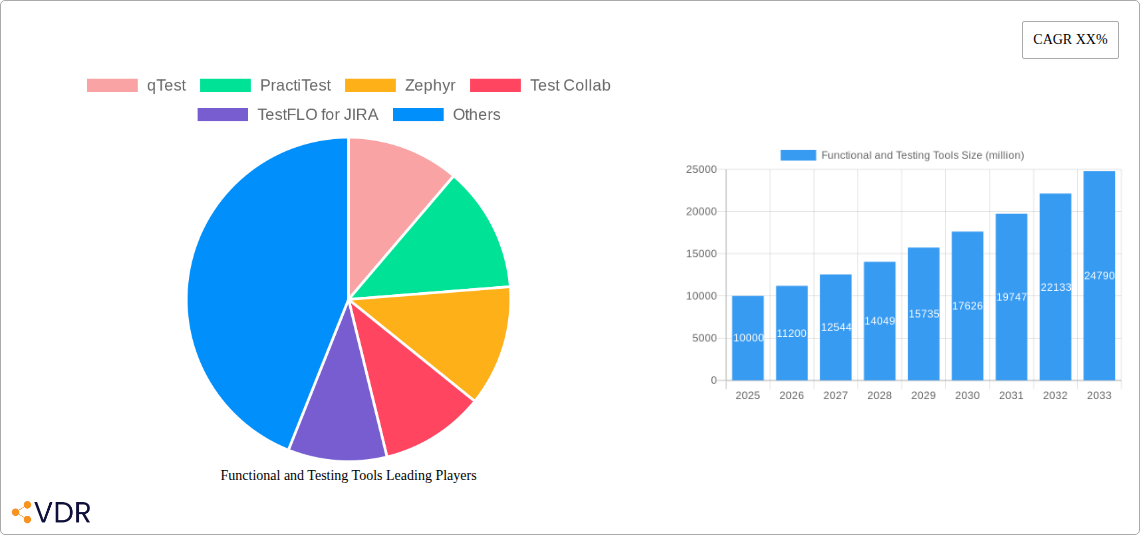
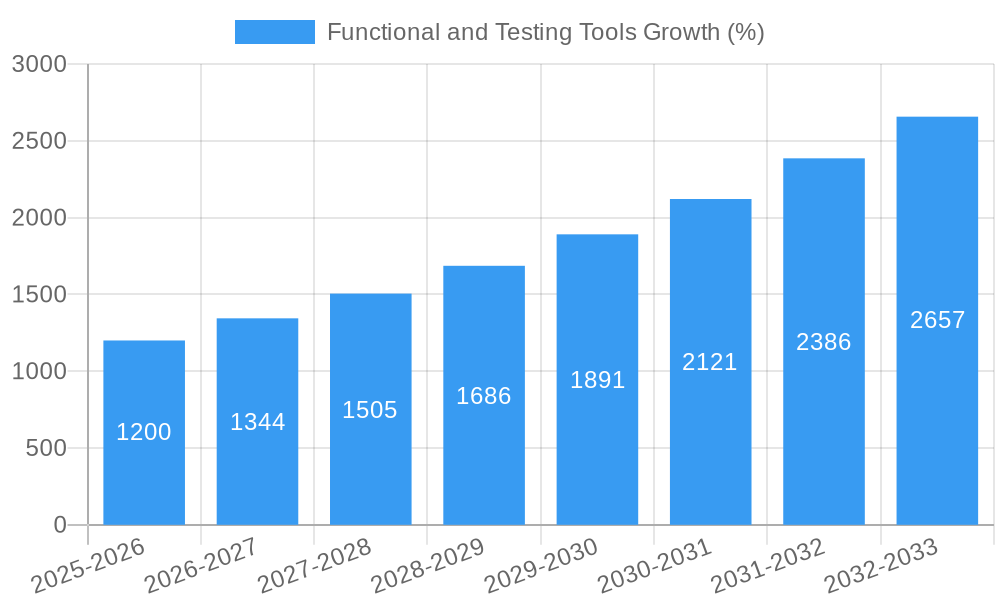
The global market for functional and testing tools is experiencing robust growth, driven by the increasing complexity of software applications and the rising demand for high-quality software releases. The market, estimated at $10 billion in 2025, is projected to maintain a healthy Compound Annual Growth Rate (CAGR) of 12% from 2025 to 2033, reaching approximately $28 billion by 2033. This expansion is fueled by several key factors, including the widespread adoption of DevOps and Agile methodologies, the growing need for automation in testing processes, and the increasing prevalence of cloud-based testing solutions. Businesses across diverse sectors, from finance and healthcare to e-commerce and technology, are increasingly investing in these tools to accelerate software delivery cycles, enhance software quality, and reduce development costs. The shift towards continuous integration and continuous delivery (CI/CD) pipelines is significantly driving the demand for integrated and automated testing solutions.
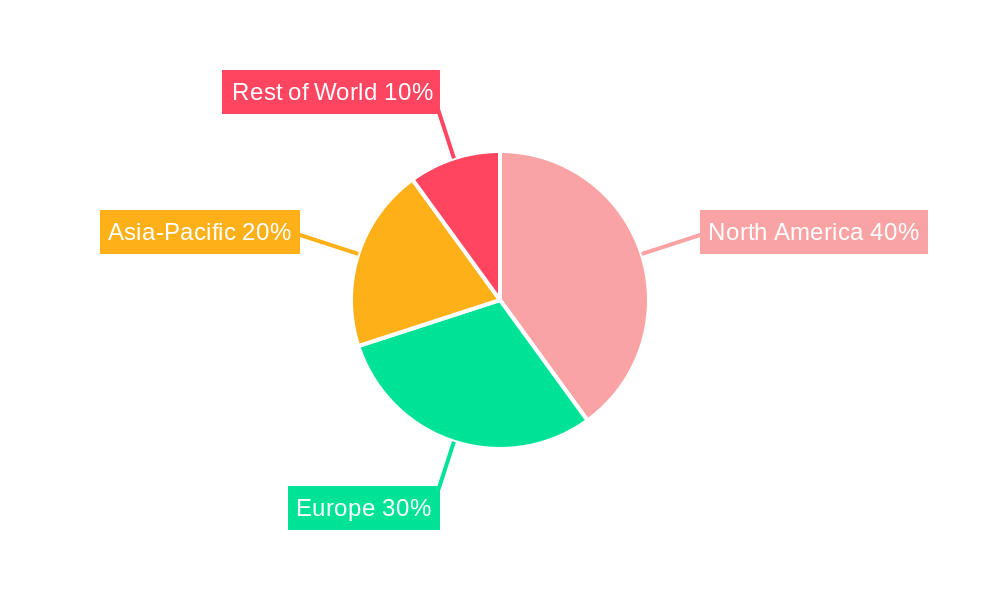
The market is segmented into various categories based on tool type (e.g., test management, performance testing, security testing), deployment model (cloud, on-premise), and organization size. Key players like qTest, Zephyr, and TestRail are actively competing through innovation in areas such as AI-powered test automation, integration with DevOps platforms, and enhanced reporting capabilities. However, the market also faces certain restraints, including the high initial investment costs associated with implementing sophisticated testing tools and the need for skilled professionals to effectively utilize these tools. The ongoing evolution of technologies like artificial intelligence and machine learning is expected to further reshape the landscape, offering opportunities for new entrants and driving further innovation in test automation and intelligent test case generation. Geographic variations exist, with North America and Europe currently dominating the market, but growth is expected from Asia-Pacific and other emerging regions as digital transformation accelerates.
Functional and Testing Tools Market Report: 2019-2033
This comprehensive report provides a detailed analysis of the Functional and Testing Tools market, encompassing market dynamics, growth trends, regional analysis, competitive landscape, and future outlook. The study period covers 2019-2033, with 2025 as the base and estimated year. The forecast period is 2025-2033, and the historical period is 2019-2024. The market is segmented by various factors (specific segments not provided in prompt, so using "xx" as a placeholder for now), and key players include qTest, PractiTest, Zephyr, Test Collab, TestFLO for JIRA, XQual, TestCaseLab, Adaptavist, QACoverage, Plutora Test, Inflectra, Meliora Testlab, aqua, Panaya, Testpad, JunoOne, and ReQtest. The report offers invaluable insights for industry professionals, investors, and stakeholders seeking to understand and capitalize on the opportunities within this dynamic market. The total market size in 2025 is estimated at $xx billion.
Functional and Testing Tools Market Dynamics & Structure
The Functional and Testing Tools market is characterized by moderate concentration, with a few major players holding significant market share, but a considerable number of smaller, specialized vendors also competing. Technological innovation, particularly in areas like AI-powered testing and automation, is a key driver. Regulatory frameworks concerning data privacy and security are increasingly influencing market practices. The market also experiences competitive pressure from open-source alternatives and internal development efforts. End-user demographics are broad, encompassing enterprises across various industries, and M&A activity is relatively consistent, driving consolidation and market expansion.
- Market Concentration: The top 5 players hold approximately xx% of the market share in 2025.
- Technological Innovation: AI-driven testing and automation are major drivers, increasing efficiency and reducing costs.
- Regulatory Frameworks: GDPR, CCPA, and other data privacy regulations influence tool selection and implementation.
- Competitive Substitutes: Open-source tools and in-house development pose competitive challenges.
- M&A Activity: An average of xx M&A deals per year were observed during 2019-2024. This trend is expected to continue with xx deals predicted for 2025-2033.
- Innovation Barriers: High development costs and integration complexities represent significant challenges.
Functional and Testing Tools Growth Trends & Insights
The Functional and Testing Tools market experienced robust growth during the historical period (2019-2024), with a Compound Annual Growth Rate (CAGR) of xx%. This growth is fueled by increasing software complexity, the adoption of Agile and DevOps methodologies, and the growing demand for higher software quality. Market penetration is currently at xx% in the target segments and is projected to reach xx% by 2033. Technological disruptions, like the rise of cloud-based testing and the integration of AI/ML, significantly impact market dynamics. Consumer behavior is shifting toward cloud-based, subscription models and demand for increased automation. The market size is expected to reach $xx billion by 2033.
Dominant Regions, Countries, or Segments in Functional and Testing Tools
North America currently dominates the Functional and Testing Tools market, holding the largest market share due to factors such as high adoption of advanced technologies, strong IT infrastructure, and a significant presence of major players. Europe follows as a significant market, driven by regulatory compliance needs and a growing focus on software quality. Asia-Pacific is experiencing the fastest growth rate, propelled by rapid technological advancements and expanding digital economies.
- North America: High adoption of Agile/DevOps, strong IT spending, presence of major players.
- Europe: Regulatory compliance drivers (GDPR, etc.), growing software development sector.
- Asia-Pacific: Rapid technological advancements, expanding digital economy, increasing IT investment.
- Market Share: North America holds approximately xx% of the market share in 2025. Asia-Pacific is expected to increase its share to xx% by 2033.
Functional and Testing Tools Product Landscape
The Functional and Testing Tools market offers a diverse range of products, from basic test management tools to advanced AI-powered automation platforms. Key innovations include integrated AI-powered test generation and analysis, improved reporting and analytics, enhanced collaboration features, and seamless integration with DevOps pipelines. These advancements improve testing efficiency, accelerate release cycles, and enhance software quality. Unique selling propositions often center on specific integrations, ease of use, specialized features, or advanced analytics capabilities.
Key Drivers, Barriers & Challenges in Functional and Testing Tools
Key Drivers: The rising complexity of software applications, the increasing adoption of Agile and DevOps methodologies, and the growing demand for high-quality software are major drivers. The shift towards cloud-based solutions and the integration of AI and ML also contribute to market growth.
Key Challenges: Integration complexities, high implementation costs, the scarcity of skilled professionals, and the need for continuous adaptation to evolving technologies present significant barriers. Supply chain disruptions and regulatory changes can also impact market growth. Competitive pressure from open-source alternatives and internal development efforts further contributes to market challenges. The estimated impact of these challenges on market growth is a reduction of xx% in 2025.
Emerging Opportunities in Functional and Testing Tools
The market presents considerable opportunities in areas like AI-powered test automation, serverless testing, intelligent test case generation, and the integration of testing tools with security testing tools. Untapped markets exist within specific industry verticals and regions. Evolving consumer preferences for cloud-based and subscription-based solutions represent significant opportunities. The increased focus on cybersecurity also presents a significant market opportunity.
Growth Accelerators in the Functional and Testing Tools Industry
Strategic partnerships between testing tool vendors and cloud providers are accelerating market growth. Technological breakthroughs, particularly in the areas of AI and ML, are enhancing the capabilities of testing tools. Market expansion strategies focusing on emerging economies and untapped industry verticals are further driving market growth.
Key Players Shaping the Functional and Testing Tools Market
- qTest
- PractiTest
- Zephyr
- Test Collab
- TestFLO for JIRA
- XQual
- TestCaseLab
- Adaptavist
- QACoverage
- Plutora Test
- Inflectra
- Meliora Testlab
- aqua
- Panaya
- Testpad
- JunoOne
- ReQtest
Notable Milestones in Functional and Testing Tools Sector
- 2020: Increased adoption of cloud-based testing solutions.
- 2021: Significant advancements in AI-powered test automation.
- 2022: Several key M&A activities reshaped the market landscape.
- 2023: Launch of several new platforms with advanced analytics capabilities.
- 2024: Growing integration of testing tools within CI/CD pipelines.
In-Depth Functional and Testing Tools Market Outlook
The Functional and Testing Tools market is poised for continued growth driven by the factors previously discussed. The increasing demand for higher quality software, the ongoing adoption of Agile and DevOps methodologies, and the continued innovation in testing technologies ensure a promising future. Strategic partnerships, technological advancements, and expansion into emerging markets will be key to success for players in this dynamic market. The potential for market expansion is significant, with projections indicating strong growth throughout the forecast period.
Functional and Testing Tools Segmentation
-
1. Application
- 1.1. Large Enterprise
- 1.2. SMBs
-
2. Types
- 2.1. Cloud-Based
- 2.2. On-Premise
Functional and Testing Tools Segmentation By Geography
-
1. North America
- 1.1. United States
- 1.2. Canada
- 1.3. Mexico
-
2. South America
- 2.1. Brazil
- 2.2. Argentina
- 2.3. Rest of South America
-
3. Europe
- 3.1. United Kingdom
- 3.2. Germany
- 3.3. France
- 3.4. Italy
- 3.5. Spain
- 3.6. Russia
- 3.7. Benelux
- 3.8. Nordics
- 3.9. Rest of Europe
-
4. Middle East & Africa
- 4.1. Turkey
- 4.2. Israel
- 4.3. GCC
- 4.4. North Africa
- 4.5. South Africa
- 4.6. Rest of Middle East & Africa
-
5. Asia Pacific
- 5.1. China
- 5.2. India
- 5.3. Japan
- 5.4. South Korea
- 5.5. ASEAN
- 5.6. Oceania
- 5.7. Rest of Asia Pacific
Functional and Testing Tools REPORT HIGHLIGHTS
| Aspects | Details |
|---|---|
| Study Period | 2019-2033 |
| Base Year | 2024 |
| Estimated Year | 2025 |
| Forecast Period | 2025-2033 |
| Historical Period | 2019-2024 |
| Growth Rate | CAGR of XX% from 2019-2033 |
| Segmentation |
|
Table of Contents
- 1. Introduction
- 1.1. Research Scope
- 1.2. Market Segmentation
- 1.3. Research Methodology
- 1.4. Definitions and Assumptions
- 2. Executive Summary
- 2.1. Introduction
- 3. Market Dynamics
- 3.1. Introduction
- 3.2. Market Drivers
- 3.3. Market Restrains
- 3.4. Market Trends
- 4. Market Factor Analysis
- 4.1. Porters Five Forces
- 4.2. Supply/Value Chain
- 4.3. PESTEL analysis
- 4.4. Market Entropy
- 4.5. Patent/Trademark Analysis
- 5. Global Functional and Testing Tools Analysis, Insights and Forecast, 2019-2031
- 5.1. Market Analysis, Insights and Forecast - by Application
- 5.1.1. Large Enterprise
- 5.1.2. SMBs
- 5.2. Market Analysis, Insights and Forecast - by Types
- 5.2.1. Cloud-Based
- 5.2.2. On-Premise
- 5.3. Market Analysis, Insights and Forecast - by Region
- 5.3.1. North America
- 5.3.2. South America
- 5.3.3. Europe
- 5.3.4. Middle East & Africa
- 5.3.5. Asia Pacific
- 5.1. Market Analysis, Insights and Forecast - by Application
- 6. North America Functional and Testing Tools Analysis, Insights and Forecast, 2019-2031
- 6.1. Market Analysis, Insights and Forecast - by Application
- 6.1.1. Large Enterprise
- 6.1.2. SMBs
- 6.2. Market Analysis, Insights and Forecast - by Types
- 6.2.1. Cloud-Based
- 6.2.2. On-Premise
- 6.1. Market Analysis, Insights and Forecast - by Application
- 7. South America Functional and Testing Tools Analysis, Insights and Forecast, 2019-2031
- 7.1. Market Analysis, Insights and Forecast - by Application
- 7.1.1. Large Enterprise
- 7.1.2. SMBs
- 7.2. Market Analysis, Insights and Forecast - by Types
- 7.2.1. Cloud-Based
- 7.2.2. On-Premise
- 7.1. Market Analysis, Insights and Forecast - by Application
- 8. Europe Functional and Testing Tools Analysis, Insights and Forecast, 2019-2031
- 8.1. Market Analysis, Insights and Forecast - by Application
- 8.1.1. Large Enterprise
- 8.1.2. SMBs
- 8.2. Market Analysis, Insights and Forecast - by Types
- 8.2.1. Cloud-Based
- 8.2.2. On-Premise
- 8.1. Market Analysis, Insights and Forecast - by Application
- 9. Middle East & Africa Functional and Testing Tools Analysis, Insights and Forecast, 2019-2031
- 9.1. Market Analysis, Insights and Forecast - by Application
- 9.1.1. Large Enterprise
- 9.1.2. SMBs
- 9.2. Market Analysis, Insights and Forecast - by Types
- 9.2.1. Cloud-Based
- 9.2.2. On-Premise
- 9.1. Market Analysis, Insights and Forecast - by Application
- 10. Asia Pacific Functional and Testing Tools Analysis, Insights and Forecast, 2019-2031
- 10.1. Market Analysis, Insights and Forecast - by Application
- 10.1.1. Large Enterprise
- 10.1.2. SMBs
- 10.2. Market Analysis, Insights and Forecast - by Types
- 10.2.1. Cloud-Based
- 10.2.2. On-Premise
- 10.1. Market Analysis, Insights and Forecast - by Application
- 11. Competitive Analysis
- 11.1. Global Market Share Analysis 2024
- 11.2. Company Profiles
- 11.2.1 qTest
- 11.2.1.1. Overview
- 11.2.1.2. Products
- 11.2.1.3. SWOT Analysis
- 11.2.1.4. Recent Developments
- 11.2.1.5. Financials (Based on Availability)
- 11.2.2 PractiTest
- 11.2.2.1. Overview
- 11.2.2.2. Products
- 11.2.2.3. SWOT Analysis
- 11.2.2.4. Recent Developments
- 11.2.2.5. Financials (Based on Availability)
- 11.2.3 Zephyr
- 11.2.3.1. Overview
- 11.2.3.2. Products
- 11.2.3.3. SWOT Analysis
- 11.2.3.4. Recent Developments
- 11.2.3.5. Financials (Based on Availability)
- 11.2.4 Test Collab
- 11.2.4.1. Overview
- 11.2.4.2. Products
- 11.2.4.3. SWOT Analysis
- 11.2.4.4. Recent Developments
- 11.2.4.5. Financials (Based on Availability)
- 11.2.5 TestFLO for JIRA
- 11.2.5.1. Overview
- 11.2.5.2. Products
- 11.2.5.3. SWOT Analysis
- 11.2.5.4. Recent Developments
- 11.2.5.5. Financials (Based on Availability)
- 11.2.6 XQual
- 11.2.6.1. Overview
- 11.2.6.2. Products
- 11.2.6.3. SWOT Analysis
- 11.2.6.4. Recent Developments
- 11.2.6.5. Financials (Based on Availability)
- 11.2.7 TestCaseLab
- 11.2.7.1. Overview
- 11.2.7.2. Products
- 11.2.7.3. SWOT Analysis
- 11.2.7.4. Recent Developments
- 11.2.7.5. Financials (Based on Availability)
- 11.2.8 Adaptavist
- 11.2.8.1. Overview
- 11.2.8.2. Products
- 11.2.8.3. SWOT Analysis
- 11.2.8.4. Recent Developments
- 11.2.8.5. Financials (Based on Availability)
- 11.2.9 QACoverage
- 11.2.9.1. Overview
- 11.2.9.2. Products
- 11.2.9.3. SWOT Analysis
- 11.2.9.4. Recent Developments
- 11.2.9.5. Financials (Based on Availability)
- 11.2.10 Plutora Test
- 11.2.10.1. Overview
- 11.2.10.2. Products
- 11.2.10.3. SWOT Analysis
- 11.2.10.4. Recent Developments
- 11.2.10.5. Financials (Based on Availability)
- 11.2.11 Inflectra
- 11.2.11.1. Overview
- 11.2.11.2. Products
- 11.2.11.3. SWOT Analysis
- 11.2.11.4. Recent Developments
- 11.2.11.5. Financials (Based on Availability)
- 11.2.12 Meliora Testlab
- 11.2.12.1. Overview
- 11.2.12.2. Products
- 11.2.12.3. SWOT Analysis
- 11.2.12.4. Recent Developments
- 11.2.12.5. Financials (Based on Availability)
- 11.2.13 aqua
- 11.2.13.1. Overview
- 11.2.13.2. Products
- 11.2.13.3. SWOT Analysis
- 11.2.13.4. Recent Developments
- 11.2.13.5. Financials (Based on Availability)
- 11.2.14 Panaya
- 11.2.14.1. Overview
- 11.2.14.2. Products
- 11.2.14.3. SWOT Analysis
- 11.2.14.4. Recent Developments
- 11.2.14.5. Financials (Based on Availability)
- 11.2.15 Testpad
- 11.2.15.1. Overview
- 11.2.15.2. Products
- 11.2.15.3. SWOT Analysis
- 11.2.15.4. Recent Developments
- 11.2.15.5. Financials (Based on Availability)
- 11.2.16 JunoOne
- 11.2.16.1. Overview
- 11.2.16.2. Products
- 11.2.16.3. SWOT Analysis
- 11.2.16.4. Recent Developments
- 11.2.16.5. Financials (Based on Availability)
- 11.2.17 ReQtest
- 11.2.17.1. Overview
- 11.2.17.2. Products
- 11.2.17.3. SWOT Analysis
- 11.2.17.4. Recent Developments
- 11.2.17.5. Financials (Based on Availability)
- 11.2.1 qTest
List of Figures
- Figure 1: Global Functional and Testing Tools Revenue Breakdown (million, %) by Region 2024 & 2032
- Figure 2: North America Functional and Testing Tools Revenue (million), by Application 2024 & 2032
- Figure 3: North America Functional and Testing Tools Revenue Share (%), by Application 2024 & 2032
- Figure 4: North America Functional and Testing Tools Revenue (million), by Types 2024 & 2032
- Figure 5: North America Functional and Testing Tools Revenue Share (%), by Types 2024 & 2032
- Figure 6: North America Functional and Testing Tools Revenue (million), by Country 2024 & 2032
- Figure 7: North America Functional and Testing Tools Revenue Share (%), by Country 2024 & 2032
- Figure 8: South America Functional and Testing Tools Revenue (million), by Application 2024 & 2032
- Figure 9: South America Functional and Testing Tools Revenue Share (%), by Application 2024 & 2032
- Figure 10: South America Functional and Testing Tools Revenue (million), by Types 2024 & 2032
- Figure 11: South America Functional and Testing Tools Revenue Share (%), by Types 2024 & 2032
- Figure 12: South America Functional and Testing Tools Revenue (million), by Country 2024 & 2032
- Figure 13: South America Functional and Testing Tools Revenue Share (%), by Country 2024 & 2032
- Figure 14: Europe Functional and Testing Tools Revenue (million), by Application 2024 & 2032
- Figure 15: Europe Functional and Testing Tools Revenue Share (%), by Application 2024 & 2032
- Figure 16: Europe Functional and Testing Tools Revenue (million), by Types 2024 & 2032
- Figure 17: Europe Functional and Testing Tools Revenue Share (%), by Types 2024 & 2032
- Figure 18: Europe Functional and Testing Tools Revenue (million), by Country 2024 & 2032
- Figure 19: Europe Functional and Testing Tools Revenue Share (%), by Country 2024 & 2032
- Figure 20: Middle East & Africa Functional and Testing Tools Revenue (million), by Application 2024 & 2032
- Figure 21: Middle East & Africa Functional and Testing Tools Revenue Share (%), by Application 2024 & 2032
- Figure 22: Middle East & Africa Functional and Testing Tools Revenue (million), by Types 2024 & 2032
- Figure 23: Middle East & Africa Functional and Testing Tools Revenue Share (%), by Types 2024 & 2032
- Figure 24: Middle East & Africa Functional and Testing Tools Revenue (million), by Country 2024 & 2032
- Figure 25: Middle East & Africa Functional and Testing Tools Revenue Share (%), by Country 2024 & 2032
- Figure 26: Asia Pacific Functional and Testing Tools Revenue (million), by Application 2024 & 2032
- Figure 27: Asia Pacific Functional and Testing Tools Revenue Share (%), by Application 2024 & 2032
- Figure 28: Asia Pacific Functional and Testing Tools Revenue (million), by Types 2024 & 2032
- Figure 29: Asia Pacific Functional and Testing Tools Revenue Share (%), by Types 2024 & 2032
- Figure 30: Asia Pacific Functional and Testing Tools Revenue (million), by Country 2024 & 2032
- Figure 31: Asia Pacific Functional and Testing Tools Revenue Share (%), by Country 2024 & 2032
List of Tables
- Table 1: Global Functional and Testing Tools Revenue million Forecast, by Region 2019 & 2032
- Table 2: Global Functional and Testing Tools Revenue million Forecast, by Application 2019 & 2032
- Table 3: Global Functional and Testing Tools Revenue million Forecast, by Types 2019 & 2032
- Table 4: Global Functional and Testing Tools Revenue million Forecast, by Region 2019 & 2032
- Table 5: Global Functional and Testing Tools Revenue million Forecast, by Application 2019 & 2032
- Table 6: Global Functional and Testing Tools Revenue million Forecast, by Types 2019 & 2032
- Table 7: Global Functional and Testing Tools Revenue million Forecast, by Country 2019 & 2032
- Table 8: United States Functional and Testing Tools Revenue (million) Forecast, by Application 2019 & 2032
- Table 9: Canada Functional and Testing Tools Revenue (million) Forecast, by Application 2019 & 2032
- Table 10: Mexico Functional and Testing Tools Revenue (million) Forecast, by Application 2019 & 2032
- Table 11: Global Functional and Testing Tools Revenue million Forecast, by Application 2019 & 2032
- Table 12: Global Functional and Testing Tools Revenue million Forecast, by Types 2019 & 2032
- Table 13: Global Functional and Testing Tools Revenue million Forecast, by Country 2019 & 2032
- Table 14: Brazil Functional and Testing Tools Revenue (million) Forecast, by Application 2019 & 2032
- Table 15: Argentina Functional and Testing Tools Revenue (million) Forecast, by Application 2019 & 2032
- Table 16: Rest of South America Functional and Testing Tools Revenue (million) Forecast, by Application 2019 & 2032
- Table 17: Global Functional and Testing Tools Revenue million Forecast, by Application 2019 & 2032
- Table 18: Global Functional and Testing Tools Revenue million Forecast, by Types 2019 & 2032
- Table 19: Global Functional and Testing Tools Revenue million Forecast, by Country 2019 & 2032
- Table 20: United Kingdom Functional and Testing Tools Revenue (million) Forecast, by Application 2019 & 2032
- Table 21: Germany Functional and Testing Tools Revenue (million) Forecast, by Application 2019 & 2032
- Table 22: France Functional and Testing Tools Revenue (million) Forecast, by Application 2019 & 2032
- Table 23: Italy Functional and Testing Tools Revenue (million) Forecast, by Application 2019 & 2032
- Table 24: Spain Functional and Testing Tools Revenue (million) Forecast, by Application 2019 & 2032
- Table 25: Russia Functional and Testing Tools Revenue (million) Forecast, by Application 2019 & 2032
- Table 26: Benelux Functional and Testing Tools Revenue (million) Forecast, by Application 2019 & 2032
- Table 27: Nordics Functional and Testing Tools Revenue (million) Forecast, by Application 2019 & 2032
- Table 28: Rest of Europe Functional and Testing Tools Revenue (million) Forecast, by Application 2019 & 2032
- Table 29: Global Functional and Testing Tools Revenue million Forecast, by Application 2019 & 2032
- Table 30: Global Functional and Testing Tools Revenue million Forecast, by Types 2019 & 2032
- Table 31: Global Functional and Testing Tools Revenue million Forecast, by Country 2019 & 2032
- Table 32: Turkey Functional and Testing Tools Revenue (million) Forecast, by Application 2019 & 2032
- Table 33: Israel Functional and Testing Tools Revenue (million) Forecast, by Application 2019 & 2032
- Table 34: GCC Functional and Testing Tools Revenue (million) Forecast, by Application 2019 & 2032
- Table 35: North Africa Functional and Testing Tools Revenue (million) Forecast, by Application 2019 & 2032
- Table 36: South Africa Functional and Testing Tools Revenue (million) Forecast, by Application 2019 & 2032
- Table 37: Rest of Middle East & Africa Functional and Testing Tools Revenue (million) Forecast, by Application 2019 & 2032
- Table 38: Global Functional and Testing Tools Revenue million Forecast, by Application 2019 & 2032
- Table 39: Global Functional and Testing Tools Revenue million Forecast, by Types 2019 & 2032
- Table 40: Global Functional and Testing Tools Revenue million Forecast, by Country 2019 & 2032
- Table 41: China Functional and Testing Tools Revenue (million) Forecast, by Application 2019 & 2032
- Table 42: India Functional and Testing Tools Revenue (million) Forecast, by Application 2019 & 2032
- Table 43: Japan Functional and Testing Tools Revenue (million) Forecast, by Application 2019 & 2032
- Table 44: South Korea Functional and Testing Tools Revenue (million) Forecast, by Application 2019 & 2032
- Table 45: ASEAN Functional and Testing Tools Revenue (million) Forecast, by Application 2019 & 2032
- Table 46: Oceania Functional and Testing Tools Revenue (million) Forecast, by Application 2019 & 2032
- Table 47: Rest of Asia Pacific Functional and Testing Tools Revenue (million) Forecast, by Application 2019 & 2032
Frequently Asked Questions
1. What is the projected Compound Annual Growth Rate (CAGR) of the Functional and Testing Tools?
The projected CAGR is approximately XX%.
2. Which companies are prominent players in the Functional and Testing Tools?
Key companies in the market include qTest, PractiTest, Zephyr, Test Collab, TestFLO for JIRA, XQual, TestCaseLab, Adaptavist, QACoverage, Plutora Test, Inflectra, Meliora Testlab, aqua, Panaya, Testpad, JunoOne, ReQtest.
3. What are the main segments of the Functional and Testing Tools?
The market segments include Application, Types.
4. Can you provide details about the market size?
The market size is estimated to be USD XXX million as of 2022.
5. What are some drivers contributing to market growth?
N/A
6. What are the notable trends driving market growth?
N/A
7. Are there any restraints impacting market growth?
N/A
8. Can you provide examples of recent developments in the market?
N/A
9. What pricing options are available for accessing the report?
Pricing options include single-user, multi-user, and enterprise licenses priced at USD 3350.00, USD 5025.00, and USD 6700.00 respectively.
10. Is the market size provided in terms of value or volume?
The market size is provided in terms of value, measured in million.
11. Are there any specific market keywords associated with the report?
Yes, the market keyword associated with the report is "Functional and Testing Tools," which aids in identifying and referencing the specific market segment covered.
12. How do I determine which pricing option suits my needs best?
The pricing options vary based on user requirements and access needs. Individual users may opt for single-user licenses, while businesses requiring broader access may choose multi-user or enterprise licenses for cost-effective access to the report.
13. Are there any additional resources or data provided in the Functional and Testing Tools report?
While the report offers comprehensive insights, it's advisable to review the specific contents or supplementary materials provided to ascertain if additional resources or data are available.
14. How can I stay updated on further developments or reports in the Functional and Testing Tools?
To stay informed about further developments, trends, and reports in the Functional and Testing Tools, consider subscribing to industry newsletters, following relevant companies and organizations, or regularly checking reputable industry news sources and publications.
Methodology
Step 1 - Identification of Relevant Samples Size from Population Database


Step 2 - Approaches for Defining Global Market Size (Value, Volume* & Price*)

Note*: In applicable scenarios
Step 3 - Data Sources
Primary Research
- Web Analytics
- Survey Reports
- Research Institute
- Latest Research Reports
- Opinion Leaders
Secondary Research
- Annual Reports
- White Paper
- Latest Press Release
- Industry Association
- Paid Database
- Investor Presentations

Step 4 - Data Triangulation
Involves using different sources of information in order to increase the validity of a study
These sources are likely to be stakeholders in a program - participants, other researchers, program staff, other community members, and so on.
Then we put all data in single framework & apply various statistical tools to find out the dynamic on the market.
During the analysis stage, feedback from the stakeholder groups would be compared to determine areas of agreement as well as areas of divergence


