
Key Insights
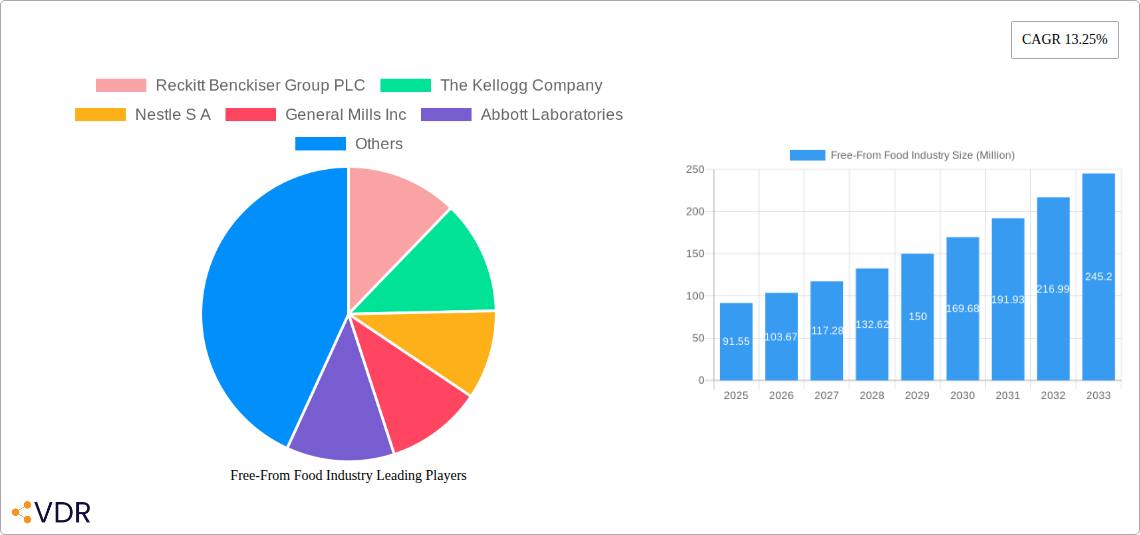
The free-from food industry, valued at $91.55 million in 2025, is experiencing robust growth, projected to expand at a compound annual growth rate (CAGR) of 13.25% from 2025 to 2033. This surge is driven by several key factors. Rising prevalence of food allergies and intolerances, particularly among children, is a primary driver, fueling demand for products free from gluten, dairy, and other common allergens. Increasing consumer awareness of health and wellness, coupled with a growing preference for plant-based diets, further propels market expansion. The rise of e-commerce also significantly contributes, providing convenient access to specialized free-from products for consumers across diverse geographic locations. While supply chain challenges and fluctuating raw material prices pose some restraints, the long-term outlook remains positive, with significant growth potential across various segments. The baby food segment is a key contributor, driven by parental concerns about infant health, while the meat substitute market is experiencing rapid expansion due to the growing popularity of vegetarian and vegan lifestyles. Supermarkets and hypermarkets remain dominant distribution channels, though online retail is witnessing considerable growth.
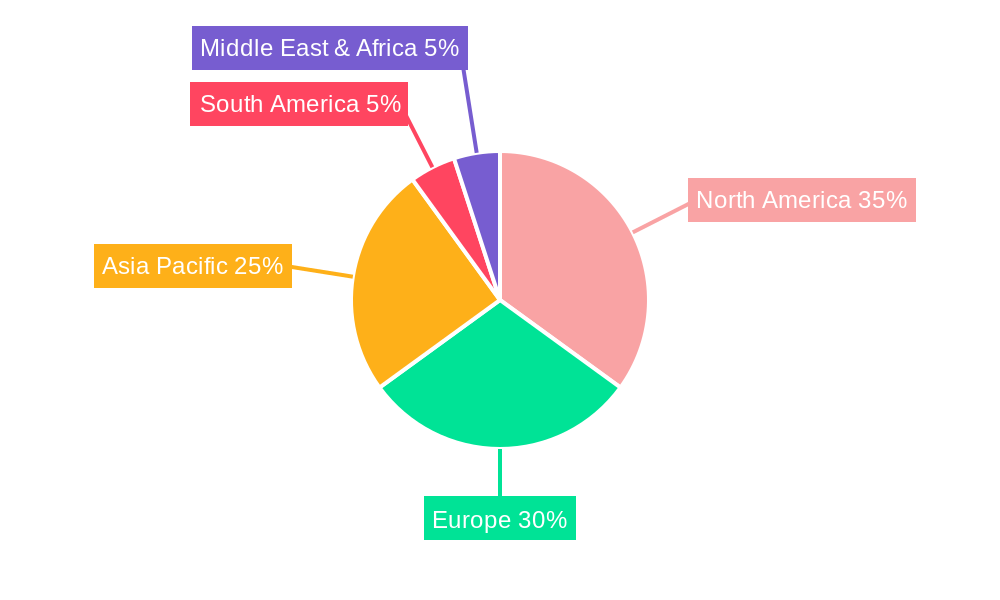
Geographical distribution reveals a strong presence across North America and Europe, with significant emerging markets in the Asia-Pacific region. India and China, with their large populations and growing middle class, present substantial opportunities for future growth. Key players like Reckitt Benckiser, Kellogg's, Nestlé, and Abbott Laboratories are actively shaping the market landscape through product innovation, strategic acquisitions, and expansion into new markets. This competitive landscape is further intensified by the increasing entry of smaller, specialized free-from food companies focusing on niche products and catering to specific dietary needs. The continued focus on product diversification, meeting evolving consumer preferences, and leveraging technological advancements in food processing will be crucial for success in this dynamic market.
Free-From Food Industry Market Report: 2019-2033
This comprehensive report provides a detailed analysis of the Free-From Food industry, encompassing market dynamics, growth trends, regional insights, and competitive landscapes. Covering the period 2019-2033, with a base year of 2025, this report is an invaluable resource for industry professionals, investors, and strategists seeking to navigate this rapidly evolving sector. The report leverages extensive market research, utilizing both quantitative and qualitative data to deliver actionable insights.
Parent Market: Food and Beverage Industry (Market size: xx Million) Child Market: Free-From Food Industry (Market size in 2025 estimated at xx Million)
Free-From Food Industry Market Dynamics & Structure
The Free-From food market is characterized by a moderately fragmented structure, with several key players vying for market share. Reckitt Benckiser Group PLC, The Kellogg Company, Nestlé S.A., General Mills Inc., Abbott Laboratories, Dr. Schar AG/SPA, Danone SA, Blue Diamond Growers, Beyond Meat, and Oatly Group AB are some of the major players, but the landscape includes numerous smaller, niche players, especially in the organic and specialty segments. Technological innovation is a significant driver, with companies constantly seeking to improve product taste, texture, and nutritional value. Stringent regulatory frameworks governing food safety and labeling influence product development and marketing strategies. The rise of veganism, vegetarianism, and increased awareness of allergies and intolerances fuels market expansion. However, challenges remain, including maintaining consistent product quality, managing fluctuating raw material costs, and addressing consumer skepticism regarding taste and texture compared to traditional food products. M&A activity has been moderate, with larger companies acquiring smaller players to expand their product portfolios and market reach. We estimate that approximately xx M&A deals occurred between 2019 and 2024.
- Market Concentration: Moderately fragmented, with a few dominant players and numerous smaller niche players.
- Technological Innovation: Focus on improving taste, texture, and nutritional content, utilizing alternative protein sources and processing techniques.
- Regulatory Frameworks: Stringent regulations impacting labeling, food safety, and claims (e.g., "organic," "gluten-free").
- Competitive Product Substitutes: Traditional food products pose a constant competitive threat.
- End-User Demographics: Growth driven by increasing health consciousness, dietary restrictions, and rising prevalence of allergies and intolerances.
- M&A Trends: Moderate M&A activity, with larger players acquiring smaller companies to expand their market reach and product portfolios (xx deals estimated between 2019 and 2024).
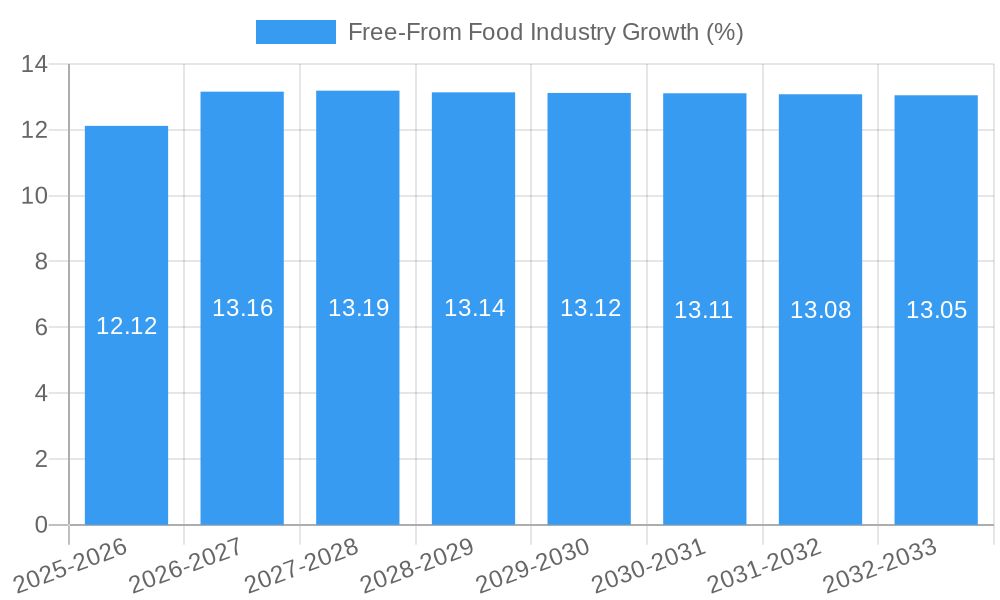
Free-From Food Industry Growth Trends & Insights
The Free-From food market has experienced significant growth over the past few years, driven by changing consumer preferences and increasing health awareness. The market size has grown from xx million in 2019 to an estimated xx million in 2025, with a projected Compound Annual Growth Rate (CAGR) of xx% during the forecast period (2025-2033). This growth is fueled by rising demand for dairy-free, gluten-free, and meat-free products, driven by factors such as lactose intolerance, celiac disease, and ethical concerns surrounding meat consumption. Technological advancements in plant-based protein production and alternative ingredient development have been instrumental in improving the quality and appeal of free-from products. Consumer behavior shifts towards healthier and more sustainable food choices further contribute to this growth. Market penetration of free-from products is increasing, particularly in developed economies, although significant untapped potential remains in emerging markets.
Dominant Regions, Countries, or Segments in Free-From Food Industry
North America and Europe currently dominate the Free-From food market, driven by high consumer awareness, robust regulatory frameworks, and strong distribution networks. Within these regions, the dairy-free segment is experiencing particularly rapid growth, followed by gluten-free and meat-free alternatives. Supermarkets/hypermarkets remain the dominant distribution channel, followed by online retail, which is rapidly expanding.
- Leading Region: North America
- Leading Segment (End Product): Dairy-free Foods
- Leading Segment (Distribution Channel): Supermarkets/Hypermarkets
- Leading Segment (Type): Dairy-Free
- Key Drivers: High consumer awareness of allergies and intolerances, rising health consciousness, and robust retail infrastructure.
Free-From Food Industry Product Landscape
Product innovation is a key driver within the Free-From food market. Companies are constantly developing new products with improved taste, texture, and nutritional profiles. This includes utilizing innovative ingredients, such as pea protein, oat milk, and alternative meat sources, to create more appealing and nutritious alternatives to traditional food items. Companies are also focusing on expanding product lines to cater to diverse consumer needs and preferences, including organic and ethically sourced free-from options. Unique selling propositions often center on superior taste, texture, and nutritional value, coupled with ethical and sustainable sourcing. Technological advancements in processing and preservation techniques are enabling manufacturers to improve product shelf life and quality.
Key Drivers, Barriers & Challenges in Free-From Food Industry
Key Drivers:
- Rising prevalence of food allergies and intolerances.
- Increasing health and wellness consciousness among consumers.
- Growing adoption of plant-based diets.
- Technological advancements in alternative protein sources.
- Favorable government regulations promoting healthier food options.
Key Challenges:
- Maintaining consistent product quality and taste comparable to traditional products.
- Fluctuating raw material costs and supply chain disruptions.
- Meeting stringent regulatory requirements and labeling standards.
- Competition from traditional food manufacturers and established brands. The price differential between free-from and conventional products represents a barrier to entry for many consumers.
Emerging Opportunities in Free-From Food Industry
- Expansion into emerging markets with growing middle classes and increasing health awareness.
- Development of innovative free-from products with improved taste, texture, and nutritional profiles.
- Customization of products to cater to diverse dietary needs and preferences.
- Collaboration with food retailers and online platforms to enhance product accessibility.
- Leveraging technology to improve production efficiency and sustainability.
Growth Accelerators in the Free-From Food Industry Industry
Continued innovation in alternative protein sources, such as lab-grown meat and advanced plant-based proteins, will drive significant growth. Strategic partnerships between food manufacturers, ingredient suppliers, and technology companies will accelerate product development and market penetration. Expansion into new geographical markets and product categories, such as free-from snacks and ready meals, will unlock further growth potential.
Key Players Shaping the Free-From Food Industry Market
- Reckitt Benckiser Group PLC
- The Kellogg Company
- Nestle S.A.
- General Mills Inc.
- Abbott Laboratories
- Dr Schar AG / SPA
- Danone SA
- Blue Diamond Growers
- Beyond Meat
- Oatly Group AB
- List Not Exhaustive
Notable Milestones in Free-From Food Industry Sector
- November 2022: Beyond Meat launched plant-based chicken products, expanding its product portfolio and market reach.
- May 2022: Danone expanded its Canadian dairy-free portfolio with the launch of Silk Nextmilk, strengthening its position in the dairy-free segment.
- January 2022: Mondelez International launched a Philadelphia vegan cream cheese alternative, capitalizing on the growing demand for plant-based dairy alternatives.
In-Depth Free-From Food Industry Market Outlook
The Free-From food market is poised for sustained growth, driven by the continued expansion of the plant-based market and rising consumer awareness. The development of innovative products, strategic partnerships, and increased market penetration in emerging economies will create substantial opportunities for growth. The industry will likely witness consolidation, with larger players acquiring smaller companies to enhance their product portfolios and market share. Continued technological advancements will play a pivotal role in improving the quality, taste, and affordability of free-from products, ensuring continued growth and market expansion in the years to come.
Free-From Food Industry Segmentation
-
1. Type
- 1.1. Gluten-free
- 1.2. Dairy-Free
- 1.3. Meat-Free
- 1.4. Other Types
-
2. End Product
- 2.1. Baby Food
- 2.2. Dairy-free Foods
- 2.3. Meat Substitutes
- 2.4. Beverages
- 2.5. Other End Products
-
3. Distribution Channel
- 3.1. Supermarkets/Hypermarkets
- 3.2. Online Retail Stores
- 3.3. Convenience Stores
- 3.4. Other Distribution Channels
Free-From Food Industry Segmentation By Geography
-
1. North America
- 1.1. United States
- 1.2. Canada
- 1.3. Mexico
- 1.4. Rest of North America
-
2. Europe
- 2.1. United Kingdom
- 2.2. France
- 2.3. Germany
- 2.4. Italy
- 2.5. Spain
- 2.6. Russia
- 2.7. Rest of Europe
-
3. Asia Pacific
- 3.1. China
- 3.2. Japan
- 3.3. Australia
- 3.4. India
- 3.5. Rest of Asia Pacific
-
4. South America
- 4.1. Brazil
- 4.2. Argentina
- 4.3. Rest of South America
- 5. Middle East
-
6. United Arab Emirates
- 6.1. South Africa
- 6.2. Rest of Middle East
Free-From Food Industry REPORT HIGHLIGHTS
| Aspects | Details |
|---|---|
| Study Period | 2019-2033 |
| Base Year | 2024 |
| Estimated Year | 2025 |
| Forecast Period | 2025-2033 |
| Historical Period | 2019-2024 |
| Growth Rate | CAGR of 13.25% from 2019-2033 |
| Segmentation |
|
Table of Contents
- 1. Introduction
- 1.1. Research Scope
- 1.2. Market Segmentation
- 1.3. Research Methodology
- 1.4. Definitions and Assumptions
- 2. Executive Summary
- 2.1. Introduction
- 3. Market Dynamics
- 3.1. Introduction
- 3.2. Market Drivers
- 3.2.1. Increasing Health Concerns are Supporting the Market's Growth; Growing Consumer Preference for Convenience Seafood
- 3.3. Market Restrains
- 3.3.1. Rising Concern About Quality and Safety Standards of Canned Tuna
- 3.4. Market Trends
- 3.4.1. Clean Label Product Development and Associated Labeling Compliance
- 4. Market Factor Analysis
- 4.1. Porters Five Forces
- 4.2. Supply/Value Chain
- 4.3. PESTEL analysis
- 4.4. Market Entropy
- 4.5. Patent/Trademark Analysis
- 5. Global Free-From Food Industry Analysis, Insights and Forecast, 2019-2031
- 5.1. Market Analysis, Insights and Forecast - by Type
- 5.1.1. Gluten-free
- 5.1.2. Dairy-Free
- 5.1.3. Meat-Free
- 5.1.4. Other Types
- 5.2. Market Analysis, Insights and Forecast - by End Product
- 5.2.1. Baby Food
- 5.2.2. Dairy-free Foods
- 5.2.3. Meat Substitutes
- 5.2.4. Beverages
- 5.2.5. Other End Products
- 5.3. Market Analysis, Insights and Forecast - by Distribution Channel
- 5.3.1. Supermarkets/Hypermarkets
- 5.3.2. Online Retail Stores
- 5.3.3. Convenience Stores
- 5.3.4. Other Distribution Channels
- 5.4. Market Analysis, Insights and Forecast - by Region
- 5.4.1. North America
- 5.4.2. Europe
- 5.4.3. Asia Pacific
- 5.4.4. South America
- 5.4.5. Middle East
- 5.4.6. United Arab Emirates
- 5.1. Market Analysis, Insights and Forecast - by Type
- 6. North America Free-From Food Industry Analysis, Insights and Forecast, 2019-2031
- 6.1. Market Analysis, Insights and Forecast - by Type
- 6.1.1. Gluten-free
- 6.1.2. Dairy-Free
- 6.1.3. Meat-Free
- 6.1.4. Other Types
- 6.2. Market Analysis, Insights and Forecast - by End Product
- 6.2.1. Baby Food
- 6.2.2. Dairy-free Foods
- 6.2.3. Meat Substitutes
- 6.2.4. Beverages
- 6.2.5. Other End Products
- 6.3. Market Analysis, Insights and Forecast - by Distribution Channel
- 6.3.1. Supermarkets/Hypermarkets
- 6.3.2. Online Retail Stores
- 6.3.3. Convenience Stores
- 6.3.4. Other Distribution Channels
- 6.1. Market Analysis, Insights and Forecast - by Type
- 7. Europe Free-From Food Industry Analysis, Insights and Forecast, 2019-2031
- 7.1. Market Analysis, Insights and Forecast - by Type
- 7.1.1. Gluten-free
- 7.1.2. Dairy-Free
- 7.1.3. Meat-Free
- 7.1.4. Other Types
- 7.2. Market Analysis, Insights and Forecast - by End Product
- 7.2.1. Baby Food
- 7.2.2. Dairy-free Foods
- 7.2.3. Meat Substitutes
- 7.2.4. Beverages
- 7.2.5. Other End Products
- 7.3. Market Analysis, Insights and Forecast - by Distribution Channel
- 7.3.1. Supermarkets/Hypermarkets
- 7.3.2. Online Retail Stores
- 7.3.3. Convenience Stores
- 7.3.4. Other Distribution Channels
- 7.1. Market Analysis, Insights and Forecast - by Type
- 8. Asia Pacific Free-From Food Industry Analysis, Insights and Forecast, 2019-2031
- 8.1. Market Analysis, Insights and Forecast - by Type
- 8.1.1. Gluten-free
- 8.1.2. Dairy-Free
- 8.1.3. Meat-Free
- 8.1.4. Other Types
- 8.2. Market Analysis, Insights and Forecast - by End Product
- 8.2.1. Baby Food
- 8.2.2. Dairy-free Foods
- 8.2.3. Meat Substitutes
- 8.2.4. Beverages
- 8.2.5. Other End Products
- 8.3. Market Analysis, Insights and Forecast - by Distribution Channel
- 8.3.1. Supermarkets/Hypermarkets
- 8.3.2. Online Retail Stores
- 8.3.3. Convenience Stores
- 8.3.4. Other Distribution Channels
- 8.1. Market Analysis, Insights and Forecast - by Type
- 9. South America Free-From Food Industry Analysis, Insights and Forecast, 2019-2031
- 9.1. Market Analysis, Insights and Forecast - by Type
- 9.1.1. Gluten-free
- 9.1.2. Dairy-Free
- 9.1.3. Meat-Free
- 9.1.4. Other Types
- 9.2. Market Analysis, Insights and Forecast - by End Product
- 9.2.1. Baby Food
- 9.2.2. Dairy-free Foods
- 9.2.3. Meat Substitutes
- 9.2.4. Beverages
- 9.2.5. Other End Products
- 9.3. Market Analysis, Insights and Forecast - by Distribution Channel
- 9.3.1. Supermarkets/Hypermarkets
- 9.3.2. Online Retail Stores
- 9.3.3. Convenience Stores
- 9.3.4. Other Distribution Channels
- 9.1. Market Analysis, Insights and Forecast - by Type
- 10. Middle East Free-From Food Industry Analysis, Insights and Forecast, 2019-2031
- 10.1. Market Analysis, Insights and Forecast - by Type
- 10.1.1. Gluten-free
- 10.1.2. Dairy-Free
- 10.1.3. Meat-Free
- 10.1.4. Other Types
- 10.2. Market Analysis, Insights and Forecast - by End Product
- 10.2.1. Baby Food
- 10.2.2. Dairy-free Foods
- 10.2.3. Meat Substitutes
- 10.2.4. Beverages
- 10.2.5. Other End Products
- 10.3. Market Analysis, Insights and Forecast - by Distribution Channel
- 10.3.1. Supermarkets/Hypermarkets
- 10.3.2. Online Retail Stores
- 10.3.3. Convenience Stores
- 10.3.4. Other Distribution Channels
- 10.1. Market Analysis, Insights and Forecast - by Type
- 11. United Arab Emirates Free-From Food Industry Analysis, Insights and Forecast, 2019-2031
- 11.1. Market Analysis, Insights and Forecast - by Type
- 11.1.1. Gluten-free
- 11.1.2. Dairy-Free
- 11.1.3. Meat-Free
- 11.1.4. Other Types
- 11.2. Market Analysis, Insights and Forecast - by End Product
- 11.2.1. Baby Food
- 11.2.2. Dairy-free Foods
- 11.2.3. Meat Substitutes
- 11.2.4. Beverages
- 11.2.5. Other End Products
- 11.3. Market Analysis, Insights and Forecast - by Distribution Channel
- 11.3.1. Supermarkets/Hypermarkets
- 11.3.2. Online Retail Stores
- 11.3.3. Convenience Stores
- 11.3.4. Other Distribution Channels
- 11.1. Market Analysis, Insights and Forecast - by Type
- 12. North America Free-From Food Industry Analysis, Insights and Forecast, 2019-2031
- 12.1. Market Analysis, Insights and Forecast - By Country/Sub-region
- 12.1.1 United States
- 12.1.2 Canada
- 12.1.3 Mexico
- 12.1.4 Rest of North America
- 13. Europe Free-From Food Industry Analysis, Insights and Forecast, 2019-2031
- 13.1. Market Analysis, Insights and Forecast - By Country/Sub-region
- 13.1.1 United Kingdom
- 13.1.2 France
- 13.1.3 Germany
- 13.1.4 Italy
- 13.1.5 Spain
- 13.1.6 Russia
- 13.1.7 Rest of Europe
- 14. Asia Pacific Free-From Food Industry Analysis, Insights and Forecast, 2019-2031
- 14.1. Market Analysis, Insights and Forecast - By Country/Sub-region
- 14.1.1 China
- 14.1.2 Japan
- 14.1.3 Australia
- 14.1.4 India
- 14.1.5 Rest of Asia Pacific
- 15. South America Free-From Food Industry Analysis, Insights and Forecast, 2019-2031
- 15.1. Market Analysis, Insights and Forecast - By Country/Sub-region
- 15.1.1 Brazil
- 15.1.2 Argentina
- 15.1.3 Rest of South America
- 16. Middle East Free-From Food Industry Analysis, Insights and Forecast, 2019-2031
- 16.1. Market Analysis, Insights and Forecast - By Country/Sub-region
- 16.1.1.
- 17. United Arab Emirates Free-From Food Industry Analysis, Insights and Forecast, 2019-2031
- 17.1. Market Analysis, Insights and Forecast - By Country/Sub-region
- 17.1.1 South Africa
- 17.1.2 Rest of Middle East
- 18. Competitive Analysis
- 18.1. Global Market Share Analysis 2024
- 18.2. Company Profiles
- 18.2.1 Reckitt Benckiser Group PLC
- 18.2.1.1. Overview
- 18.2.1.2. Products
- 18.2.1.3. SWOT Analysis
- 18.2.1.4. Recent Developments
- 18.2.1.5. Financials (Based on Availability)
- 18.2.2 The Kellogg Company
- 18.2.2.1. Overview
- 18.2.2.2. Products
- 18.2.2.3. SWOT Analysis
- 18.2.2.4. Recent Developments
- 18.2.2.5. Financials (Based on Availability)
- 18.2.3 Nestle S A
- 18.2.3.1. Overview
- 18.2.3.2. Products
- 18.2.3.3. SWOT Analysis
- 18.2.3.4. Recent Developments
- 18.2.3.5. Financials (Based on Availability)
- 18.2.4 General Mills Inc
- 18.2.4.1. Overview
- 18.2.4.2. Products
- 18.2.4.3. SWOT Analysis
- 18.2.4.4. Recent Developments
- 18.2.4.5. Financials (Based on Availability)
- 18.2.5 Abbott Laboratories
- 18.2.5.1. Overview
- 18.2.5.2. Products
- 18.2.5.3. SWOT Analysis
- 18.2.5.4. Recent Developments
- 18.2.5.5. Financials (Based on Availability)
- 18.2.6 Dr Schar AG / SPA
- 18.2.6.1. Overview
- 18.2.6.2. Products
- 18.2.6.3. SWOT Analysis
- 18.2.6.4. Recent Developments
- 18.2.6.5. Financials (Based on Availability)
- 18.2.7 Danone SA
- 18.2.7.1. Overview
- 18.2.7.2. Products
- 18.2.7.3. SWOT Analysis
- 18.2.7.4. Recent Developments
- 18.2.7.5. Financials (Based on Availability)
- 18.2.8 Blue Diamond Growers
- 18.2.8.1. Overview
- 18.2.8.2. Products
- 18.2.8.3. SWOT Analysis
- 18.2.8.4. Recent Developments
- 18.2.8.5. Financials (Based on Availability)
- 18.2.9 Beyond Meat
- 18.2.9.1. Overview
- 18.2.9.2. Products
- 18.2.9.3. SWOT Analysis
- 18.2.9.4. Recent Developments
- 18.2.9.5. Financials (Based on Availability)
- 18.2.10 Oatly Group AB*List Not Exhaustive
- 18.2.10.1. Overview
- 18.2.10.2. Products
- 18.2.10.3. SWOT Analysis
- 18.2.10.4. Recent Developments
- 18.2.10.5. Financials (Based on Availability)
- 18.2.1 Reckitt Benckiser Group PLC
List of Figures
- Figure 1: Global Free-From Food Industry Revenue Breakdown (Million, %) by Region 2024 & 2032
- Figure 2: North America Free-From Food Industry Revenue (Million), by Country 2024 & 2032
- Figure 3: North America Free-From Food Industry Revenue Share (%), by Country 2024 & 2032
- Figure 4: Europe Free-From Food Industry Revenue (Million), by Country 2024 & 2032
- Figure 5: Europe Free-From Food Industry Revenue Share (%), by Country 2024 & 2032
- Figure 6: Asia Pacific Free-From Food Industry Revenue (Million), by Country 2024 & 2032
- Figure 7: Asia Pacific Free-From Food Industry Revenue Share (%), by Country 2024 & 2032
- Figure 8: South America Free-From Food Industry Revenue (Million), by Country 2024 & 2032
- Figure 9: South America Free-From Food Industry Revenue Share (%), by Country 2024 & 2032
- Figure 10: Middle East Free-From Food Industry Revenue (Million), by Country 2024 & 2032
- Figure 11: Middle East Free-From Food Industry Revenue Share (%), by Country 2024 & 2032
- Figure 12: United Arab Emirates Free-From Food Industry Revenue (Million), by Country 2024 & 2032
- Figure 13: United Arab Emirates Free-From Food Industry Revenue Share (%), by Country 2024 & 2032
- Figure 14: North America Free-From Food Industry Revenue (Million), by Type 2024 & 2032
- Figure 15: North America Free-From Food Industry Revenue Share (%), by Type 2024 & 2032
- Figure 16: North America Free-From Food Industry Revenue (Million), by End Product 2024 & 2032
- Figure 17: North America Free-From Food Industry Revenue Share (%), by End Product 2024 & 2032
- Figure 18: North America Free-From Food Industry Revenue (Million), by Distribution Channel 2024 & 2032
- Figure 19: North America Free-From Food Industry Revenue Share (%), by Distribution Channel 2024 & 2032
- Figure 20: North America Free-From Food Industry Revenue (Million), by Country 2024 & 2032
- Figure 21: North America Free-From Food Industry Revenue Share (%), by Country 2024 & 2032
- Figure 22: Europe Free-From Food Industry Revenue (Million), by Type 2024 & 2032
- Figure 23: Europe Free-From Food Industry Revenue Share (%), by Type 2024 & 2032
- Figure 24: Europe Free-From Food Industry Revenue (Million), by End Product 2024 & 2032
- Figure 25: Europe Free-From Food Industry Revenue Share (%), by End Product 2024 & 2032
- Figure 26: Europe Free-From Food Industry Revenue (Million), by Distribution Channel 2024 & 2032
- Figure 27: Europe Free-From Food Industry Revenue Share (%), by Distribution Channel 2024 & 2032
- Figure 28: Europe Free-From Food Industry Revenue (Million), by Country 2024 & 2032
- Figure 29: Europe Free-From Food Industry Revenue Share (%), by Country 2024 & 2032
- Figure 30: Asia Pacific Free-From Food Industry Revenue (Million), by Type 2024 & 2032
- Figure 31: Asia Pacific Free-From Food Industry Revenue Share (%), by Type 2024 & 2032
- Figure 32: Asia Pacific Free-From Food Industry Revenue (Million), by End Product 2024 & 2032
- Figure 33: Asia Pacific Free-From Food Industry Revenue Share (%), by End Product 2024 & 2032
- Figure 34: Asia Pacific Free-From Food Industry Revenue (Million), by Distribution Channel 2024 & 2032
- Figure 35: Asia Pacific Free-From Food Industry Revenue Share (%), by Distribution Channel 2024 & 2032
- Figure 36: Asia Pacific Free-From Food Industry Revenue (Million), by Country 2024 & 2032
- Figure 37: Asia Pacific Free-From Food Industry Revenue Share (%), by Country 2024 & 2032
- Figure 38: South America Free-From Food Industry Revenue (Million), by Type 2024 & 2032
- Figure 39: South America Free-From Food Industry Revenue Share (%), by Type 2024 & 2032
- Figure 40: South America Free-From Food Industry Revenue (Million), by End Product 2024 & 2032
- Figure 41: South America Free-From Food Industry Revenue Share (%), by End Product 2024 & 2032
- Figure 42: South America Free-From Food Industry Revenue (Million), by Distribution Channel 2024 & 2032
- Figure 43: South America Free-From Food Industry Revenue Share (%), by Distribution Channel 2024 & 2032
- Figure 44: South America Free-From Food Industry Revenue (Million), by Country 2024 & 2032
- Figure 45: South America Free-From Food Industry Revenue Share (%), by Country 2024 & 2032
- Figure 46: Middle East Free-From Food Industry Revenue (Million), by Type 2024 & 2032
- Figure 47: Middle East Free-From Food Industry Revenue Share (%), by Type 2024 & 2032
- Figure 48: Middle East Free-From Food Industry Revenue (Million), by End Product 2024 & 2032
- Figure 49: Middle East Free-From Food Industry Revenue Share (%), by End Product 2024 & 2032
- Figure 50: Middle East Free-From Food Industry Revenue (Million), by Distribution Channel 2024 & 2032
- Figure 51: Middle East Free-From Food Industry Revenue Share (%), by Distribution Channel 2024 & 2032
- Figure 52: Middle East Free-From Food Industry Revenue (Million), by Country 2024 & 2032
- Figure 53: Middle East Free-From Food Industry Revenue Share (%), by Country 2024 & 2032
- Figure 54: United Arab Emirates Free-From Food Industry Revenue (Million), by Type 2024 & 2032
- Figure 55: United Arab Emirates Free-From Food Industry Revenue Share (%), by Type 2024 & 2032
- Figure 56: United Arab Emirates Free-From Food Industry Revenue (Million), by End Product 2024 & 2032
- Figure 57: United Arab Emirates Free-From Food Industry Revenue Share (%), by End Product 2024 & 2032
- Figure 58: United Arab Emirates Free-From Food Industry Revenue (Million), by Distribution Channel 2024 & 2032
- Figure 59: United Arab Emirates Free-From Food Industry Revenue Share (%), by Distribution Channel 2024 & 2032
- Figure 60: United Arab Emirates Free-From Food Industry Revenue (Million), by Country 2024 & 2032
- Figure 61: United Arab Emirates Free-From Food Industry Revenue Share (%), by Country 2024 & 2032
List of Tables
- Table 1: Global Free-From Food Industry Revenue Million Forecast, by Region 2019 & 2032
- Table 2: Global Free-From Food Industry Revenue Million Forecast, by Type 2019 & 2032
- Table 3: Global Free-From Food Industry Revenue Million Forecast, by End Product 2019 & 2032
- Table 4: Global Free-From Food Industry Revenue Million Forecast, by Distribution Channel 2019 & 2032
- Table 5: Global Free-From Food Industry Revenue Million Forecast, by Region 2019 & 2032
- Table 6: Global Free-From Food Industry Revenue Million Forecast, by Country 2019 & 2032
- Table 7: United States Free-From Food Industry Revenue (Million) Forecast, by Application 2019 & 2032
- Table 8: Canada Free-From Food Industry Revenue (Million) Forecast, by Application 2019 & 2032
- Table 9: Mexico Free-From Food Industry Revenue (Million) Forecast, by Application 2019 & 2032
- Table 10: Rest of North America Free-From Food Industry Revenue (Million) Forecast, by Application 2019 & 2032
- Table 11: Global Free-From Food Industry Revenue Million Forecast, by Country 2019 & 2032
- Table 12: United Kingdom Free-From Food Industry Revenue (Million) Forecast, by Application 2019 & 2032
- Table 13: France Free-From Food Industry Revenue (Million) Forecast, by Application 2019 & 2032
- Table 14: Germany Free-From Food Industry Revenue (Million) Forecast, by Application 2019 & 2032
- Table 15: Italy Free-From Food Industry Revenue (Million) Forecast, by Application 2019 & 2032
- Table 16: Spain Free-From Food Industry Revenue (Million) Forecast, by Application 2019 & 2032
- Table 17: Russia Free-From Food Industry Revenue (Million) Forecast, by Application 2019 & 2032
- Table 18: Rest of Europe Free-From Food Industry Revenue (Million) Forecast, by Application 2019 & 2032
- Table 19: Global Free-From Food Industry Revenue Million Forecast, by Country 2019 & 2032
- Table 20: China Free-From Food Industry Revenue (Million) Forecast, by Application 2019 & 2032
- Table 21: Japan Free-From Food Industry Revenue (Million) Forecast, by Application 2019 & 2032
- Table 22: Australia Free-From Food Industry Revenue (Million) Forecast, by Application 2019 & 2032
- Table 23: India Free-From Food Industry Revenue (Million) Forecast, by Application 2019 & 2032
- Table 24: Rest of Asia Pacific Free-From Food Industry Revenue (Million) Forecast, by Application 2019 & 2032
- Table 25: Global Free-From Food Industry Revenue Million Forecast, by Country 2019 & 2032
- Table 26: Brazil Free-From Food Industry Revenue (Million) Forecast, by Application 2019 & 2032
- Table 27: Argentina Free-From Food Industry Revenue (Million) Forecast, by Application 2019 & 2032
- Table 28: Rest of South America Free-From Food Industry Revenue (Million) Forecast, by Application 2019 & 2032
- Table 29: Global Free-From Food Industry Revenue Million Forecast, by Country 2019 & 2032
- Table 30: Free-From Food Industry Revenue (Million) Forecast, by Application 2019 & 2032
- Table 31: Global Free-From Food Industry Revenue Million Forecast, by Country 2019 & 2032
- Table 32: South Africa Free-From Food Industry Revenue (Million) Forecast, by Application 2019 & 2032
- Table 33: Rest of Middle East Free-From Food Industry Revenue (Million) Forecast, by Application 2019 & 2032
- Table 34: Global Free-From Food Industry Revenue Million Forecast, by Type 2019 & 2032
- Table 35: Global Free-From Food Industry Revenue Million Forecast, by End Product 2019 & 2032
- Table 36: Global Free-From Food Industry Revenue Million Forecast, by Distribution Channel 2019 & 2032
- Table 37: Global Free-From Food Industry Revenue Million Forecast, by Country 2019 & 2032
- Table 38: United States Free-From Food Industry Revenue (Million) Forecast, by Application 2019 & 2032
- Table 39: Canada Free-From Food Industry Revenue (Million) Forecast, by Application 2019 & 2032
- Table 40: Mexico Free-From Food Industry Revenue (Million) Forecast, by Application 2019 & 2032
- Table 41: Rest of North America Free-From Food Industry Revenue (Million) Forecast, by Application 2019 & 2032
- Table 42: Global Free-From Food Industry Revenue Million Forecast, by Type 2019 & 2032
- Table 43: Global Free-From Food Industry Revenue Million Forecast, by End Product 2019 & 2032
- Table 44: Global Free-From Food Industry Revenue Million Forecast, by Distribution Channel 2019 & 2032
- Table 45: Global Free-From Food Industry Revenue Million Forecast, by Country 2019 & 2032
- Table 46: United Kingdom Free-From Food Industry Revenue (Million) Forecast, by Application 2019 & 2032
- Table 47: France Free-From Food Industry Revenue (Million) Forecast, by Application 2019 & 2032
- Table 48: Germany Free-From Food Industry Revenue (Million) Forecast, by Application 2019 & 2032
- Table 49: Italy Free-From Food Industry Revenue (Million) Forecast, by Application 2019 & 2032
- Table 50: Spain Free-From Food Industry Revenue (Million) Forecast, by Application 2019 & 2032
- Table 51: Russia Free-From Food Industry Revenue (Million) Forecast, by Application 2019 & 2032
- Table 52: Rest of Europe Free-From Food Industry Revenue (Million) Forecast, by Application 2019 & 2032
- Table 53: Global Free-From Food Industry Revenue Million Forecast, by Type 2019 & 2032
- Table 54: Global Free-From Food Industry Revenue Million Forecast, by End Product 2019 & 2032
- Table 55: Global Free-From Food Industry Revenue Million Forecast, by Distribution Channel 2019 & 2032
- Table 56: Global Free-From Food Industry Revenue Million Forecast, by Country 2019 & 2032
- Table 57: China Free-From Food Industry Revenue (Million) Forecast, by Application 2019 & 2032
- Table 58: Japan Free-From Food Industry Revenue (Million) Forecast, by Application 2019 & 2032
- Table 59: Australia Free-From Food Industry Revenue (Million) Forecast, by Application 2019 & 2032
- Table 60: India Free-From Food Industry Revenue (Million) Forecast, by Application 2019 & 2032
- Table 61: Rest of Asia Pacific Free-From Food Industry Revenue (Million) Forecast, by Application 2019 & 2032
- Table 62: Global Free-From Food Industry Revenue Million Forecast, by Type 2019 & 2032
- Table 63: Global Free-From Food Industry Revenue Million Forecast, by End Product 2019 & 2032
- Table 64: Global Free-From Food Industry Revenue Million Forecast, by Distribution Channel 2019 & 2032
- Table 65: Global Free-From Food Industry Revenue Million Forecast, by Country 2019 & 2032
- Table 66: Brazil Free-From Food Industry Revenue (Million) Forecast, by Application 2019 & 2032
- Table 67: Argentina Free-From Food Industry Revenue (Million) Forecast, by Application 2019 & 2032
- Table 68: Rest of South America Free-From Food Industry Revenue (Million) Forecast, by Application 2019 & 2032
- Table 69: Global Free-From Food Industry Revenue Million Forecast, by Type 2019 & 2032
- Table 70: Global Free-From Food Industry Revenue Million Forecast, by End Product 2019 & 2032
- Table 71: Global Free-From Food Industry Revenue Million Forecast, by Distribution Channel 2019 & 2032
- Table 72: Global Free-From Food Industry Revenue Million Forecast, by Country 2019 & 2032
- Table 73: Global Free-From Food Industry Revenue Million Forecast, by Type 2019 & 2032
- Table 74: Global Free-From Food Industry Revenue Million Forecast, by End Product 2019 & 2032
- Table 75: Global Free-From Food Industry Revenue Million Forecast, by Distribution Channel 2019 & 2032
- Table 76: Global Free-From Food Industry Revenue Million Forecast, by Country 2019 & 2032
- Table 77: South Africa Free-From Food Industry Revenue (Million) Forecast, by Application 2019 & 2032
- Table 78: Rest of Middle East Free-From Food Industry Revenue (Million) Forecast, by Application 2019 & 2032
Frequently Asked Questions
1. What is the projected Compound Annual Growth Rate (CAGR) of the Free-From Food Industry?
The projected CAGR is approximately 13.25%.
2. Which companies are prominent players in the Free-From Food Industry?
Key companies in the market include Reckitt Benckiser Group PLC, The Kellogg Company, Nestle S A, General Mills Inc, Abbott Laboratories, Dr Schar AG / SPA, Danone SA, Blue Diamond Growers, Beyond Meat, Oatly Group AB*List Not Exhaustive.
3. What are the main segments of the Free-From Food Industry?
The market segments include Type, End Product, Distribution Channel.
4. Can you provide details about the market size?
The market size is estimated to be USD 91.55 Million as of 2022.
5. What are some drivers contributing to market growth?
Increasing Health Concerns are Supporting the Market's Growth; Growing Consumer Preference for Convenience Seafood.
6. What are the notable trends driving market growth?
Clean Label Product Development and Associated Labeling Compliance.
7. Are there any restraints impacting market growth?
Rising Concern About Quality and Safety Standards of Canned Tuna.
8. Can you provide examples of recent developments in the market?
November 2022: Beyond Meat launched plant-based chicken products, including Beyond Chicken Nuggets and Beyond Popcorn Chicken. The company claims that the product contains 14 g of plant-based protein derived from a blend of pea and faba beans, 0% cholesterol, 50% less saturated fat, and no added soy, hormones, or antibiotics. The product was made available at more than 5,000 Kroger and Walmart stores in the United States.
9. What pricing options are available for accessing the report?
Pricing options include single-user, multi-user, and enterprise licenses priced at USD 4750, USD 5250, and USD 8750 respectively.
10. Is the market size provided in terms of value or volume?
The market size is provided in terms of value, measured in Million.
11. Are there any specific market keywords associated with the report?
Yes, the market keyword associated with the report is "Free-From Food Industry," which aids in identifying and referencing the specific market segment covered.
12. How do I determine which pricing option suits my needs best?
The pricing options vary based on user requirements and access needs. Individual users may opt for single-user licenses, while businesses requiring broader access may choose multi-user or enterprise licenses for cost-effective access to the report.
13. Are there any additional resources or data provided in the Free-From Food Industry report?
While the report offers comprehensive insights, it's advisable to review the specific contents or supplementary materials provided to ascertain if additional resources or data are available.
14. How can I stay updated on further developments or reports in the Free-From Food Industry?
To stay informed about further developments, trends, and reports in the Free-From Food Industry, consider subscribing to industry newsletters, following relevant companies and organizations, or regularly checking reputable industry news sources and publications.
Methodology
Step 1 - Identification of Relevant Samples Size from Population Database


Step 2 - Approaches for Defining Global Market Size (Value, Volume* & Price*)

Note*: In applicable scenarios
Step 3 - Data Sources
Primary Research
- Web Analytics
- Survey Reports
- Research Institute
- Latest Research Reports
- Opinion Leaders
Secondary Research
- Annual Reports
- White Paper
- Latest Press Release
- Industry Association
- Paid Database
- Investor Presentations

Step 4 - Data Triangulation
Involves using different sources of information in order to increase the validity of a study
These sources are likely to be stakeholders in a program - participants, other researchers, program staff, other community members, and so on.
Then we put all data in single framework & apply various statistical tools to find out the dynamic on the market.
During the analysis stage, feedback from the stakeholder groups would be compared to determine areas of agreement as well as areas of divergence


