
Key Insights
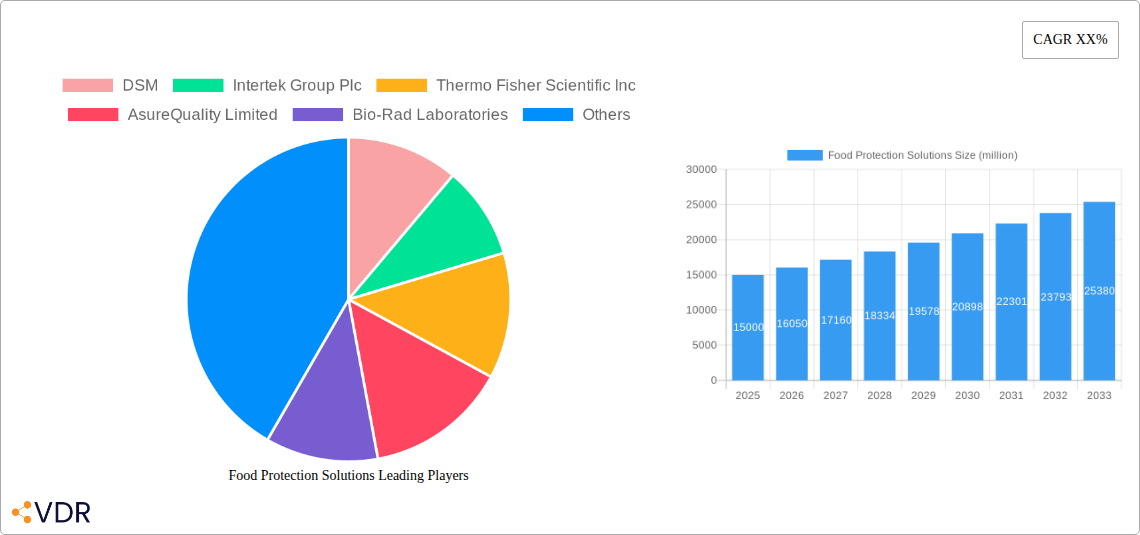
The global food protection solutions market is experiencing robust growth, driven by increasing consumer awareness of food safety and stringent government regulations. The market, estimated at $15 billion in 2025, is projected to witness a Compound Annual Growth Rate (CAGR) of 7% from 2025 to 2033, reaching approximately $25 billion by 2033. This growth is fueled by several key factors: rising incidences of foodborne illnesses, escalating demand for safe and high-quality food products, and the expanding adoption of advanced technologies like rapid microbial detection and DNA-based testing methods. Major players like DSM, Intertek, and Thermo Fisher Scientific are driving innovation and market expansion through strategic partnerships, acquisitions, and the development of cutting-edge solutions. The market is segmented by testing methods (chemical, microbiological, and physical), services (testing, auditing, and consulting), and end-users (food processing, retail, and hospitality). Specific regional variations exist, with North America and Europe holding significant market share due to established regulatory frameworks and high consumer awareness. However, emerging economies in Asia-Pacific are witnessing accelerated growth due to rising disposable incomes and increasing food consumption.
Challenges remain in ensuring widespread accessibility to food safety solutions, particularly in developing regions. Furthermore, the high cost associated with advanced testing technologies and the need for skilled personnel can hinder market penetration in certain segments. Nonetheless, the ongoing emphasis on food safety regulations, coupled with technological advancements and increasing consumer demand, is expected to sustain the significant growth trajectory of the food protection solutions market in the coming years. The market will likely see increased consolidation through mergers and acquisitions as companies strive for greater market share and technological capabilities. This trend, combined with continuous innovation, will solidify the position of food protection solutions as a crucial component of the global food industry.
Food Protection Solutions Market Report: 2019-2033
This comprehensive report provides an in-depth analysis of the Food Protection Solutions market, encompassing market dynamics, growth trends, regional analysis, product landscape, key players, and future outlook. The study period spans 2019-2033, with 2025 serving as the base and estimated year. The forecast period covers 2025-2033, and the historical period encompasses 2019-2024. The report caters to industry professionals, investors, and stakeholders seeking a granular understanding of this crucial sector. The total market value in 2025 is estimated at xx million.
Food Protection Solutions Market Dynamics & Structure
The global Food Protection Solutions market, valued at xx million in 2025, exhibits a moderately concentrated structure with key players like DSM, Intertek Group Plc, Thermo Fisher Scientific Inc, AsureQuality Limited, Bio-Rad Laboratories, Concept Life Sciences, SGS SA, Eurofins Scientific SE, Food Safety Solutions, Inc, Ecolab Food Safety Solutions, and Mérieux holding significant market share. Market concentration is influenced by factors such as technological advancements, regulatory compliance, and economies of scale.
- Market Concentration: The top 5 players collectively hold an estimated xx% market share in 2025.
- Technological Innovation: Rapid advancements in rapid microbial detection, DNA sequencing, and sensor technology are driving market growth. However, high R&D costs and integration complexities present innovation barriers.
- Regulatory Frameworks: Stringent food safety regulations across various geographies (e.g., FDA, EU regulations) are pushing adoption of advanced solutions, yet navigating diverse regulatory landscapes poses challenges for market entrants.
- Competitive Product Substitutes: Traditional methods of food testing face growing competition from rapid, accurate, and automated solutions.
- End-User Demographics: The market is driven by the food processing, packaging, and retail sectors, with increasing demand from emerging economies and rising consumer awareness regarding food safety.
- M&A Trends: The sector witnesses frequent mergers and acquisitions, reflecting consolidation and expansion strategies of leading players. An estimated xx M&A deals were recorded between 2019 and 2024.
Food Protection Solutions Growth Trends & Insights
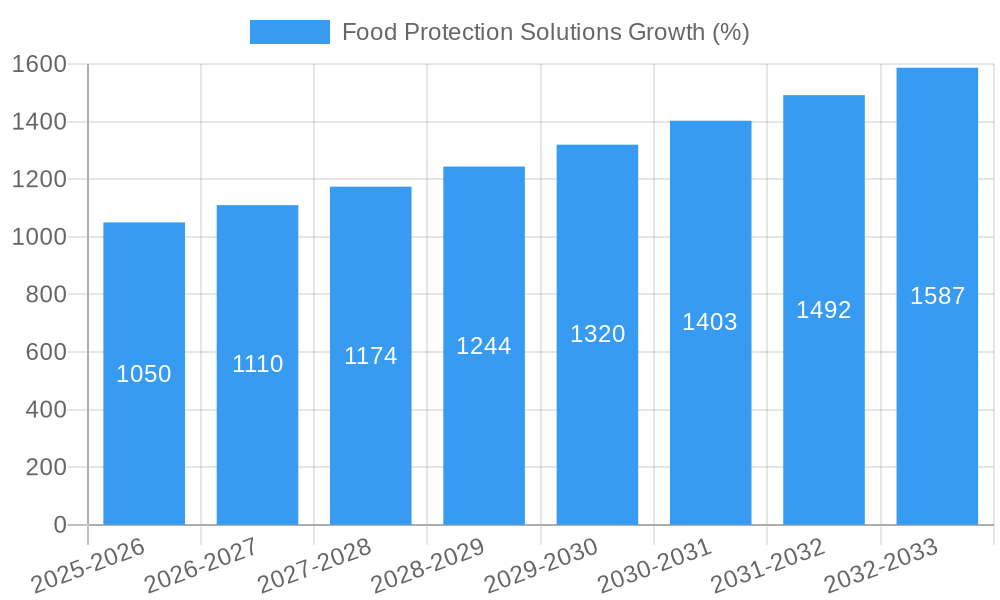
The Food Protection Solutions market is experiencing robust growth, driven by increasing consumer demand for safe and high-quality food products, stringent regulatory requirements, and technological advancements. The market size is projected to grow at a CAGR of xx% from 2025 to 2033, reaching xx million by 2033. This growth is fueled by several factors:
- Rising consumer awareness of foodborne illnesses and the importance of food safety protocols is pushing demand for advanced protection solutions.
- Stringent government regulations and food safety standards across the globe create substantial market opportunities.
- The development of rapid, accurate, and cost-effective testing technologies is driving market adoption.
- Automation and digitization are enhancing efficiency and reducing testing times, thereby accelerating market expansion.
- Growing e-commerce and online food delivery platforms are further boosting demand for robust food protection solutions, ensuring product integrity throughout the supply chain.
Dominant Regions, Countries, or Segments in Food Protection Solutions
North America currently dominates the Food Protection Solutions market, holding a market share of xx% in 2025, driven by factors such as the presence of major players, stringent food safety regulations, and high consumer awareness. Europe follows closely, with a market share of xx%. However, Asia-Pacific is projected to exhibit the fastest growth rate during the forecast period (CAGR of xx%), fueled by rising disposable incomes, increasing food consumption, and rapid economic development.
- North America: Strong regulatory frameworks, robust infrastructure, and high consumer awareness contribute to market dominance.
- Europe: Stringent regulations and a well-established food industry support market growth.
- Asia-Pacific: Rapid economic growth, rising middle-class population, and increasing demand for safe food products drive substantial growth potential.
Food Protection Solutions Product Landscape
The Food Protection Solutions market offers a diverse range of products, including rapid diagnostic tests, microbial detection kits, hygiene monitoring systems, and software solutions for traceability and supply chain management. Recent innovations focus on enhancing accuracy, speed, and automation, enabling real-time monitoring and early detection of potential hazards. Products are increasingly integrated with advanced technologies like AI and IoT for data analysis and predictive capabilities. This results in improved efficiency, reduced costs, and enhanced food safety across the supply chain. Unique selling propositions include improved accuracy, rapid results, user-friendly interfaces, and integration capabilities.
Key Drivers, Barriers & Challenges in Food Protection Solutions
Key Drivers:
- Increasing consumer awareness of food safety
- Stringent government regulations and standards
- Technological advancements in detection and monitoring
- Rising demand for traceability and transparency in food supply chains
Key Barriers and Challenges:
- High initial investment costs associated with advanced technologies
- Lack of skilled personnel for operation and maintenance
- Complex regulatory landscapes and compliance requirements across regions
- Competition from established players and the emergence of new technologies can create market pressures impacting profit margins by xx%.
Emerging Opportunities in Food Protection Solutions
- Expanding into emerging markets in Asia and Africa, capitalizing on increasing food consumption and rising incomes.
- Development of point-of-care testing devices for rapid, on-site food safety assessment.
- Leveraging AI and machine learning for predictive modeling and risk assessment in food supply chains.
- Integrating blockchain technology for enhanced food traceability and transparency.
Growth Accelerators in the Food Protection Solutions Industry
The Food Protection Solutions market is poised for continued growth, fueled by strategic partnerships between technology providers and food companies, expansion into new markets, and ongoing technological innovation. These developments pave the way for faster, more accurate, and more cost-effective food safety solutions, shaping the future of the industry. Specific growth strategies include investing in R&D, forming collaborations to expand market reach, and focusing on niche markets for specialized solutions.
Key Players Shaping the Food Protection Solutions Market
- DSM
- Intertek Group Plc
- Thermo Fisher Scientific Inc
- AsureQuality Limited
- Bio-Rad Laboratories
- Concept Life Sciences
- SGS SA
- Eurofins Scientific SE
- Food Safety Solutions, Inc
- Ecolab Food Safety Solutions
- Mérieux
Notable Milestones in Food Protection Solutions Sector
- 2020: Introduction of rapid molecular diagnostic tests for foodborne pathogens.
- 2021: Several key players launched advanced sensor technologies for real-time hygiene monitoring.
- 2022: Increased adoption of blockchain technology for enhanced food traceability.
- 2023: Several M&A activities consolidated market share among leading players.
- 2024: Launch of AI-powered predictive modeling platforms for food safety risk assessment.
In-Depth Food Protection Solutions Market Outlook
The Food Protection Solutions market presents significant growth opportunities driven by evolving consumer demands, technological innovations, and regulatory changes. The continued emphasis on food safety and traceability will propel market expansion throughout the forecast period, creating lucrative opportunities for companies investing in advanced technologies and strategic partnerships. Future growth will be shaped by the adoption of next-generation technologies such as AI, IoT, and blockchain, enhancing efficiency and accuracy while strengthening consumer confidence in food safety.
Food Protection Solutions Segmentation
-
1. Application
- 1.1. Dairy and Beverages Food
- 1.2. Poultry Food
- 1.3. Beef Food
- 1.4. Seafood
- 1.5. Processed Food
-
2. Types
- 2.1. Increasing Shelf Life
- 2.2. Control Microorganisms/ Bacteria
Food Protection Solutions Segmentation By Geography
-
1. North America
- 1.1. United States
- 1.2. Canada
- 1.3. Mexico
-
2. South America
- 2.1. Brazil
- 2.2. Argentina
- 2.3. Rest of South America
-
3. Europe
- 3.1. United Kingdom
- 3.2. Germany
- 3.3. France
- 3.4. Italy
- 3.5. Spain
- 3.6. Russia
- 3.7. Benelux
- 3.8. Nordics
- 3.9. Rest of Europe
-
4. Middle East & Africa
- 4.1. Turkey
- 4.2. Israel
- 4.3. GCC
- 4.4. North Africa
- 4.5. South Africa
- 4.6. Rest of Middle East & Africa
-
5. Asia Pacific
- 5.1. China
- 5.2. India
- 5.3. Japan
- 5.4. South Korea
- 5.5. ASEAN
- 5.6. Oceania
- 5.7. Rest of Asia Pacific

Food Protection Solutions REPORT HIGHLIGHTS
| Aspects | Details |
|---|---|
| Study Period | 2019-2033 |
| Base Year | 2024 |
| Estimated Year | 2025 |
| Forecast Period | 2025-2033 |
| Historical Period | 2019-2024 |
| Growth Rate | CAGR of XX% from 2019-2033 |
| Segmentation |
|
Table of Contents
- 1. Introduction
- 1.1. Research Scope
- 1.2. Market Segmentation
- 1.3. Research Methodology
- 1.4. Definitions and Assumptions
- 2. Executive Summary
- 2.1. Introduction
- 3. Market Dynamics
- 3.1. Introduction
- 3.2. Market Drivers
- 3.3. Market Restrains
- 3.4. Market Trends
- 4. Market Factor Analysis
- 4.1. Porters Five Forces
- 4.2. Supply/Value Chain
- 4.3. PESTEL analysis
- 4.4. Market Entropy
- 4.5. Patent/Trademark Analysis
- 5. Global Food Protection Solutions Analysis, Insights and Forecast, 2019-2031
- 5.1. Market Analysis, Insights and Forecast - by Application
- 5.1.1. Dairy and Beverages Food
- 5.1.2. Poultry Food
- 5.1.3. Beef Food
- 5.1.4. Seafood
- 5.1.5. Processed Food
- 5.2. Market Analysis, Insights and Forecast - by Types
- 5.2.1. Increasing Shelf Life
- 5.2.2. Control Microorganisms/ Bacteria
- 5.3. Market Analysis, Insights and Forecast - by Region
- 5.3.1. North America
- 5.3.2. South America
- 5.3.3. Europe
- 5.3.4. Middle East & Africa
- 5.3.5. Asia Pacific
- 5.1. Market Analysis, Insights and Forecast - by Application
- 6. North America Food Protection Solutions Analysis, Insights and Forecast, 2019-2031
- 6.1. Market Analysis, Insights and Forecast - by Application
- 6.1.1. Dairy and Beverages Food
- 6.1.2. Poultry Food
- 6.1.3. Beef Food
- 6.1.4. Seafood
- 6.1.5. Processed Food
- 6.2. Market Analysis, Insights and Forecast - by Types
- 6.2.1. Increasing Shelf Life
- 6.2.2. Control Microorganisms/ Bacteria
- 6.1. Market Analysis, Insights and Forecast - by Application
- 7. South America Food Protection Solutions Analysis, Insights and Forecast, 2019-2031
- 7.1. Market Analysis, Insights and Forecast - by Application
- 7.1.1. Dairy and Beverages Food
- 7.1.2. Poultry Food
- 7.1.3. Beef Food
- 7.1.4. Seafood
- 7.1.5. Processed Food
- 7.2. Market Analysis, Insights and Forecast - by Types
- 7.2.1. Increasing Shelf Life
- 7.2.2. Control Microorganisms/ Bacteria
- 7.1. Market Analysis, Insights and Forecast - by Application
- 8. Europe Food Protection Solutions Analysis, Insights and Forecast, 2019-2031
- 8.1. Market Analysis, Insights and Forecast - by Application
- 8.1.1. Dairy and Beverages Food
- 8.1.2. Poultry Food
- 8.1.3. Beef Food
- 8.1.4. Seafood
- 8.1.5. Processed Food
- 8.2. Market Analysis, Insights and Forecast - by Types
- 8.2.1. Increasing Shelf Life
- 8.2.2. Control Microorganisms/ Bacteria
- 8.1. Market Analysis, Insights and Forecast - by Application
- 9. Middle East & Africa Food Protection Solutions Analysis, Insights and Forecast, 2019-2031
- 9.1. Market Analysis, Insights and Forecast - by Application
- 9.1.1. Dairy and Beverages Food
- 9.1.2. Poultry Food
- 9.1.3. Beef Food
- 9.1.4. Seafood
- 9.1.5. Processed Food
- 9.2. Market Analysis, Insights and Forecast - by Types
- 9.2.1. Increasing Shelf Life
- 9.2.2. Control Microorganisms/ Bacteria
- 9.1. Market Analysis, Insights and Forecast - by Application
- 10. Asia Pacific Food Protection Solutions Analysis, Insights and Forecast, 2019-2031
- 10.1. Market Analysis, Insights and Forecast - by Application
- 10.1.1. Dairy and Beverages Food
- 10.1.2. Poultry Food
- 10.1.3. Beef Food
- 10.1.4. Seafood
- 10.1.5. Processed Food
- 10.2. Market Analysis, Insights and Forecast - by Types
- 10.2.1. Increasing Shelf Life
- 10.2.2. Control Microorganisms/ Bacteria
- 10.1. Market Analysis, Insights and Forecast - by Application
- 11. Competitive Analysis
- 11.1. Global Market Share Analysis 2024
- 11.2. Company Profiles
- 11.2.1 DSM
- 11.2.1.1. Overview
- 11.2.1.2. Products
- 11.2.1.3. SWOT Analysis
- 11.2.1.4. Recent Developments
- 11.2.1.5. Financials (Based on Availability)
- 11.2.2 Intertek Group Plc
- 11.2.2.1. Overview
- 11.2.2.2. Products
- 11.2.2.3. SWOT Analysis
- 11.2.2.4. Recent Developments
- 11.2.2.5. Financials (Based on Availability)
- 11.2.3 Thermo Fisher Scientific Inc
- 11.2.3.1. Overview
- 11.2.3.2. Products
- 11.2.3.3. SWOT Analysis
- 11.2.3.4. Recent Developments
- 11.2.3.5. Financials (Based on Availability)
- 11.2.4 AsureQuality Limited
- 11.2.4.1. Overview
- 11.2.4.2. Products
- 11.2.4.3. SWOT Analysis
- 11.2.4.4. Recent Developments
- 11.2.4.5. Financials (Based on Availability)
- 11.2.5 Bio-Rad Laboratories
- 11.2.5.1. Overview
- 11.2.5.2. Products
- 11.2.5.3. SWOT Analysis
- 11.2.5.4. Recent Developments
- 11.2.5.5. Financials (Based on Availability)
- 11.2.6 Concept Life Sciences
- 11.2.6.1. Overview
- 11.2.6.2. Products
- 11.2.6.3. SWOT Analysis
- 11.2.6.4. Recent Developments
- 11.2.6.5. Financials (Based on Availability)
- 11.2.7 SGS SA
- 11.2.7.1. Overview
- 11.2.7.2. Products
- 11.2.7.3. SWOT Analysis
- 11.2.7.4. Recent Developments
- 11.2.7.5. Financials (Based on Availability)
- 11.2.8 Eurofins Scientific SE
- 11.2.8.1. Overview
- 11.2.8.2. Products
- 11.2.8.3. SWOT Analysis
- 11.2.8.4. Recent Developments
- 11.2.8.5. Financials (Based on Availability)
- 11.2.9 Food Safety Solutions
- 11.2.9.1. Overview
- 11.2.9.2. Products
- 11.2.9.3. SWOT Analysis
- 11.2.9.4. Recent Developments
- 11.2.9.5. Financials (Based on Availability)
- 11.2.10 Inc
- 11.2.10.1. Overview
- 11.2.10.2. Products
- 11.2.10.3. SWOT Analysis
- 11.2.10.4. Recent Developments
- 11.2.10.5. Financials (Based on Availability)
- 11.2.11 Ecolab Food Safety Solutions
- 11.2.11.1. Overview
- 11.2.11.2. Products
- 11.2.11.3. SWOT Analysis
- 11.2.11.4. Recent Developments
- 11.2.11.5. Financials (Based on Availability)
- 11.2.12 Mérieux
- 11.2.12.1. Overview
- 11.2.12.2. Products
- 11.2.12.3. SWOT Analysis
- 11.2.12.4. Recent Developments
- 11.2.12.5. Financials (Based on Availability)
- 11.2.1 DSM
List of Figures
- Figure 1: Global Food Protection Solutions Revenue Breakdown (million, %) by Region 2024 & 2032
- Figure 2: North America Food Protection Solutions Revenue (million), by Application 2024 & 2032
- Figure 3: North America Food Protection Solutions Revenue Share (%), by Application 2024 & 2032
- Figure 4: North America Food Protection Solutions Revenue (million), by Types 2024 & 2032
- Figure 5: North America Food Protection Solutions Revenue Share (%), by Types 2024 & 2032
- Figure 6: North America Food Protection Solutions Revenue (million), by Country 2024 & 2032
- Figure 7: North America Food Protection Solutions Revenue Share (%), by Country 2024 & 2032
- Figure 8: South America Food Protection Solutions Revenue (million), by Application 2024 & 2032
- Figure 9: South America Food Protection Solutions Revenue Share (%), by Application 2024 & 2032
- Figure 10: South America Food Protection Solutions Revenue (million), by Types 2024 & 2032
- Figure 11: South America Food Protection Solutions Revenue Share (%), by Types 2024 & 2032
- Figure 12: South America Food Protection Solutions Revenue (million), by Country 2024 & 2032
- Figure 13: South America Food Protection Solutions Revenue Share (%), by Country 2024 & 2032
- Figure 14: Europe Food Protection Solutions Revenue (million), by Application 2024 & 2032
- Figure 15: Europe Food Protection Solutions Revenue Share (%), by Application 2024 & 2032
- Figure 16: Europe Food Protection Solutions Revenue (million), by Types 2024 & 2032
- Figure 17: Europe Food Protection Solutions Revenue Share (%), by Types 2024 & 2032
- Figure 18: Europe Food Protection Solutions Revenue (million), by Country 2024 & 2032
- Figure 19: Europe Food Protection Solutions Revenue Share (%), by Country 2024 & 2032
- Figure 20: Middle East & Africa Food Protection Solutions Revenue (million), by Application 2024 & 2032
- Figure 21: Middle East & Africa Food Protection Solutions Revenue Share (%), by Application 2024 & 2032
- Figure 22: Middle East & Africa Food Protection Solutions Revenue (million), by Types 2024 & 2032
- Figure 23: Middle East & Africa Food Protection Solutions Revenue Share (%), by Types 2024 & 2032
- Figure 24: Middle East & Africa Food Protection Solutions Revenue (million), by Country 2024 & 2032
- Figure 25: Middle East & Africa Food Protection Solutions Revenue Share (%), by Country 2024 & 2032
- Figure 26: Asia Pacific Food Protection Solutions Revenue (million), by Application 2024 & 2032
- Figure 27: Asia Pacific Food Protection Solutions Revenue Share (%), by Application 2024 & 2032
- Figure 28: Asia Pacific Food Protection Solutions Revenue (million), by Types 2024 & 2032
- Figure 29: Asia Pacific Food Protection Solutions Revenue Share (%), by Types 2024 & 2032
- Figure 30: Asia Pacific Food Protection Solutions Revenue (million), by Country 2024 & 2032
- Figure 31: Asia Pacific Food Protection Solutions Revenue Share (%), by Country 2024 & 2032
List of Tables
- Table 1: Global Food Protection Solutions Revenue million Forecast, by Region 2019 & 2032
- Table 2: Global Food Protection Solutions Revenue million Forecast, by Application 2019 & 2032
- Table 3: Global Food Protection Solutions Revenue million Forecast, by Types 2019 & 2032
- Table 4: Global Food Protection Solutions Revenue million Forecast, by Region 2019 & 2032
- Table 5: Global Food Protection Solutions Revenue million Forecast, by Application 2019 & 2032
- Table 6: Global Food Protection Solutions Revenue million Forecast, by Types 2019 & 2032
- Table 7: Global Food Protection Solutions Revenue million Forecast, by Country 2019 & 2032
- Table 8: United States Food Protection Solutions Revenue (million) Forecast, by Application 2019 & 2032
- Table 9: Canada Food Protection Solutions Revenue (million) Forecast, by Application 2019 & 2032
- Table 10: Mexico Food Protection Solutions Revenue (million) Forecast, by Application 2019 & 2032
- Table 11: Global Food Protection Solutions Revenue million Forecast, by Application 2019 & 2032
- Table 12: Global Food Protection Solutions Revenue million Forecast, by Types 2019 & 2032
- Table 13: Global Food Protection Solutions Revenue million Forecast, by Country 2019 & 2032
- Table 14: Brazil Food Protection Solutions Revenue (million) Forecast, by Application 2019 & 2032
- Table 15: Argentina Food Protection Solutions Revenue (million) Forecast, by Application 2019 & 2032
- Table 16: Rest of South America Food Protection Solutions Revenue (million) Forecast, by Application 2019 & 2032
- Table 17: Global Food Protection Solutions Revenue million Forecast, by Application 2019 & 2032
- Table 18: Global Food Protection Solutions Revenue million Forecast, by Types 2019 & 2032
- Table 19: Global Food Protection Solutions Revenue million Forecast, by Country 2019 & 2032
- Table 20: United Kingdom Food Protection Solutions Revenue (million) Forecast, by Application 2019 & 2032
- Table 21: Germany Food Protection Solutions Revenue (million) Forecast, by Application 2019 & 2032
- Table 22: France Food Protection Solutions Revenue (million) Forecast, by Application 2019 & 2032
- Table 23: Italy Food Protection Solutions Revenue (million) Forecast, by Application 2019 & 2032
- Table 24: Spain Food Protection Solutions Revenue (million) Forecast, by Application 2019 & 2032
- Table 25: Russia Food Protection Solutions Revenue (million) Forecast, by Application 2019 & 2032
- Table 26: Benelux Food Protection Solutions Revenue (million) Forecast, by Application 2019 & 2032
- Table 27: Nordics Food Protection Solutions Revenue (million) Forecast, by Application 2019 & 2032
- Table 28: Rest of Europe Food Protection Solutions Revenue (million) Forecast, by Application 2019 & 2032
- Table 29: Global Food Protection Solutions Revenue million Forecast, by Application 2019 & 2032
- Table 30: Global Food Protection Solutions Revenue million Forecast, by Types 2019 & 2032
- Table 31: Global Food Protection Solutions Revenue million Forecast, by Country 2019 & 2032
- Table 32: Turkey Food Protection Solutions Revenue (million) Forecast, by Application 2019 & 2032
- Table 33: Israel Food Protection Solutions Revenue (million) Forecast, by Application 2019 & 2032
- Table 34: GCC Food Protection Solutions Revenue (million) Forecast, by Application 2019 & 2032
- Table 35: North Africa Food Protection Solutions Revenue (million) Forecast, by Application 2019 & 2032
- Table 36: South Africa Food Protection Solutions Revenue (million) Forecast, by Application 2019 & 2032
- Table 37: Rest of Middle East & Africa Food Protection Solutions Revenue (million) Forecast, by Application 2019 & 2032
- Table 38: Global Food Protection Solutions Revenue million Forecast, by Application 2019 & 2032
- Table 39: Global Food Protection Solutions Revenue million Forecast, by Types 2019 & 2032
- Table 40: Global Food Protection Solutions Revenue million Forecast, by Country 2019 & 2032
- Table 41: China Food Protection Solutions Revenue (million) Forecast, by Application 2019 & 2032
- Table 42: India Food Protection Solutions Revenue (million) Forecast, by Application 2019 & 2032
- Table 43: Japan Food Protection Solutions Revenue (million) Forecast, by Application 2019 & 2032
- Table 44: South Korea Food Protection Solutions Revenue (million) Forecast, by Application 2019 & 2032
- Table 45: ASEAN Food Protection Solutions Revenue (million) Forecast, by Application 2019 & 2032
- Table 46: Oceania Food Protection Solutions Revenue (million) Forecast, by Application 2019 & 2032
- Table 47: Rest of Asia Pacific Food Protection Solutions Revenue (million) Forecast, by Application 2019 & 2032
Frequently Asked Questions
1. What is the projected Compound Annual Growth Rate (CAGR) of the Food Protection Solutions?
The projected CAGR is approximately XX%.
2. Which companies are prominent players in the Food Protection Solutions?
Key companies in the market include DSM, Intertek Group Plc, Thermo Fisher Scientific Inc, AsureQuality Limited, Bio-Rad Laboratories, Concept Life Sciences, SGS SA, Eurofins Scientific SE, Food Safety Solutions, Inc, Ecolab Food Safety Solutions, Mérieux.
3. What are the main segments of the Food Protection Solutions?
The market segments include Application, Types.
4. Can you provide details about the market size?
The market size is estimated to be USD XXX million as of 2022.
5. What are some drivers contributing to market growth?
N/A
6. What are the notable trends driving market growth?
N/A
7. Are there any restraints impacting market growth?
N/A
8. Can you provide examples of recent developments in the market?
N/A
9. What pricing options are available for accessing the report?
Pricing options include single-user, multi-user, and enterprise licenses priced at USD 3350.00, USD 5025.00, and USD 6700.00 respectively.
10. Is the market size provided in terms of value or volume?
The market size is provided in terms of value, measured in million.
11. Are there any specific market keywords associated with the report?
Yes, the market keyword associated with the report is "Food Protection Solutions," which aids in identifying and referencing the specific market segment covered.
12. How do I determine which pricing option suits my needs best?
The pricing options vary based on user requirements and access needs. Individual users may opt for single-user licenses, while businesses requiring broader access may choose multi-user or enterprise licenses for cost-effective access to the report.
13. Are there any additional resources or data provided in the Food Protection Solutions report?
While the report offers comprehensive insights, it's advisable to review the specific contents or supplementary materials provided to ascertain if additional resources or data are available.
14. How can I stay updated on further developments or reports in the Food Protection Solutions?
To stay informed about further developments, trends, and reports in the Food Protection Solutions, consider subscribing to industry newsletters, following relevant companies and organizations, or regularly checking reputable industry news sources and publications.
Methodology
Step 1 - Identification of Relevant Samples Size from Population Database


Step 2 - Approaches for Defining Global Market Size (Value, Volume* & Price*)

Note*: In applicable scenarios
Step 3 - Data Sources
Primary Research
- Web Analytics
- Survey Reports
- Research Institute
- Latest Research Reports
- Opinion Leaders
Secondary Research
- Annual Reports
- White Paper
- Latest Press Release
- Industry Association
- Paid Database
- Investor Presentations

Step 4 - Data Triangulation
Involves using different sources of information in order to increase the validity of a study
These sources are likely to be stakeholders in a program - participants, other researchers, program staff, other community members, and so on.
Then we put all data in single framework & apply various statistical tools to find out the dynamic on the market.
During the analysis stage, feedback from the stakeholder groups would be compared to determine areas of agreement as well as areas of divergence


