
Key Insights
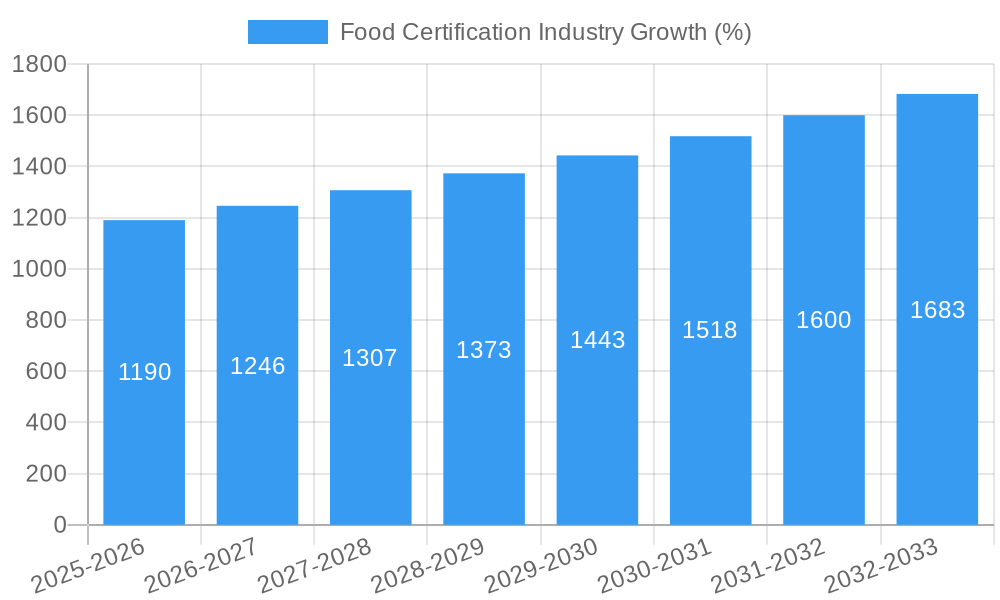
The global food certification market is experiencing robust growth, driven by increasing consumer demand for safe, high-quality, and ethically sourced food products. A compound annual growth rate (CAGR) of 5.90% from 2019 to 2024 suggests a significant market expansion, projected to continue into the forecast period (2025-2033). Key drivers include stringent government regulations regarding food safety and traceability, heightened consumer awareness of foodborne illnesses, and the rising popularity of certifications like ISO 22000, BRCGS, Halal, and GMP+/FSA, which provide assurance of quality and compliance. The increasing prevalence of food fraud and the need for robust supply chain management further fuel market expansion. Market segmentation reveals a diverse landscape, with significant contributions from various end-user industries such as meat, poultry, seafood, dairy, infant food, beverages, and bakery/confectionery products. Geographic distribution shows strong growth across regions, particularly in developing economies experiencing rapid economic growth and rising middle classes with increased disposable income and greater demand for certified food items.
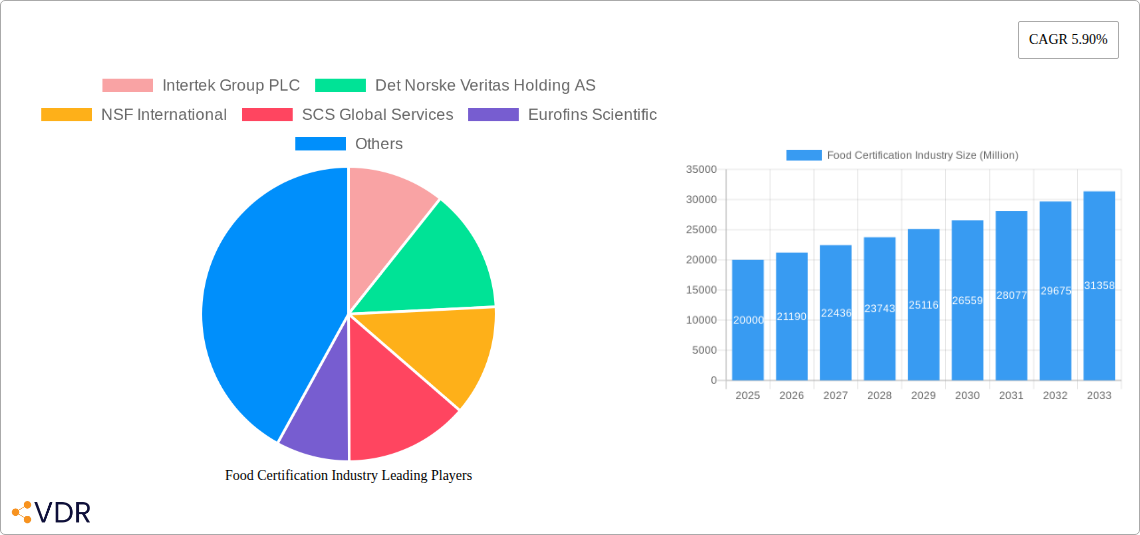
The leading players in the food certification market are multinational companies with established global networks and comprehensive service offerings. These companies invest heavily in research and development to stay at the forefront of evolving food safety standards and consumer expectations. The competitive landscape is characterized by both intense rivalry and strategic collaborations, with companies focusing on expanding their service portfolios, geographic reach, and technological capabilities. While the market faces restraints such as the high cost of certification and the complexity of compliance requirements, the overall outlook remains positive. The continued focus on food safety, ethical sourcing, and transparency is expected to propel sustained growth in the coming years, creating lucrative opportunities for existing players and potential new entrants. We estimate the 2025 market size to be approximately $20 Billion, based on the provided CAGR and considering the general upward trend in the food processing and certification sectors. This estimate is further supported by the increasing global population, rising middle class and greater demand for food safety.
Food Certification Industry Market Report: 2019-2033
This comprehensive report provides a detailed analysis of the Food Certification Industry, encompassing market size, growth trends, key players, and future outlook. With a focus on parent markets (Food Safety and Quality Assurance) and child markets (specific certifications like Halal, Organic, Vegan), this report offers invaluable insights for industry professionals, investors, and stakeholders. The study period covers 2019-2033, with 2025 as the base and estimated year.
Food Certification Industry Market Dynamics & Structure
The global food certification market, valued at xx Million in 2025, is characterized by a moderately consolidated structure with several key players holding significant market share. Intertek Group PLC, SGS Group, and Bureau Veritas are among the leading companies, commanding a combined xx% market share in 2025. Technological advancements, such as blockchain technology for traceability and AI-driven risk assessment, are driving innovation. Stringent regulatory frameworks, like those mandated by the FDA and EFSA, are paramount, shaping industry practices and fostering demand for certification services. The market faces competition from alternative quality assurance methods, but the demand for third-party verification remains strong. End-user demographics, particularly rising consumer awareness of food safety and ethical sourcing, are crucial drivers. M&A activity has been moderate, with xx deals recorded between 2019 and 2024, primarily focusing on expanding service portfolios and geographic reach.
- Market Concentration: Moderately consolidated, with top 3 players holding xx% market share in 2025.
- Technological Innovation: Blockchain, AI, and automation are driving efficiency and traceability.
- Regulatory Frameworks: Stringent regulations (FDA, EFSA) are key market drivers.
- Competitive Substitutes: Internal quality control programs pose some competition.
- End-user Demographics: Growing consumer awareness of food safety and ethical sourcing.
- M&A Trends: xx M&A deals between 2019-2024, focused on expansion and diversification.
Food Certification Industry Growth Trends & Insights
The global food certification market is projected to experience robust growth, with a CAGR of xx% during the forecast period (2025-2033). This growth is fueled by increasing consumer demand for safe, high-quality, and ethically sourced food products. The rising prevalence of foodborne illnesses and increasing awareness of food safety regulations are driving adoption rates for various certifications. Technological disruptions, such as the implementation of blockchain technology for enhanced traceability and improved supply chain management, are further accelerating market growth. Consumer behavior shifts, including a preference for plant-based and organic products, are also positively impacting the demand for related certifications. Market penetration for key certifications like ISO 22000 and BRCGS is expected to reach xx% by 2033. Shifting consumer preferences towards vegan and plant-based products are creating lucrative segments within the market.
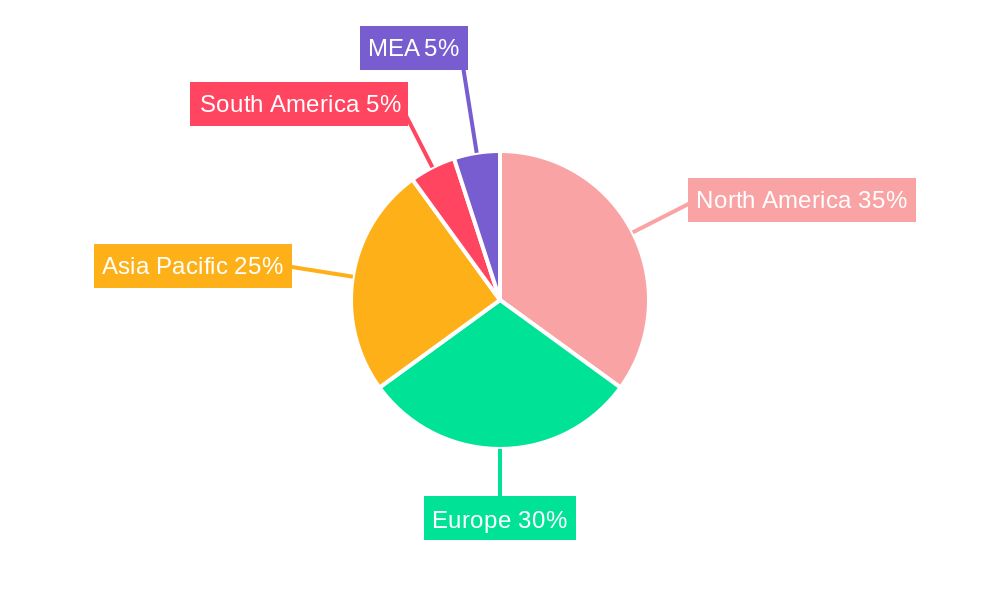
Dominant Regions, Countries, or Segments in Food Certification Industry
North America and Europe currently dominate the food certification market, driven by stringent regulations, high consumer awareness, and established food processing industries. Within these regions, the Meat, Poultry, and Seafood Products segment, representing xx Million in 2025, holds the largest market share, followed by Dairy Products (xx Million). The ISO 22000 certification remains the most widely adopted standard globally, followed by BRCGS and Halal certifications. Asia-Pacific is experiencing rapid growth, driven by increasing disposable incomes and stricter regulatory enforcement.
- Leading Regions: North America and Europe, due to stringent regulations and high consumer awareness.
- Key Segments: Meat, Poultry, and Seafood; Dairy; Infant Food; Beverages; Bakery and Confectionery; Other.
- Dominant Certifications: ISO 22000, BRCGS, Halal.
- Growth Drivers (Asia-Pacific): Rising disposable incomes, stricter regulations, and increasing consumer awareness.
Food Certification Industry Product Landscape
The food certification market offers a diverse range of services, including audits, inspections, testing, and training, tailored to specific certifications like ISO 22000, BRCGS, Halal, GMP+/FSA, and others. Innovations focus on leveraging technology to enhance efficiency, accuracy, and transparency. Unique selling propositions include specialized expertise in specific food categories, streamlined certification processes, and utilization of blockchain technology for improved traceability.
Key Drivers, Barriers & Challenges in Food Certification Industry
Key Drivers: Growing consumer demand for safe and ethically sourced food; stringent government regulations; rising incidences of foodborne illnesses; and increasing adoption of technology for enhanced traceability and efficiency.
Challenges: High certification costs can be a barrier for smaller businesses; navigating diverse and evolving regulatory landscapes presents complexities; and intense competition among certification bodies can lead to price wars, impacting profitability. Supply chain disruptions (estimated xx% impact on certification services in 2024) further add to these challenges.
Emerging Opportunities in Food Certification Industry
Untapped markets in developing economies; rising demand for certifications related to sustainability and ethical sourcing; and the growing popularity of plant-based and organic foods create significant opportunities. Innovations in certification processes, such as AI-powered risk assessments and blockchain-based traceability, also represent lucrative avenues for growth.
Growth Accelerators in the Food Certification Industry
Technological advancements in automation and data analysis are enhancing efficiency and accuracy in certification processes. Strategic partnerships between certification bodies and food producers are streamlining operations and improving traceability. Market expansion into developing economies with burgeoning food industries represents significant growth potential.
Key Players Shaping the Food Certification Industry Market
- Intertek Group PLC
- Det Norske Veritas Holding AS
- NSF International
- SCS Global Services
- Eurofins Scientific
- Compagnie Merieux Alliance SAS (Merieux Nutrisciences)
- SGS Group
- AsureQuality Limited
- Bureau Veritas
- TÜV SÜD AG
Notable Milestones in Food Certification Industry Sector
- November 2022: SCS Global Services launched its plant-based certification program (SCS-109 Standard).
- November 2022: SGS SA introduced the SGS Food Contact Product Certification Mark.
- September 2022: Intertek Group PLC introduced a new vegan food certification mark.
In-Depth Food Certification Industry Market Outlook
The food certification market is poised for sustained growth, driven by technological advancements, expanding regulatory frameworks, and evolving consumer preferences. Strategic partnerships and market expansion into emerging economies will further accelerate market expansion. The focus on sustainability, ethical sourcing, and transparency will shape future demand, creating opportunities for innovative certification services.
Food Certification Industry Segmentation
-
1. End-user Industry
- 1.1. Meat, Poultry, and Seafood Products
- 1.2. Dairy Products
- 1.3. Infant Food
- 1.4. Beverages
- 1.5. Bakery and Confectionery Products
- 1.6. Other End-user Industries
-
2. Type
- 2.1. ISO 22000 - Food Safety Management System
- 2.2. BRCGS
- 2.3. Halal Certification
- 2.4. GMP+/FSA
- 2.5. Other Certifications
Food Certification Industry Segmentation By Geography
-
1. North America
- 1.1. United States
- 1.2. Canada
- 1.3. Mexico
- 1.4. Rest of North America
-
2. Europe
- 2.1. United Kingdom
- 2.2. Germany
- 2.3. France
- 2.4. Russia
- 2.5. Italy
- 2.6. Spain
- 2.7. Rest of Europe
-
3. Asia Pacific
- 3.1. India
- 3.2. China
- 3.3. Japan
- 3.4. Australia
- 3.5. Rest of Asia Pacific
-
4. South America
- 4.1. Brazil
- 4.2. Argentina
- 4.3. Rest of South America
- 5. Middle East
-
6. South Africa
- 6.1. Saudi Arabia
- 6.2. Rest of Middle East
Food Certification Industry REPORT HIGHLIGHTS
| Aspects | Details |
|---|---|
| Study Period | 2019-2033 |
| Base Year | 2024 |
| Estimated Year | 2025 |
| Forecast Period | 2025-2033 |
| Historical Period | 2019-2024 |
| Growth Rate | CAGR of 5.90% from 2019-2033 |
| Segmentation |
|
Table of Contents
- 1. Introduction
- 1.1. Research Scope
- 1.2. Market Segmentation
- 1.3. Research Methodology
- 1.4. Definitions and Assumptions
- 2. Executive Summary
- 2.1. Introduction
- 3. Market Dynamics
- 3.1. Introduction
- 3.2. Market Drivers
- 3.2.1. Growing consumer demand for transparency and quality assurance in food products drives the need for certification
- 3.3. Market Restrains
- 3.3.1. High Certification Costs
- 3.4. Market Trends
- 3.4.1. Increasing use of technology such as blockchain and digital platforms is enhancing transparency and traceability in the certification process
- 4. Market Factor Analysis
- 4.1. Porters Five Forces
- 4.2. Supply/Value Chain
- 4.3. PESTEL analysis
- 4.4. Market Entropy
- 4.5. Patent/Trademark Analysis
- 5. Global Food Certification Industry Analysis, Insights and Forecast, 2019-2031
- 5.1. Market Analysis, Insights and Forecast - by End-user Industry
- 5.1.1. Meat, Poultry, and Seafood Products
- 5.1.2. Dairy Products
- 5.1.3. Infant Food
- 5.1.4. Beverages
- 5.1.5. Bakery and Confectionery Products
- 5.1.6. Other End-user Industries
- 5.2. Market Analysis, Insights and Forecast - by Type
- 5.2.1. ISO 22000 - Food Safety Management System
- 5.2.2. BRCGS
- 5.2.3. Halal Certification
- 5.2.4. GMP+/FSA
- 5.2.5. Other Certifications
- 5.3. Market Analysis, Insights and Forecast - by Region
- 5.3.1. North America
- 5.3.2. Europe
- 5.3.3. Asia Pacific
- 5.3.4. South America
- 5.3.5. Middle East
- 5.3.6. South Africa
- 5.1. Market Analysis, Insights and Forecast - by End-user Industry
- 6. North America Food Certification Industry Analysis, Insights and Forecast, 2019-2031
- 6.1. Market Analysis, Insights and Forecast - by End-user Industry
- 6.1.1. Meat, Poultry, and Seafood Products
- 6.1.2. Dairy Products
- 6.1.3. Infant Food
- 6.1.4. Beverages
- 6.1.5. Bakery and Confectionery Products
- 6.1.6. Other End-user Industries
- 6.2. Market Analysis, Insights and Forecast - by Type
- 6.2.1. ISO 22000 - Food Safety Management System
- 6.2.2. BRCGS
- 6.2.3. Halal Certification
- 6.2.4. GMP+/FSA
- 6.2.5. Other Certifications
- 6.1. Market Analysis, Insights and Forecast - by End-user Industry
- 7. Europe Food Certification Industry Analysis, Insights and Forecast, 2019-2031
- 7.1. Market Analysis, Insights and Forecast - by End-user Industry
- 7.1.1. Meat, Poultry, and Seafood Products
- 7.1.2. Dairy Products
- 7.1.3. Infant Food
- 7.1.4. Beverages
- 7.1.5. Bakery and Confectionery Products
- 7.1.6. Other End-user Industries
- 7.2. Market Analysis, Insights and Forecast - by Type
- 7.2.1. ISO 22000 - Food Safety Management System
- 7.2.2. BRCGS
- 7.2.3. Halal Certification
- 7.2.4. GMP+/FSA
- 7.2.5. Other Certifications
- 7.1. Market Analysis, Insights and Forecast - by End-user Industry
- 8. Asia Pacific Food Certification Industry Analysis, Insights and Forecast, 2019-2031
- 8.1. Market Analysis, Insights and Forecast - by End-user Industry
- 8.1.1. Meat, Poultry, and Seafood Products
- 8.1.2. Dairy Products
- 8.1.3. Infant Food
- 8.1.4. Beverages
- 8.1.5. Bakery and Confectionery Products
- 8.1.6. Other End-user Industries
- 8.2. Market Analysis, Insights and Forecast - by Type
- 8.2.1. ISO 22000 - Food Safety Management System
- 8.2.2. BRCGS
- 8.2.3. Halal Certification
- 8.2.4. GMP+/FSA
- 8.2.5. Other Certifications
- 8.1. Market Analysis, Insights and Forecast - by End-user Industry
- 9. South America Food Certification Industry Analysis, Insights and Forecast, 2019-2031
- 9.1. Market Analysis, Insights and Forecast - by End-user Industry
- 9.1.1. Meat, Poultry, and Seafood Products
- 9.1.2. Dairy Products
- 9.1.3. Infant Food
- 9.1.4. Beverages
- 9.1.5. Bakery and Confectionery Products
- 9.1.6. Other End-user Industries
- 9.2. Market Analysis, Insights and Forecast - by Type
- 9.2.1. ISO 22000 - Food Safety Management System
- 9.2.2. BRCGS
- 9.2.3. Halal Certification
- 9.2.4. GMP+/FSA
- 9.2.5. Other Certifications
- 9.1. Market Analysis, Insights and Forecast - by End-user Industry
- 10. Middle East Food Certification Industry Analysis, Insights and Forecast, 2019-2031
- 10.1. Market Analysis, Insights and Forecast - by End-user Industry
- 10.1.1. Meat, Poultry, and Seafood Products
- 10.1.2. Dairy Products
- 10.1.3. Infant Food
- 10.1.4. Beverages
- 10.1.5. Bakery and Confectionery Products
- 10.1.6. Other End-user Industries
- 10.2. Market Analysis, Insights and Forecast - by Type
- 10.2.1. ISO 22000 - Food Safety Management System
- 10.2.2. BRCGS
- 10.2.3. Halal Certification
- 10.2.4. GMP+/FSA
- 10.2.5. Other Certifications
- 10.1. Market Analysis, Insights and Forecast - by End-user Industry
- 11. South Africa Food Certification Industry Analysis, Insights and Forecast, 2019-2031
- 11.1. Market Analysis, Insights and Forecast - by End-user Industry
- 11.1.1. Meat, Poultry, and Seafood Products
- 11.1.2. Dairy Products
- 11.1.3. Infant Food
- 11.1.4. Beverages
- 11.1.5. Bakery and Confectionery Products
- 11.1.6. Other End-user Industries
- 11.2. Market Analysis, Insights and Forecast - by Type
- 11.2.1. ISO 22000 - Food Safety Management System
- 11.2.2. BRCGS
- 11.2.3. Halal Certification
- 11.2.4. GMP+/FSA
- 11.2.5. Other Certifications
- 11.1. Market Analysis, Insights and Forecast - by End-user Industry
- 12. North America Food Certification Industry Analysis, Insights and Forecast, 2019-2031
- 12.1. Market Analysis, Insights and Forecast - By Country/Sub-region
- 12.1.1 United States
- 12.1.2 Canada
- 12.1.3 Mexico
- 12.1.4 Rest of North America
- 13. Europe Food Certification Industry Analysis, Insights and Forecast, 2019-2031
- 13.1. Market Analysis, Insights and Forecast - By Country/Sub-region
- 13.1.1 United Kingdom
- 13.1.2 Germany
- 13.1.3 France
- 13.1.4 Russia
- 13.1.5 Italy
- 13.1.6 Spain
- 13.1.7 Rest of Europe
- 14. Asia Pacific Food Certification Industry Analysis, Insights and Forecast, 2019-2031
- 14.1. Market Analysis, Insights and Forecast - By Country/Sub-region
- 14.1.1 India
- 14.1.2 China
- 14.1.3 Japan
- 14.1.4 Australia
- 14.1.5 Rest of Asia Pacific
- 15. South America Food Certification Industry Analysis, Insights and Forecast, 2019-2031
- 15.1. Market Analysis, Insights and Forecast - By Country/Sub-region
- 15.1.1 Brazil
- 15.1.2 Argentina
- 15.1.3 Rest of South America
- 16. MEA Food Certification Industry Analysis, Insights and Forecast, 2019-2031
- 16.1. Market Analysis, Insights and Forecast - By Country/Sub-region
- 16.1.1 Middle East
- 16.1.2 Africa
- 17. Competitive Analysis
- 17.1. Global Market Share Analysis 2024
- 17.2. Company Profiles
- 17.2.1 Intertek Group PLC
- 17.2.1.1. Overview
- 17.2.1.2. Products
- 17.2.1.3. SWOT Analysis
- 17.2.1.4. Recent Developments
- 17.2.1.5. Financials (Based on Availability)
- 17.2.2 Det Norske Veritas Holding AS
- 17.2.2.1. Overview
- 17.2.2.2. Products
- 17.2.2.3. SWOT Analysis
- 17.2.2.4. Recent Developments
- 17.2.2.5. Financials (Based on Availability)
- 17.2.3 NSF International
- 17.2.3.1. Overview
- 17.2.3.2. Products
- 17.2.3.3. SWOT Analysis
- 17.2.3.4. Recent Developments
- 17.2.3.5. Financials (Based on Availability)
- 17.2.4 SCS Global Services
- 17.2.4.1. Overview
- 17.2.4.2. Products
- 17.2.4.3. SWOT Analysis
- 17.2.4.4. Recent Developments
- 17.2.4.5. Financials (Based on Availability)
- 17.2.5 Eurofins Scientific
- 17.2.5.1. Overview
- 17.2.5.2. Products
- 17.2.5.3. SWOT Analysis
- 17.2.5.4. Recent Developments
- 17.2.5.5. Financials (Based on Availability)
- 17.2.6 Compagnie Merieux Alliance SAS (Merieux Nutrisciences)
- 17.2.6.1. Overview
- 17.2.6.2. Products
- 17.2.6.3. SWOT Analysis
- 17.2.6.4. Recent Developments
- 17.2.6.5. Financials (Based on Availability)
- 17.2.7 SGS Group
- 17.2.7.1. Overview
- 17.2.7.2. Products
- 17.2.7.3. SWOT Analysis
- 17.2.7.4. Recent Developments
- 17.2.7.5. Financials (Based on Availability)
- 17.2.8 AsureQuality Limited
- 17.2.8.1. Overview
- 17.2.8.2. Products
- 17.2.8.3. SWOT Analysis
- 17.2.8.4. Recent Developments
- 17.2.8.5. Financials (Based on Availability)
- 17.2.9 Bureau Veritas
- 17.2.9.1. Overview
- 17.2.9.2. Products
- 17.2.9.3. SWOT Analysis
- 17.2.9.4. Recent Developments
- 17.2.9.5. Financials (Based on Availability)
- 17.2.10 TÜV SÜD AG
- 17.2.10.1. Overview
- 17.2.10.2. Products
- 17.2.10.3. SWOT Analysis
- 17.2.10.4. Recent Developments
- 17.2.10.5. Financials (Based on Availability)
- 17.2.1 Intertek Group PLC
List of Figures
- Figure 1: Global Food Certification Industry Revenue Breakdown (Million, %) by Region 2024 & 2032
- Figure 2: North America Food Certification Industry Revenue (Million), by Country 2024 & 2032
- Figure 3: North America Food Certification Industry Revenue Share (%), by Country 2024 & 2032
- Figure 4: Europe Food Certification Industry Revenue (Million), by Country 2024 & 2032
- Figure 5: Europe Food Certification Industry Revenue Share (%), by Country 2024 & 2032
- Figure 6: Asia Pacific Food Certification Industry Revenue (Million), by Country 2024 & 2032
- Figure 7: Asia Pacific Food Certification Industry Revenue Share (%), by Country 2024 & 2032
- Figure 8: South America Food Certification Industry Revenue (Million), by Country 2024 & 2032
- Figure 9: South America Food Certification Industry Revenue Share (%), by Country 2024 & 2032
- Figure 10: MEA Food Certification Industry Revenue (Million), by Country 2024 & 2032
- Figure 11: MEA Food Certification Industry Revenue Share (%), by Country 2024 & 2032
- Figure 12: North America Food Certification Industry Revenue (Million), by End-user Industry 2024 & 2032
- Figure 13: North America Food Certification Industry Revenue Share (%), by End-user Industry 2024 & 2032
- Figure 14: North America Food Certification Industry Revenue (Million), by Type 2024 & 2032
- Figure 15: North America Food Certification Industry Revenue Share (%), by Type 2024 & 2032
- Figure 16: North America Food Certification Industry Revenue (Million), by Country 2024 & 2032
- Figure 17: North America Food Certification Industry Revenue Share (%), by Country 2024 & 2032
- Figure 18: Europe Food Certification Industry Revenue (Million), by End-user Industry 2024 & 2032
- Figure 19: Europe Food Certification Industry Revenue Share (%), by End-user Industry 2024 & 2032
- Figure 20: Europe Food Certification Industry Revenue (Million), by Type 2024 & 2032
- Figure 21: Europe Food Certification Industry Revenue Share (%), by Type 2024 & 2032
- Figure 22: Europe Food Certification Industry Revenue (Million), by Country 2024 & 2032
- Figure 23: Europe Food Certification Industry Revenue Share (%), by Country 2024 & 2032
- Figure 24: Asia Pacific Food Certification Industry Revenue (Million), by End-user Industry 2024 & 2032
- Figure 25: Asia Pacific Food Certification Industry Revenue Share (%), by End-user Industry 2024 & 2032
- Figure 26: Asia Pacific Food Certification Industry Revenue (Million), by Type 2024 & 2032
- Figure 27: Asia Pacific Food Certification Industry Revenue Share (%), by Type 2024 & 2032
- Figure 28: Asia Pacific Food Certification Industry Revenue (Million), by Country 2024 & 2032
- Figure 29: Asia Pacific Food Certification Industry Revenue Share (%), by Country 2024 & 2032
- Figure 30: South America Food Certification Industry Revenue (Million), by End-user Industry 2024 & 2032
- Figure 31: South America Food Certification Industry Revenue Share (%), by End-user Industry 2024 & 2032
- Figure 32: South America Food Certification Industry Revenue (Million), by Type 2024 & 2032
- Figure 33: South America Food Certification Industry Revenue Share (%), by Type 2024 & 2032
- Figure 34: South America Food Certification Industry Revenue (Million), by Country 2024 & 2032
- Figure 35: South America Food Certification Industry Revenue Share (%), by Country 2024 & 2032
- Figure 36: Middle East Food Certification Industry Revenue (Million), by End-user Industry 2024 & 2032
- Figure 37: Middle East Food Certification Industry Revenue Share (%), by End-user Industry 2024 & 2032
- Figure 38: Middle East Food Certification Industry Revenue (Million), by Type 2024 & 2032
- Figure 39: Middle East Food Certification Industry Revenue Share (%), by Type 2024 & 2032
- Figure 40: Middle East Food Certification Industry Revenue (Million), by Country 2024 & 2032
- Figure 41: Middle East Food Certification Industry Revenue Share (%), by Country 2024 & 2032
- Figure 42: South Africa Food Certification Industry Revenue (Million), by End-user Industry 2024 & 2032
- Figure 43: South Africa Food Certification Industry Revenue Share (%), by End-user Industry 2024 & 2032
- Figure 44: South Africa Food Certification Industry Revenue (Million), by Type 2024 & 2032
- Figure 45: South Africa Food Certification Industry Revenue Share (%), by Type 2024 & 2032
- Figure 46: South Africa Food Certification Industry Revenue (Million), by Country 2024 & 2032
- Figure 47: South Africa Food Certification Industry Revenue Share (%), by Country 2024 & 2032
List of Tables
- Table 1: Global Food Certification Industry Revenue Million Forecast, by Region 2019 & 2032
- Table 2: Global Food Certification Industry Revenue Million Forecast, by End-user Industry 2019 & 2032
- Table 3: Global Food Certification Industry Revenue Million Forecast, by Type 2019 & 2032
- Table 4: Global Food Certification Industry Revenue Million Forecast, by Region 2019 & 2032
- Table 5: Global Food Certification Industry Revenue Million Forecast, by Country 2019 & 2032
- Table 6: United States Food Certification Industry Revenue (Million) Forecast, by Application 2019 & 2032
- Table 7: Canada Food Certification Industry Revenue (Million) Forecast, by Application 2019 & 2032
- Table 8: Mexico Food Certification Industry Revenue (Million) Forecast, by Application 2019 & 2032
- Table 9: Rest of North America Food Certification Industry Revenue (Million) Forecast, by Application 2019 & 2032
- Table 10: Global Food Certification Industry Revenue Million Forecast, by Country 2019 & 2032
- Table 11: United Kingdom Food Certification Industry Revenue (Million) Forecast, by Application 2019 & 2032
- Table 12: Germany Food Certification Industry Revenue (Million) Forecast, by Application 2019 & 2032
- Table 13: France Food Certification Industry Revenue (Million) Forecast, by Application 2019 & 2032
- Table 14: Russia Food Certification Industry Revenue (Million) Forecast, by Application 2019 & 2032
- Table 15: Italy Food Certification Industry Revenue (Million) Forecast, by Application 2019 & 2032
- Table 16: Spain Food Certification Industry Revenue (Million) Forecast, by Application 2019 & 2032
- Table 17: Rest of Europe Food Certification Industry Revenue (Million) Forecast, by Application 2019 & 2032
- Table 18: Global Food Certification Industry Revenue Million Forecast, by Country 2019 & 2032
- Table 19: India Food Certification Industry Revenue (Million) Forecast, by Application 2019 & 2032
- Table 20: China Food Certification Industry Revenue (Million) Forecast, by Application 2019 & 2032
- Table 21: Japan Food Certification Industry Revenue (Million) Forecast, by Application 2019 & 2032
- Table 22: Australia Food Certification Industry Revenue (Million) Forecast, by Application 2019 & 2032
- Table 23: Rest of Asia Pacific Food Certification Industry Revenue (Million) Forecast, by Application 2019 & 2032
- Table 24: Global Food Certification Industry Revenue Million Forecast, by Country 2019 & 2032
- Table 25: Brazil Food Certification Industry Revenue (Million) Forecast, by Application 2019 & 2032
- Table 26: Argentina Food Certification Industry Revenue (Million) Forecast, by Application 2019 & 2032
- Table 27: Rest of South America Food Certification Industry Revenue (Million) Forecast, by Application 2019 & 2032
- Table 28: Global Food Certification Industry Revenue Million Forecast, by Country 2019 & 2032
- Table 29: Middle East Food Certification Industry Revenue (Million) Forecast, by Application 2019 & 2032
- Table 30: Africa Food Certification Industry Revenue (Million) Forecast, by Application 2019 & 2032
- Table 31: Global Food Certification Industry Revenue Million Forecast, by End-user Industry 2019 & 2032
- Table 32: Global Food Certification Industry Revenue Million Forecast, by Type 2019 & 2032
- Table 33: Global Food Certification Industry Revenue Million Forecast, by Country 2019 & 2032
- Table 34: United States Food Certification Industry Revenue (Million) Forecast, by Application 2019 & 2032
- Table 35: Canada Food Certification Industry Revenue (Million) Forecast, by Application 2019 & 2032
- Table 36: Mexico Food Certification Industry Revenue (Million) Forecast, by Application 2019 & 2032
- Table 37: Rest of North America Food Certification Industry Revenue (Million) Forecast, by Application 2019 & 2032
- Table 38: Global Food Certification Industry Revenue Million Forecast, by End-user Industry 2019 & 2032
- Table 39: Global Food Certification Industry Revenue Million Forecast, by Type 2019 & 2032
- Table 40: Global Food Certification Industry Revenue Million Forecast, by Country 2019 & 2032
- Table 41: United Kingdom Food Certification Industry Revenue (Million) Forecast, by Application 2019 & 2032
- Table 42: Germany Food Certification Industry Revenue (Million) Forecast, by Application 2019 & 2032
- Table 43: France Food Certification Industry Revenue (Million) Forecast, by Application 2019 & 2032
- Table 44: Russia Food Certification Industry Revenue (Million) Forecast, by Application 2019 & 2032
- Table 45: Italy Food Certification Industry Revenue (Million) Forecast, by Application 2019 & 2032
- Table 46: Spain Food Certification Industry Revenue (Million) Forecast, by Application 2019 & 2032
- Table 47: Rest of Europe Food Certification Industry Revenue (Million) Forecast, by Application 2019 & 2032
- Table 48: Global Food Certification Industry Revenue Million Forecast, by End-user Industry 2019 & 2032
- Table 49: Global Food Certification Industry Revenue Million Forecast, by Type 2019 & 2032
- Table 50: Global Food Certification Industry Revenue Million Forecast, by Country 2019 & 2032
- Table 51: India Food Certification Industry Revenue (Million) Forecast, by Application 2019 & 2032
- Table 52: China Food Certification Industry Revenue (Million) Forecast, by Application 2019 & 2032
- Table 53: Japan Food Certification Industry Revenue (Million) Forecast, by Application 2019 & 2032
- Table 54: Australia Food Certification Industry Revenue (Million) Forecast, by Application 2019 & 2032
- Table 55: Rest of Asia Pacific Food Certification Industry Revenue (Million) Forecast, by Application 2019 & 2032
- Table 56: Global Food Certification Industry Revenue Million Forecast, by End-user Industry 2019 & 2032
- Table 57: Global Food Certification Industry Revenue Million Forecast, by Type 2019 & 2032
- Table 58: Global Food Certification Industry Revenue Million Forecast, by Country 2019 & 2032
- Table 59: Brazil Food Certification Industry Revenue (Million) Forecast, by Application 2019 & 2032
- Table 60: Argentina Food Certification Industry Revenue (Million) Forecast, by Application 2019 & 2032
- Table 61: Rest of South America Food Certification Industry Revenue (Million) Forecast, by Application 2019 & 2032
- Table 62: Global Food Certification Industry Revenue Million Forecast, by End-user Industry 2019 & 2032
- Table 63: Global Food Certification Industry Revenue Million Forecast, by Type 2019 & 2032
- Table 64: Global Food Certification Industry Revenue Million Forecast, by Country 2019 & 2032
- Table 65: Global Food Certification Industry Revenue Million Forecast, by End-user Industry 2019 & 2032
- Table 66: Global Food Certification Industry Revenue Million Forecast, by Type 2019 & 2032
- Table 67: Global Food Certification Industry Revenue Million Forecast, by Country 2019 & 2032
- Table 68: Saudi Arabia Food Certification Industry Revenue (Million) Forecast, by Application 2019 & 2032
- Table 69: Rest of Middle East Food Certification Industry Revenue (Million) Forecast, by Application 2019 & 2032
Frequently Asked Questions
1. What is the projected Compound Annual Growth Rate (CAGR) of the Food Certification Industry?
The projected CAGR is approximately 5.90%.
2. Which companies are prominent players in the Food Certification Industry?
Key companies in the market include Intertek Group PLC, Det Norske Veritas Holding AS, NSF International, SCS Global Services, Eurofins Scientific, Compagnie Merieux Alliance SAS (Merieux Nutrisciences), SGS Group, AsureQuality Limited, Bureau Veritas, TÜV SÜD AG.
3. What are the main segments of the Food Certification Industry?
The market segments include End-user Industry, Type.
4. Can you provide details about the market size?
The market size is estimated to be USD XX Million as of 2022.
5. What are some drivers contributing to market growth?
Growing consumer demand for transparency and quality assurance in food products drives the need for certification.
6. What are the notable trends driving market growth?
Increasing use of technology such as blockchain and digital platforms is enhancing transparency and traceability in the certification process.
7. Are there any restraints impacting market growth?
High Certification Costs.
8. Can you provide examples of recent developments in the market?
In November 2022, SCS Global Services launched its plant-based certification program. The program promotes plant-based alternatives and recognizes innovation in a wide range of consumer products. Food, beverages, CBD, and body care products are all eligible for certification under the SCS-109 Standard. Certification ensures that no animal-derived ingredients are used in the production of the product. Furthermore, products for human and animal consumption must contain at least 95% plant-based ingredients, while other products, such as body care products, must contain at least 50% plant-based ingredients.
9. What pricing options are available for accessing the report?
Pricing options include single-user, multi-user, and enterprise licenses priced at USD 4750, USD 5250, and USD 8750 respectively.
10. Is the market size provided in terms of value or volume?
The market size is provided in terms of value, measured in Million.
11. Are there any specific market keywords associated with the report?
Yes, the market keyword associated with the report is "Food Certification Industry," which aids in identifying and referencing the specific market segment covered.
12. How do I determine which pricing option suits my needs best?
The pricing options vary based on user requirements and access needs. Individual users may opt for single-user licenses, while businesses requiring broader access may choose multi-user or enterprise licenses for cost-effective access to the report.
13. Are there any additional resources or data provided in the Food Certification Industry report?
While the report offers comprehensive insights, it's advisable to review the specific contents or supplementary materials provided to ascertain if additional resources or data are available.
14. How can I stay updated on further developments or reports in the Food Certification Industry?
To stay informed about further developments, trends, and reports in the Food Certification Industry, consider subscribing to industry newsletters, following relevant companies and organizations, or regularly checking reputable industry news sources and publications.
Methodology
Step 1 - Identification of Relevant Samples Size from Population Database


Step 2 - Approaches for Defining Global Market Size (Value, Volume* & Price*)

Note*: In applicable scenarios
Step 3 - Data Sources
Primary Research
- Web Analytics
- Survey Reports
- Research Institute
- Latest Research Reports
- Opinion Leaders
Secondary Research
- Annual Reports
- White Paper
- Latest Press Release
- Industry Association
- Paid Database
- Investor Presentations

Step 4 - Data Triangulation
Involves using different sources of information in order to increase the validity of a study
These sources are likely to be stakeholders in a program - participants, other researchers, program staff, other community members, and so on.
Then we put all data in single framework & apply various statistical tools to find out the dynamic on the market.
During the analysis stage, feedback from the stakeholder groups would be compared to determine areas of agreement as well as areas of divergence


