
Key Insights
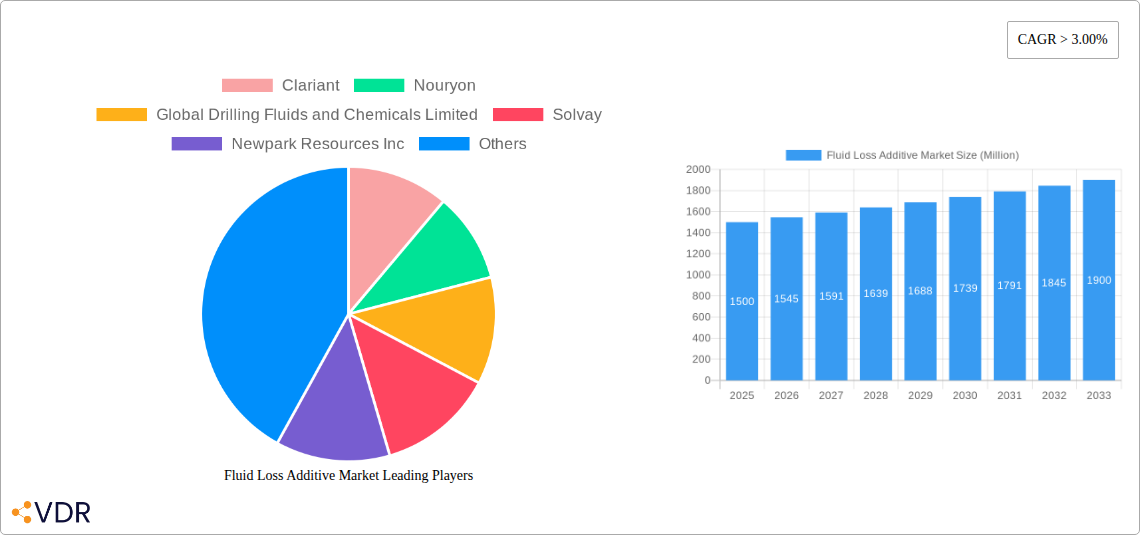
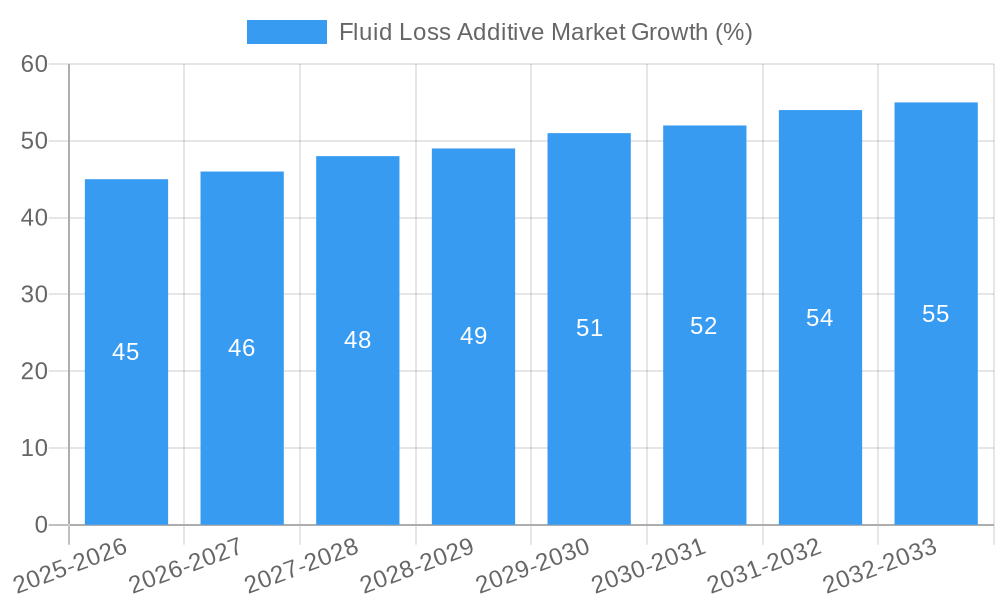
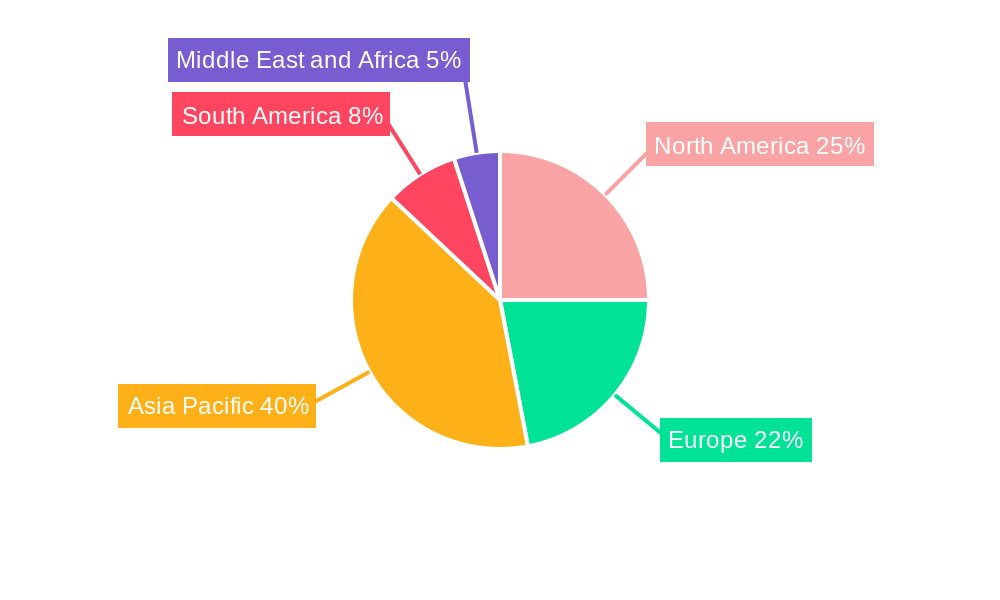
The global fluid loss additive market is experiencing robust growth, projected to maintain a CAGR exceeding 3.00% from 2025 to 2033. This expansion is driven by the increasing demand for efficient drilling fluids and cement slurries in the oil and gas, and construction industries. The rising number of infrastructure projects globally, coupled with the exploration and production of unconventional energy resources, significantly fuels market demand. Synthetic fluid loss additives currently dominate the market due to their superior performance characteristics, including enhanced temperature and pressure resistance, and improved rheological properties. However, the natural and synthetically modified natural segments are witnessing significant growth, driven by increasing environmental concerns and the push for sustainable solutions within the industry. Key applications include drilling fluids for oil and gas extraction and cement slurries for construction, with the drilling fluid segment currently holding a larger market share. Growth is geographically diverse, with the Asia-Pacific region, particularly China and India, exhibiting strong growth potential due to rapid industrialization and infrastructure development. North America and Europe also represent significant markets, driven by ongoing exploration activities and renovation projects. Competition within the market is intense, with major players such as Clariant, Nouryon, and Solvay continuously innovating to improve product offerings and expand their market reach. The market faces challenges such as fluctuating raw material prices and stringent environmental regulations, but these are offset by the overall positive growth trajectory and increasing demand.
The future of the fluid loss additive market looks promising, with continued growth expected across all segments. Technological advancements focusing on environmentally friendly additives, improved performance characteristics, and cost-effectiveness will be crucial drivers of future market expansion. Companies are likely to focus on strategic partnerships, mergers, and acquisitions to strengthen their market position and broaden their product portfolios. Furthermore, investment in research and development to explore novel additive formulations will be a key factor in shaping the competitive landscape. The market's growth is intrinsically linked to the global economic climate and the future trajectory of the oil and gas and construction sectors. Sustained investment in these industries will be essential for the fluid loss additive market to continue its robust expansion.
Fluid Loss Additive Market: A Comprehensive Report (2019-2033)
This comprehensive report provides an in-depth analysis of the Fluid Loss Additive market, encompassing market dynamics, growth trends, regional analysis, competitive landscape, and future outlook. The study period covers 2019-2033, with 2025 as the base year and a forecast period of 2025-2033. The report segments the market by Additive Type (Synthetic, Natural, Synthetically Modified Natural) and Application (Drilling Fluid, Cement Slurry), offering granular insights into this crucial sub-sector of the Oil & Gas and Construction industries. The total market value is predicted to reach xx Million by 2033.
Fluid Loss Additive Market Market Dynamics & Structure
The Fluid Loss Additive market is characterized by a moderately concentrated structure, with key players such as Clariant, Nouryon, and Schlumberger holding significant market share. Technological innovation, particularly in developing environmentally friendly and high-performance additives, is a primary driver. Stringent environmental regulations, particularly concerning wastewater disposal and the reduction of carbon footprint, are shaping industry practices. The market witnesses competition from alternative materials and technologies, and mergers and acquisitions play a significant role in consolidation and expansion.
- Market Concentration: The top 5 players hold an estimated xx% market share in 2025.
- Technological Innovation: Focus on biodegradable and high-performance additives is driving innovation.
- Regulatory Framework: Stringent environmental regulations are increasing the demand for eco-friendly additives.
- Competitive Substitutes: Alternative materials and technologies pose a competitive threat.
- M&A Activity: An average of xx M&A deals per year were observed during the historical period (2019-2024).
- Innovation Barriers: High R&D costs and lengthy regulatory approval processes hinder rapid innovation.
Fluid Loss Additive Market Growth Trends & Insights
The Fluid Loss Additive market experienced a Compound Annual Growth Rate (CAGR) of xx% during the historical period (2019-2024), driven by increasing global oil and gas exploration and production activities, and the construction boom across several regions. The market is witnessing a shift towards sustainable and high-performance additives. Adoption rates are increasing steadily, primarily in developing economies with substantial infrastructure development. Technological disruptions, such as the development of nanomaterials and smart additives, are expected to reshape market dynamics in the forecast period. Consumer behavior shifts, prioritizing sustainability and cost-effectiveness, are impacting product demand. The market is expected to reach xx Million by 2033, exhibiting a CAGR of xx% during the forecast period (2025-2033). Market penetration in key regions is estimated at xx% in 2025.
Dominant Regions, Countries, or Segments in Fluid Loss Additive Market
North America currently dominates the Fluid Loss Additive market, followed by the Middle East and Asia Pacific. This dominance stems from robust oil and gas exploration activities in North America and significant infrastructure development projects in the Asia-Pacific region. The Synthetic segment holds the largest market share by Additive Type due to its superior performance characteristics, while the Drilling Fluid application dominates by end-use.
- Key Drivers in North America: Extensive shale gas exploration, robust oil & gas infrastructure.
- Key Drivers in Asia-Pacific: Rapid infrastructure development, rising urbanization.
- Market Share: North America holds approximately xx% of the global market share in 2025.
- Growth Potential: The Middle East and Africa are projected to experience the highest growth rate during the forecast period.
- Synthetic Segment Dominance: Superior performance and increased demand drive its market share.
- Drilling Fluid Application: High demand from the oil & gas industry leads its market dominance.
Fluid Loss Additive Market Product Landscape
The Fluid Loss Additive market offers a wide range of products tailored to specific applications and performance requirements. Recent innovations include biodegradable additives, nanomaterials-enhanced formulations for improved rheological properties, and smart additives that respond dynamically to changing drilling conditions. Unique selling propositions center on enhanced performance, reduced environmental impact, and cost-effectiveness. Technological advancements are primarily focused on improving the efficiency and sustainability of drilling and cementing operations.
Key Drivers, Barriers & Challenges in Fluid Loss Additive Market
Key Drivers: The increasing demand for oil and gas, coupled with the expansion of the construction sector, is the primary driver for market growth. Stricter environmental regulations are pushing adoption of eco-friendly additives. Advancements in nanotechnology and other materials science are fostering product innovation.
Challenges and Restraints: Fluctuations in oil and gas prices, particularly impacting the drilling fluid segment, create uncertainty. Supply chain disruptions, particularly concerning raw material sourcing, can lead to production bottlenecks. Regulatory hurdles and compliance costs associated with environmental regulations impose significant challenges. Intense competition from established and emerging players leads to price pressure.
Emerging Opportunities in Fluid Loss Additive Market
Untapped markets in developing economies, particularly in Africa and South America, present significant opportunities for market expansion. Innovative applications, such as in geothermal energy and hydraulic fracturing, are emerging. Evolving consumer preferences toward sustainable and high-performance additives are creating niche market segments. The development of new technologies, such as bio-based additives, will create further growth opportunities.
Growth Accelerators in the Fluid Loss Additive Market Industry
Technological advancements, particularly in nanomaterials and bio-based additives, are driving long-term growth. Strategic partnerships between additive manufacturers and oilfield service companies are enhancing market penetration. Market expansion strategies, including geographical diversification and product portfolio expansion, are crucial for sustained growth. Government initiatives promoting sustainable construction and energy practices are providing supportive frameworks.
Key Players Shaping the Fluid Loss Additive Market Market
- Clariant
- Nouryon
- Global Drilling Fluids and Chemicals Limited
- Solvay
- Newpark Resources Inc
- Kemira OYJ
- BASF SE
- Tytan Organics Pvt Ltd
- Halliburton
- Schlumberger Limited
Notable Milestones in Fluid Loss Additive Market Sector
- 2021-Q3: Clariant launched a new range of biodegradable fluid loss additives.
- 2022-Q1: Nouryon and a major oilfield services company announced a strategic partnership for joint product development.
- 2023-Q2: A significant merger occurred between two smaller fluid loss additive manufacturers. (Specific details would be included in the full report)
In-Depth Fluid Loss Additive Market Market Outlook
The Fluid Loss Additive market is poised for continued growth, driven by sustained demand from the oil and gas and construction industries. The focus on sustainability and technological innovation will shape market dynamics. Strategic partnerships, investments in R&D, and market expansion efforts will be key to capitalizing on emerging opportunities and achieving long-term success. The market is expected to witness significant consolidation, driven by M&A activities, leading to a more concentrated landscape.
Fluid Loss Additive Market Segmentation
-
1. Additive Type
- 1.1. Synthetic
- 1.2. Natural
- 1.3. Synthetically Modified Natural
-
2. Application
- 2.1. Drilling Fluid
- 2.2. Cement Slurry
Fluid Loss Additive Market Segmentation By Geography
-
1. Asia Pacific
- 1.1. China
- 1.2. India
- 1.3. Japan
- 1.4. South Korea
- 1.5. Rest of Asia Pacific
-
2. North America
- 2.1. United States
- 2.2. Canada
- 2.3. Mexico
-
3. Europe
- 3.1. Germany
- 3.2. United Kingdom
- 3.3. France
- 3.4. Italy
- 3.5. Rest of Europe
-
4. South America
- 4.1. Brazil
- 4.2. Argentina
- 4.3. Rest of South America
-
5. Middle East and Africa
- 5.1. Saudi Arabia
- 5.2. South Africa
- 5.3. Rest of Middle East and Africa
Fluid Loss Additive Market REPORT HIGHLIGHTS
| Aspects | Details |
|---|---|
| Study Period | 2019-2033 |
| Base Year | 2024 |
| Estimated Year | 2025 |
| Forecast Period | 2025-2033 |
| Historical Period | 2019-2024 |
| Growth Rate | CAGR of > 3.00% from 2019-2033 |
| Segmentation |
|
Table of Contents
- 1. Introduction
- 1.1. Research Scope
- 1.2. Market Segmentation
- 1.3. Research Methodology
- 1.4. Definitions and Assumptions
- 2. Executive Summary
- 2.1. Introduction
- 3. Market Dynamics
- 3.1. Introduction
- 3.2. Market Drivers
- 3.2.1. ; Increase in Shale Gas Exploration; Increasing Investments in the Latest and Unconventional Drilling Technologies
- 3.3. Market Restrains
- 3.3.1. ; Growing Demand for Electric Vehicles; Harmful Impact on Environment
- 3.4. Market Trends
- 3.4.1. Drilling Fluid Application to Dominate the Market
- 4. Market Factor Analysis
- 4.1. Porters Five Forces
- 4.2. Supply/Value Chain
- 4.3. PESTEL analysis
- 4.4. Market Entropy
- 4.5. Patent/Trademark Analysis
- 5. Global Fluid Loss Additive Market Analysis, Insights and Forecast, 2019-2031
- 5.1. Market Analysis, Insights and Forecast - by Additive Type
- 5.1.1. Synthetic
- 5.1.2. Natural
- 5.1.3. Synthetically Modified Natural
- 5.2. Market Analysis, Insights and Forecast - by Application
- 5.2.1. Drilling Fluid
- 5.2.2. Cement Slurry
- 5.3. Market Analysis, Insights and Forecast - by Region
- 5.3.1. Asia Pacific
- 5.3.2. North America
- 5.3.3. Europe
- 5.3.4. South America
- 5.3.5. Middle East and Africa
- 5.1. Market Analysis, Insights and Forecast - by Additive Type
- 6. Asia Pacific Fluid Loss Additive Market Analysis, Insights and Forecast, 2019-2031
- 6.1. Market Analysis, Insights and Forecast - by Additive Type
- 6.1.1. Synthetic
- 6.1.2. Natural
- 6.1.3. Synthetically Modified Natural
- 6.2. Market Analysis, Insights and Forecast - by Application
- 6.2.1. Drilling Fluid
- 6.2.2. Cement Slurry
- 6.1. Market Analysis, Insights and Forecast - by Additive Type
- 7. North America Fluid Loss Additive Market Analysis, Insights and Forecast, 2019-2031
- 7.1. Market Analysis, Insights and Forecast - by Additive Type
- 7.1.1. Synthetic
- 7.1.2. Natural
- 7.1.3. Synthetically Modified Natural
- 7.2. Market Analysis, Insights and Forecast - by Application
- 7.2.1. Drilling Fluid
- 7.2.2. Cement Slurry
- 7.1. Market Analysis, Insights and Forecast - by Additive Type
- 8. Europe Fluid Loss Additive Market Analysis, Insights and Forecast, 2019-2031
- 8.1. Market Analysis, Insights and Forecast - by Additive Type
- 8.1.1. Synthetic
- 8.1.2. Natural
- 8.1.3. Synthetically Modified Natural
- 8.2. Market Analysis, Insights and Forecast - by Application
- 8.2.1. Drilling Fluid
- 8.2.2. Cement Slurry
- 8.1. Market Analysis, Insights and Forecast - by Additive Type
- 9. South America Fluid Loss Additive Market Analysis, Insights and Forecast, 2019-2031
- 9.1. Market Analysis, Insights and Forecast - by Additive Type
- 9.1.1. Synthetic
- 9.1.2. Natural
- 9.1.3. Synthetically Modified Natural
- 9.2. Market Analysis, Insights and Forecast - by Application
- 9.2.1. Drilling Fluid
- 9.2.2. Cement Slurry
- 9.1. Market Analysis, Insights and Forecast - by Additive Type
- 10. Middle East and Africa Fluid Loss Additive Market Analysis, Insights and Forecast, 2019-2031
- 10.1. Market Analysis, Insights and Forecast - by Additive Type
- 10.1.1. Synthetic
- 10.1.2. Natural
- 10.1.3. Synthetically Modified Natural
- 10.2. Market Analysis, Insights and Forecast - by Application
- 10.2.1. Drilling Fluid
- 10.2.2. Cement Slurry
- 10.1. Market Analysis, Insights and Forecast - by Additive Type
- 11. Asia Pacific Fluid Loss Additive Market Analysis, Insights and Forecast, 2019-2031
- 11.1. Market Analysis, Insights and Forecast - By Country/Sub-region
- 11.1.1 China
- 11.1.2 India
- 11.1.3 Japan
- 11.1.4 South Korea
- 11.1.5 Rest of Asia Pacific
- 12. North America Fluid Loss Additive Market Analysis, Insights and Forecast, 2019-2031
- 12.1. Market Analysis, Insights and Forecast - By Country/Sub-region
- 12.1.1 United States
- 12.1.2 Canada
- 12.1.3 Mexico
- 13. Europe Fluid Loss Additive Market Analysis, Insights and Forecast, 2019-2031
- 13.1. Market Analysis, Insights and Forecast - By Country/Sub-region
- 13.1.1 Germany
- 13.1.2 United Kingdom
- 13.1.3 France
- 13.1.4 Italy
- 13.1.5 Rest of Europe
- 14. South America Fluid Loss Additive Market Analysis, Insights and Forecast, 2019-2031
- 14.1. Market Analysis, Insights and Forecast - By Country/Sub-region
- 14.1.1 Brazil
- 14.1.2 Argentina
- 14.1.3 Rest of South America
- 15. Middle East and Africa Fluid Loss Additive Market Analysis, Insights and Forecast, 2019-2031
- 15.1. Market Analysis, Insights and Forecast - By Country/Sub-region
- 15.1.1 Saudi Arabia
- 15.1.2 South Africa
- 15.1.3 Rest of Middle East and Africa
- 16. Competitive Analysis
- 16.1. Global Market Share Analysis 2024
- 16.2. Company Profiles
- 16.2.1 Clariant
- 16.2.1.1. Overview
- 16.2.1.2. Products
- 16.2.1.3. SWOT Analysis
- 16.2.1.4. Recent Developments
- 16.2.1.5. Financials (Based on Availability)
- 16.2.2 Nouryon
- 16.2.2.1. Overview
- 16.2.2.2. Products
- 16.2.2.3. SWOT Analysis
- 16.2.2.4. Recent Developments
- 16.2.2.5. Financials (Based on Availability)
- 16.2.3 Global Drilling Fluids and Chemicals Limited
- 16.2.3.1. Overview
- 16.2.3.2. Products
- 16.2.3.3. SWOT Analysis
- 16.2.3.4. Recent Developments
- 16.2.3.5. Financials (Based on Availability)
- 16.2.4 Solvay
- 16.2.4.1. Overview
- 16.2.4.2. Products
- 16.2.4.3. SWOT Analysis
- 16.2.4.4. Recent Developments
- 16.2.4.5. Financials (Based on Availability)
- 16.2.5 Newpark Resources Inc
- 16.2.5.1. Overview
- 16.2.5.2. Products
- 16.2.5.3. SWOT Analysis
- 16.2.5.4. Recent Developments
- 16.2.5.5. Financials (Based on Availability)
- 16.2.6 Kemira OYJ
- 16.2.6.1. Overview
- 16.2.6.2. Products
- 16.2.6.3. SWOT Analysis
- 16.2.6.4. Recent Developments
- 16.2.6.5. Financials (Based on Availability)
- 16.2.7 BASF SE
- 16.2.7.1. Overview
- 16.2.7.2. Products
- 16.2.7.3. SWOT Analysis
- 16.2.7.4. Recent Developments
- 16.2.7.5. Financials (Based on Availability)
- 16.2.8 Tytan Organics Pvt Ltd
- 16.2.8.1. Overview
- 16.2.8.2. Products
- 16.2.8.3. SWOT Analysis
- 16.2.8.4. Recent Developments
- 16.2.8.5. Financials (Based on Availability)
- 16.2.9 Halliburton
- 16.2.9.1. Overview
- 16.2.9.2. Products
- 16.2.9.3. SWOT Analysis
- 16.2.9.4. Recent Developments
- 16.2.9.5. Financials (Based on Availability)
- 16.2.10 Schlumberger Limited
- 16.2.10.1. Overview
- 16.2.10.2. Products
- 16.2.10.3. SWOT Analysis
- 16.2.10.4. Recent Developments
- 16.2.10.5. Financials (Based on Availability)
- 16.2.1 Clariant
List of Figures
- Figure 1: Global Fluid Loss Additive Market Revenue Breakdown (Million, %) by Region 2024 & 2032
- Figure 2: Global Fluid Loss Additive Market Volume Breakdown (kg/m3, %) by Region 2024 & 2032
- Figure 3: Asia Pacific Fluid Loss Additive Market Revenue (Million), by Country 2024 & 2032
- Figure 4: Asia Pacific Fluid Loss Additive Market Volume (kg/m3), by Country 2024 & 2032
- Figure 5: Asia Pacific Fluid Loss Additive Market Revenue Share (%), by Country 2024 & 2032
- Figure 6: Asia Pacific Fluid Loss Additive Market Volume Share (%), by Country 2024 & 2032
- Figure 7: North America Fluid Loss Additive Market Revenue (Million), by Country 2024 & 2032
- Figure 8: North America Fluid Loss Additive Market Volume (kg/m3), by Country 2024 & 2032
- Figure 9: North America Fluid Loss Additive Market Revenue Share (%), by Country 2024 & 2032
- Figure 10: North America Fluid Loss Additive Market Volume Share (%), by Country 2024 & 2032
- Figure 11: Europe Fluid Loss Additive Market Revenue (Million), by Country 2024 & 2032
- Figure 12: Europe Fluid Loss Additive Market Volume (kg/m3), by Country 2024 & 2032
- Figure 13: Europe Fluid Loss Additive Market Revenue Share (%), by Country 2024 & 2032
- Figure 14: Europe Fluid Loss Additive Market Volume Share (%), by Country 2024 & 2032
- Figure 15: South America Fluid Loss Additive Market Revenue (Million), by Country 2024 & 2032
- Figure 16: South America Fluid Loss Additive Market Volume (kg/m3), by Country 2024 & 2032
- Figure 17: South America Fluid Loss Additive Market Revenue Share (%), by Country 2024 & 2032
- Figure 18: South America Fluid Loss Additive Market Volume Share (%), by Country 2024 & 2032
- Figure 19: Middle East and Africa Fluid Loss Additive Market Revenue (Million), by Country 2024 & 2032
- Figure 20: Middle East and Africa Fluid Loss Additive Market Volume (kg/m3), by Country 2024 & 2032
- Figure 21: Middle East and Africa Fluid Loss Additive Market Revenue Share (%), by Country 2024 & 2032
- Figure 22: Middle East and Africa Fluid Loss Additive Market Volume Share (%), by Country 2024 & 2032
- Figure 23: Asia Pacific Fluid Loss Additive Market Revenue (Million), by Additive Type 2024 & 2032
- Figure 24: Asia Pacific Fluid Loss Additive Market Volume (kg/m3), by Additive Type 2024 & 2032
- Figure 25: Asia Pacific Fluid Loss Additive Market Revenue Share (%), by Additive Type 2024 & 2032
- Figure 26: Asia Pacific Fluid Loss Additive Market Volume Share (%), by Additive Type 2024 & 2032
- Figure 27: Asia Pacific Fluid Loss Additive Market Revenue (Million), by Application 2024 & 2032
- Figure 28: Asia Pacific Fluid Loss Additive Market Volume (kg/m3), by Application 2024 & 2032
- Figure 29: Asia Pacific Fluid Loss Additive Market Revenue Share (%), by Application 2024 & 2032
- Figure 30: Asia Pacific Fluid Loss Additive Market Volume Share (%), by Application 2024 & 2032
- Figure 31: Asia Pacific Fluid Loss Additive Market Revenue (Million), by Country 2024 & 2032
- Figure 32: Asia Pacific Fluid Loss Additive Market Volume (kg/m3), by Country 2024 & 2032
- Figure 33: Asia Pacific Fluid Loss Additive Market Revenue Share (%), by Country 2024 & 2032
- Figure 34: Asia Pacific Fluid Loss Additive Market Volume Share (%), by Country 2024 & 2032
- Figure 35: North America Fluid Loss Additive Market Revenue (Million), by Additive Type 2024 & 2032
- Figure 36: North America Fluid Loss Additive Market Volume (kg/m3), by Additive Type 2024 & 2032
- Figure 37: North America Fluid Loss Additive Market Revenue Share (%), by Additive Type 2024 & 2032
- Figure 38: North America Fluid Loss Additive Market Volume Share (%), by Additive Type 2024 & 2032
- Figure 39: North America Fluid Loss Additive Market Revenue (Million), by Application 2024 & 2032
- Figure 40: North America Fluid Loss Additive Market Volume (kg/m3), by Application 2024 & 2032
- Figure 41: North America Fluid Loss Additive Market Revenue Share (%), by Application 2024 & 2032
- Figure 42: North America Fluid Loss Additive Market Volume Share (%), by Application 2024 & 2032
- Figure 43: North America Fluid Loss Additive Market Revenue (Million), by Country 2024 & 2032
- Figure 44: North America Fluid Loss Additive Market Volume (kg/m3), by Country 2024 & 2032
- Figure 45: North America Fluid Loss Additive Market Revenue Share (%), by Country 2024 & 2032
- Figure 46: North America Fluid Loss Additive Market Volume Share (%), by Country 2024 & 2032
- Figure 47: Europe Fluid Loss Additive Market Revenue (Million), by Additive Type 2024 & 2032
- Figure 48: Europe Fluid Loss Additive Market Volume (kg/m3), by Additive Type 2024 & 2032
- Figure 49: Europe Fluid Loss Additive Market Revenue Share (%), by Additive Type 2024 & 2032
- Figure 50: Europe Fluid Loss Additive Market Volume Share (%), by Additive Type 2024 & 2032
- Figure 51: Europe Fluid Loss Additive Market Revenue (Million), by Application 2024 & 2032
- Figure 52: Europe Fluid Loss Additive Market Volume (kg/m3), by Application 2024 & 2032
- Figure 53: Europe Fluid Loss Additive Market Revenue Share (%), by Application 2024 & 2032
- Figure 54: Europe Fluid Loss Additive Market Volume Share (%), by Application 2024 & 2032
- Figure 55: Europe Fluid Loss Additive Market Revenue (Million), by Country 2024 & 2032
- Figure 56: Europe Fluid Loss Additive Market Volume (kg/m3), by Country 2024 & 2032
- Figure 57: Europe Fluid Loss Additive Market Revenue Share (%), by Country 2024 & 2032
- Figure 58: Europe Fluid Loss Additive Market Volume Share (%), by Country 2024 & 2032
- Figure 59: South America Fluid Loss Additive Market Revenue (Million), by Additive Type 2024 & 2032
- Figure 60: South America Fluid Loss Additive Market Volume (kg/m3), by Additive Type 2024 & 2032
- Figure 61: South America Fluid Loss Additive Market Revenue Share (%), by Additive Type 2024 & 2032
- Figure 62: South America Fluid Loss Additive Market Volume Share (%), by Additive Type 2024 & 2032
- Figure 63: South America Fluid Loss Additive Market Revenue (Million), by Application 2024 & 2032
- Figure 64: South America Fluid Loss Additive Market Volume (kg/m3), by Application 2024 & 2032
- Figure 65: South America Fluid Loss Additive Market Revenue Share (%), by Application 2024 & 2032
- Figure 66: South America Fluid Loss Additive Market Volume Share (%), by Application 2024 & 2032
- Figure 67: South America Fluid Loss Additive Market Revenue (Million), by Country 2024 & 2032
- Figure 68: South America Fluid Loss Additive Market Volume (kg/m3), by Country 2024 & 2032
- Figure 69: South America Fluid Loss Additive Market Revenue Share (%), by Country 2024 & 2032
- Figure 70: South America Fluid Loss Additive Market Volume Share (%), by Country 2024 & 2032
- Figure 71: Middle East and Africa Fluid Loss Additive Market Revenue (Million), by Additive Type 2024 & 2032
- Figure 72: Middle East and Africa Fluid Loss Additive Market Volume (kg/m3), by Additive Type 2024 & 2032
- Figure 73: Middle East and Africa Fluid Loss Additive Market Revenue Share (%), by Additive Type 2024 & 2032
- Figure 74: Middle East and Africa Fluid Loss Additive Market Volume Share (%), by Additive Type 2024 & 2032
- Figure 75: Middle East and Africa Fluid Loss Additive Market Revenue (Million), by Application 2024 & 2032
- Figure 76: Middle East and Africa Fluid Loss Additive Market Volume (kg/m3), by Application 2024 & 2032
- Figure 77: Middle East and Africa Fluid Loss Additive Market Revenue Share (%), by Application 2024 & 2032
- Figure 78: Middle East and Africa Fluid Loss Additive Market Volume Share (%), by Application 2024 & 2032
- Figure 79: Middle East and Africa Fluid Loss Additive Market Revenue (Million), by Country 2024 & 2032
- Figure 80: Middle East and Africa Fluid Loss Additive Market Volume (kg/m3), by Country 2024 & 2032
- Figure 81: Middle East and Africa Fluid Loss Additive Market Revenue Share (%), by Country 2024 & 2032
- Figure 82: Middle East and Africa Fluid Loss Additive Market Volume Share (%), by Country 2024 & 2032
List of Tables
- Table 1: Global Fluid Loss Additive Market Revenue Million Forecast, by Region 2019 & 2032
- Table 2: Global Fluid Loss Additive Market Volume kg/m3 Forecast, by Region 2019 & 2032
- Table 3: Global Fluid Loss Additive Market Revenue Million Forecast, by Additive Type 2019 & 2032
- Table 4: Global Fluid Loss Additive Market Volume kg/m3 Forecast, by Additive Type 2019 & 2032
- Table 5: Global Fluid Loss Additive Market Revenue Million Forecast, by Application 2019 & 2032
- Table 6: Global Fluid Loss Additive Market Volume kg/m3 Forecast, by Application 2019 & 2032
- Table 7: Global Fluid Loss Additive Market Revenue Million Forecast, by Region 2019 & 2032
- Table 8: Global Fluid Loss Additive Market Volume kg/m3 Forecast, by Region 2019 & 2032
- Table 9: Global Fluid Loss Additive Market Revenue Million Forecast, by Country 2019 & 2032
- Table 10: Global Fluid Loss Additive Market Volume kg/m3 Forecast, by Country 2019 & 2032
- Table 11: China Fluid Loss Additive Market Revenue (Million) Forecast, by Application 2019 & 2032
- Table 12: China Fluid Loss Additive Market Volume (kg/m3) Forecast, by Application 2019 & 2032
- Table 13: India Fluid Loss Additive Market Revenue (Million) Forecast, by Application 2019 & 2032
- Table 14: India Fluid Loss Additive Market Volume (kg/m3) Forecast, by Application 2019 & 2032
- Table 15: Japan Fluid Loss Additive Market Revenue (Million) Forecast, by Application 2019 & 2032
- Table 16: Japan Fluid Loss Additive Market Volume (kg/m3) Forecast, by Application 2019 & 2032
- Table 17: South Korea Fluid Loss Additive Market Revenue (Million) Forecast, by Application 2019 & 2032
- Table 18: South Korea Fluid Loss Additive Market Volume (kg/m3) Forecast, by Application 2019 & 2032
- Table 19: Rest of Asia Pacific Fluid Loss Additive Market Revenue (Million) Forecast, by Application 2019 & 2032
- Table 20: Rest of Asia Pacific Fluid Loss Additive Market Volume (kg/m3) Forecast, by Application 2019 & 2032
- Table 21: Global Fluid Loss Additive Market Revenue Million Forecast, by Country 2019 & 2032
- Table 22: Global Fluid Loss Additive Market Volume kg/m3 Forecast, by Country 2019 & 2032
- Table 23: United States Fluid Loss Additive Market Revenue (Million) Forecast, by Application 2019 & 2032
- Table 24: United States Fluid Loss Additive Market Volume (kg/m3) Forecast, by Application 2019 & 2032
- Table 25: Canada Fluid Loss Additive Market Revenue (Million) Forecast, by Application 2019 & 2032
- Table 26: Canada Fluid Loss Additive Market Volume (kg/m3) Forecast, by Application 2019 & 2032
- Table 27: Mexico Fluid Loss Additive Market Revenue (Million) Forecast, by Application 2019 & 2032
- Table 28: Mexico Fluid Loss Additive Market Volume (kg/m3) Forecast, by Application 2019 & 2032
- Table 29: Global Fluid Loss Additive Market Revenue Million Forecast, by Country 2019 & 2032
- Table 30: Global Fluid Loss Additive Market Volume kg/m3 Forecast, by Country 2019 & 2032
- Table 31: Germany Fluid Loss Additive Market Revenue (Million) Forecast, by Application 2019 & 2032
- Table 32: Germany Fluid Loss Additive Market Volume (kg/m3) Forecast, by Application 2019 & 2032
- Table 33: United Kingdom Fluid Loss Additive Market Revenue (Million) Forecast, by Application 2019 & 2032
- Table 34: United Kingdom Fluid Loss Additive Market Volume (kg/m3) Forecast, by Application 2019 & 2032
- Table 35: France Fluid Loss Additive Market Revenue (Million) Forecast, by Application 2019 & 2032
- Table 36: France Fluid Loss Additive Market Volume (kg/m3) Forecast, by Application 2019 & 2032
- Table 37: Italy Fluid Loss Additive Market Revenue (Million) Forecast, by Application 2019 & 2032
- Table 38: Italy Fluid Loss Additive Market Volume (kg/m3) Forecast, by Application 2019 & 2032
- Table 39: Rest of Europe Fluid Loss Additive Market Revenue (Million) Forecast, by Application 2019 & 2032
- Table 40: Rest of Europe Fluid Loss Additive Market Volume (kg/m3) Forecast, by Application 2019 & 2032
- Table 41: Global Fluid Loss Additive Market Revenue Million Forecast, by Country 2019 & 2032
- Table 42: Global Fluid Loss Additive Market Volume kg/m3 Forecast, by Country 2019 & 2032
- Table 43: Brazil Fluid Loss Additive Market Revenue (Million) Forecast, by Application 2019 & 2032
- Table 44: Brazil Fluid Loss Additive Market Volume (kg/m3) Forecast, by Application 2019 & 2032
- Table 45: Argentina Fluid Loss Additive Market Revenue (Million) Forecast, by Application 2019 & 2032
- Table 46: Argentina Fluid Loss Additive Market Volume (kg/m3) Forecast, by Application 2019 & 2032
- Table 47: Rest of South America Fluid Loss Additive Market Revenue (Million) Forecast, by Application 2019 & 2032
- Table 48: Rest of South America Fluid Loss Additive Market Volume (kg/m3) Forecast, by Application 2019 & 2032
- Table 49: Global Fluid Loss Additive Market Revenue Million Forecast, by Country 2019 & 2032
- Table 50: Global Fluid Loss Additive Market Volume kg/m3 Forecast, by Country 2019 & 2032
- Table 51: Saudi Arabia Fluid Loss Additive Market Revenue (Million) Forecast, by Application 2019 & 2032
- Table 52: Saudi Arabia Fluid Loss Additive Market Volume (kg/m3) Forecast, by Application 2019 & 2032
- Table 53: South Africa Fluid Loss Additive Market Revenue (Million) Forecast, by Application 2019 & 2032
- Table 54: South Africa Fluid Loss Additive Market Volume (kg/m3) Forecast, by Application 2019 & 2032
- Table 55: Rest of Middle East and Africa Fluid Loss Additive Market Revenue (Million) Forecast, by Application 2019 & 2032
- Table 56: Rest of Middle East and Africa Fluid Loss Additive Market Volume (kg/m3) Forecast, by Application 2019 & 2032
- Table 57: Global Fluid Loss Additive Market Revenue Million Forecast, by Additive Type 2019 & 2032
- Table 58: Global Fluid Loss Additive Market Volume kg/m3 Forecast, by Additive Type 2019 & 2032
- Table 59: Global Fluid Loss Additive Market Revenue Million Forecast, by Application 2019 & 2032
- Table 60: Global Fluid Loss Additive Market Volume kg/m3 Forecast, by Application 2019 & 2032
- Table 61: Global Fluid Loss Additive Market Revenue Million Forecast, by Country 2019 & 2032
- Table 62: Global Fluid Loss Additive Market Volume kg/m3 Forecast, by Country 2019 & 2032
- Table 63: China Fluid Loss Additive Market Revenue (Million) Forecast, by Application 2019 & 2032
- Table 64: China Fluid Loss Additive Market Volume (kg/m3) Forecast, by Application 2019 & 2032
- Table 65: India Fluid Loss Additive Market Revenue (Million) Forecast, by Application 2019 & 2032
- Table 66: India Fluid Loss Additive Market Volume (kg/m3) Forecast, by Application 2019 & 2032
- Table 67: Japan Fluid Loss Additive Market Revenue (Million) Forecast, by Application 2019 & 2032
- Table 68: Japan Fluid Loss Additive Market Volume (kg/m3) Forecast, by Application 2019 & 2032
- Table 69: South Korea Fluid Loss Additive Market Revenue (Million) Forecast, by Application 2019 & 2032
- Table 70: South Korea Fluid Loss Additive Market Volume (kg/m3) Forecast, by Application 2019 & 2032
- Table 71: Rest of Asia Pacific Fluid Loss Additive Market Revenue (Million) Forecast, by Application 2019 & 2032
- Table 72: Rest of Asia Pacific Fluid Loss Additive Market Volume (kg/m3) Forecast, by Application 2019 & 2032
- Table 73: Global Fluid Loss Additive Market Revenue Million Forecast, by Additive Type 2019 & 2032
- Table 74: Global Fluid Loss Additive Market Volume kg/m3 Forecast, by Additive Type 2019 & 2032
- Table 75: Global Fluid Loss Additive Market Revenue Million Forecast, by Application 2019 & 2032
- Table 76: Global Fluid Loss Additive Market Volume kg/m3 Forecast, by Application 2019 & 2032
- Table 77: Global Fluid Loss Additive Market Revenue Million Forecast, by Country 2019 & 2032
- Table 78: Global Fluid Loss Additive Market Volume kg/m3 Forecast, by Country 2019 & 2032
- Table 79: United States Fluid Loss Additive Market Revenue (Million) Forecast, by Application 2019 & 2032
- Table 80: United States Fluid Loss Additive Market Volume (kg/m3) Forecast, by Application 2019 & 2032
- Table 81: Canada Fluid Loss Additive Market Revenue (Million) Forecast, by Application 2019 & 2032
- Table 82: Canada Fluid Loss Additive Market Volume (kg/m3) Forecast, by Application 2019 & 2032
- Table 83: Mexico Fluid Loss Additive Market Revenue (Million) Forecast, by Application 2019 & 2032
- Table 84: Mexico Fluid Loss Additive Market Volume (kg/m3) Forecast, by Application 2019 & 2032
- Table 85: Global Fluid Loss Additive Market Revenue Million Forecast, by Additive Type 2019 & 2032
- Table 86: Global Fluid Loss Additive Market Volume kg/m3 Forecast, by Additive Type 2019 & 2032
- Table 87: Global Fluid Loss Additive Market Revenue Million Forecast, by Application 2019 & 2032
- Table 88: Global Fluid Loss Additive Market Volume kg/m3 Forecast, by Application 2019 & 2032
- Table 89: Global Fluid Loss Additive Market Revenue Million Forecast, by Country 2019 & 2032
- Table 90: Global Fluid Loss Additive Market Volume kg/m3 Forecast, by Country 2019 & 2032
- Table 91: Germany Fluid Loss Additive Market Revenue (Million) Forecast, by Application 2019 & 2032
- Table 92: Germany Fluid Loss Additive Market Volume (kg/m3) Forecast, by Application 2019 & 2032
- Table 93: United Kingdom Fluid Loss Additive Market Revenue (Million) Forecast, by Application 2019 & 2032
- Table 94: United Kingdom Fluid Loss Additive Market Volume (kg/m3) Forecast, by Application 2019 & 2032
- Table 95: France Fluid Loss Additive Market Revenue (Million) Forecast, by Application 2019 & 2032
- Table 96: France Fluid Loss Additive Market Volume (kg/m3) Forecast, by Application 2019 & 2032
- Table 97: Italy Fluid Loss Additive Market Revenue (Million) Forecast, by Application 2019 & 2032
- Table 98: Italy Fluid Loss Additive Market Volume (kg/m3) Forecast, by Application 2019 & 2032
- Table 99: Rest of Europe Fluid Loss Additive Market Revenue (Million) Forecast, by Application 2019 & 2032
- Table 100: Rest of Europe Fluid Loss Additive Market Volume (kg/m3) Forecast, by Application 2019 & 2032
- Table 101: Global Fluid Loss Additive Market Revenue Million Forecast, by Additive Type 2019 & 2032
- Table 102: Global Fluid Loss Additive Market Volume kg/m3 Forecast, by Additive Type 2019 & 2032
- Table 103: Global Fluid Loss Additive Market Revenue Million Forecast, by Application 2019 & 2032
- Table 104: Global Fluid Loss Additive Market Volume kg/m3 Forecast, by Application 2019 & 2032
- Table 105: Global Fluid Loss Additive Market Revenue Million Forecast, by Country 2019 & 2032
- Table 106: Global Fluid Loss Additive Market Volume kg/m3 Forecast, by Country 2019 & 2032
- Table 107: Brazil Fluid Loss Additive Market Revenue (Million) Forecast, by Application 2019 & 2032
- Table 108: Brazil Fluid Loss Additive Market Volume (kg/m3) Forecast, by Application 2019 & 2032
- Table 109: Argentina Fluid Loss Additive Market Revenue (Million) Forecast, by Application 2019 & 2032
- Table 110: Argentina Fluid Loss Additive Market Volume (kg/m3) Forecast, by Application 2019 & 2032
- Table 111: Rest of South America Fluid Loss Additive Market Revenue (Million) Forecast, by Application 2019 & 2032
- Table 112: Rest of South America Fluid Loss Additive Market Volume (kg/m3) Forecast, by Application 2019 & 2032
- Table 113: Global Fluid Loss Additive Market Revenue Million Forecast, by Additive Type 2019 & 2032
- Table 114: Global Fluid Loss Additive Market Volume kg/m3 Forecast, by Additive Type 2019 & 2032
- Table 115: Global Fluid Loss Additive Market Revenue Million Forecast, by Application 2019 & 2032
- Table 116: Global Fluid Loss Additive Market Volume kg/m3 Forecast, by Application 2019 & 2032
- Table 117: Global Fluid Loss Additive Market Revenue Million Forecast, by Country 2019 & 2032
- Table 118: Global Fluid Loss Additive Market Volume kg/m3 Forecast, by Country 2019 & 2032
- Table 119: Saudi Arabia Fluid Loss Additive Market Revenue (Million) Forecast, by Application 2019 & 2032
- Table 120: Saudi Arabia Fluid Loss Additive Market Volume (kg/m3) Forecast, by Application 2019 & 2032
- Table 121: South Africa Fluid Loss Additive Market Revenue (Million) Forecast, by Application 2019 & 2032
- Table 122: South Africa Fluid Loss Additive Market Volume (kg/m3) Forecast, by Application 2019 & 2032
- Table 123: Rest of Middle East and Africa Fluid Loss Additive Market Revenue (Million) Forecast, by Application 2019 & 2032
- Table 124: Rest of Middle East and Africa Fluid Loss Additive Market Volume (kg/m3) Forecast, by Application 2019 & 2032
Frequently Asked Questions
1. What is the projected Compound Annual Growth Rate (CAGR) of the Fluid Loss Additive Market?
The projected CAGR is approximately > 3.00%.
2. Which companies are prominent players in the Fluid Loss Additive Market?
Key companies in the market include Clariant, Nouryon, Global Drilling Fluids and Chemicals Limited, Solvay, Newpark Resources Inc, Kemira OYJ, BASF SE, Tytan Organics Pvt Ltd, Halliburton, Schlumberger Limited.
3. What are the main segments of the Fluid Loss Additive Market?
The market segments include Additive Type, Application.
4. Can you provide details about the market size?
The market size is estimated to be USD XX Million as of 2022.
5. What are some drivers contributing to market growth?
; Increase in Shale Gas Exploration; Increasing Investments in the Latest and Unconventional Drilling Technologies.
6. What are the notable trends driving market growth?
Drilling Fluid Application to Dominate the Market.
7. Are there any restraints impacting market growth?
; Growing Demand for Electric Vehicles; Harmful Impact on Environment.
8. Can you provide examples of recent developments in the market?
N/A
9. What pricing options are available for accessing the report?
Pricing options include single-user, multi-user, and enterprise licenses priced at USD 4750, USD 5250, and USD 8750 respectively.
10. Is the market size provided in terms of value or volume?
The market size is provided in terms of value, measured in Million and volume, measured in kg/m3.
11. Are there any specific market keywords associated with the report?
Yes, the market keyword associated with the report is "Fluid Loss Additive Market," which aids in identifying and referencing the specific market segment covered.
12. How do I determine which pricing option suits my needs best?
The pricing options vary based on user requirements and access needs. Individual users may opt for single-user licenses, while businesses requiring broader access may choose multi-user or enterprise licenses for cost-effective access to the report.
13. Are there any additional resources or data provided in the Fluid Loss Additive Market report?
While the report offers comprehensive insights, it's advisable to review the specific contents or supplementary materials provided to ascertain if additional resources or data are available.
14. How can I stay updated on further developments or reports in the Fluid Loss Additive Market?
To stay informed about further developments, trends, and reports in the Fluid Loss Additive Market, consider subscribing to industry newsletters, following relevant companies and organizations, or regularly checking reputable industry news sources and publications.
Methodology
Step 1 - Identification of Relevant Samples Size from Population Database


Step 2 - Approaches for Defining Global Market Size (Value, Volume* & Price*)

Note*: In applicable scenarios
Step 3 - Data Sources
Primary Research
- Web Analytics
- Survey Reports
- Research Institute
- Latest Research Reports
- Opinion Leaders
Secondary Research
- Annual Reports
- White Paper
- Latest Press Release
- Industry Association
- Paid Database
- Investor Presentations

Step 4 - Data Triangulation
Involves using different sources of information in order to increase the validity of a study
These sources are likely to be stakeholders in a program - participants, other researchers, program staff, other community members, and so on.
Then we put all data in single framework & apply various statistical tools to find out the dynamic on the market.
During the analysis stage, feedback from the stakeholder groups would be compared to determine areas of agreement as well as areas of divergence


