
Key Insights
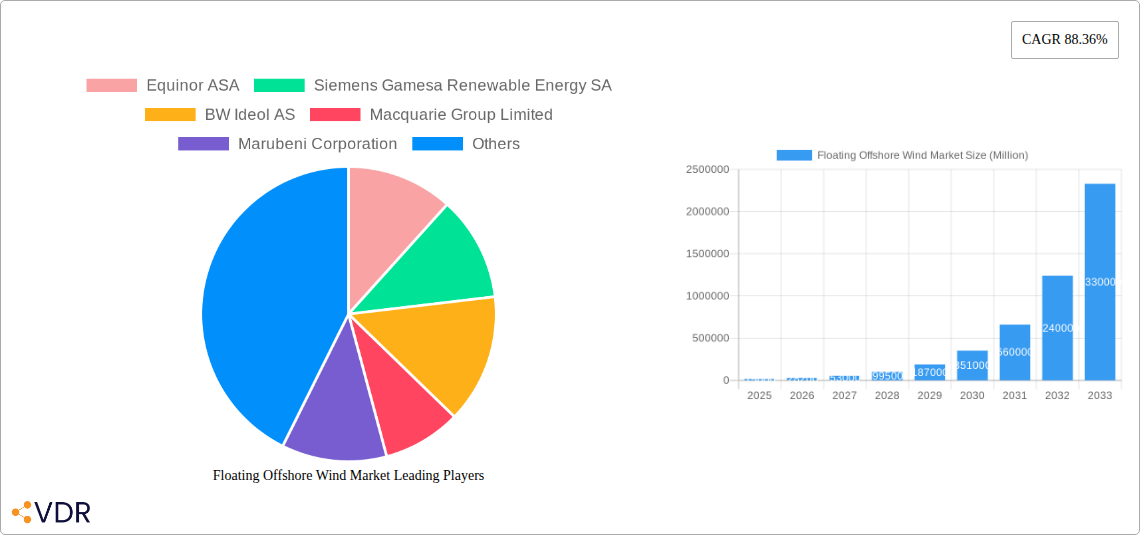
The global floating offshore wind market is experiencing explosive growth, projected to reach a substantial size driven by several key factors. The 88.36% CAGR indicates a remarkably fast expansion, largely fueled by increasing demand for renewable energy, depleting fossil fuel reserves, and supportive government policies promoting clean energy transition globally. Technological advancements leading to improved turbine designs, reduced costs, and increased efficiency are also significant drivers. The market segmentation by water depth highlights the potential for significant growth across different areas, with deep-water installations expected to contribute substantially in the coming years. This is because deep-water locations offer vast untapped wind resources previously inaccessible to traditional fixed-bottom wind farms. The major players, including Equinor ASA, Siemens Gamesa Renewable Energy SA, and Vestas Wind Systems AS, are heavily investing in R&D and project development, further accelerating market expansion. Geographic expansion is also a crucial element, with significant potential in regions like North America, Europe, and Asia-Pacific, where supportive regulatory frameworks and substantial offshore wind resources coexist. While challenges remain, such as the high initial investment costs and technical complexities of floating platforms, the overall market outlook remains highly positive, suggesting sustained growth throughout the forecast period.
The market's growth trajectory will likely see some moderation post the initial surge, as the market matures and experiences a period of consolidation. However, continued technological innovation, streamlined installation processes, and a growing understanding of the economic viability of floating offshore wind will ensure continued expansion. The competition among key players will likely intensify, driving further cost reductions and technological advancements. Regional variations in growth will be influenced by factors such as government support, grid infrastructure development, and the availability of suitable offshore sites. Regions with strong government commitment to renewable energy targets and robust regulatory environments are likely to witness more accelerated growth. The focus will increasingly shift towards optimizing the entire value chain, encompassing project financing, permitting processes, and supply chain management, to enhance overall efficiency and reduce the cost of energy. The long-term outlook for the floating offshore wind market is exceptionally promising, positioning it as a key contributor to the global shift towards sustainable energy sources.
Floating Offshore Wind Market: A Comprehensive Report (2019-2033)
This comprehensive report provides an in-depth analysis of the Floating Offshore Wind market, encompassing market dynamics, growth trends, regional analysis, product landscape, key players, and future outlook. The study covers the period 2019-2033, with a base year of 2025 and a forecast period of 2025-2033. This report is crucial for industry professionals, investors, and strategic decision-makers seeking a thorough understanding of this rapidly evolving sector. The parent market is the broader renewable energy sector, while the child market is specifically floating offshore wind technology and its applications. The market size is expected to reach xx Million by 2033.
Floating Offshore Wind Market Market Dynamics & Structure
The Floating Offshore Wind market is characterized by a moderately concentrated landscape with a few dominant players and a growing number of emerging companies. Technological innovation, particularly in mooring systems and turbine designs, is a key driver, alongside supportive government policies and regulations aimed at decarbonizing the energy sector. The market faces competition from other renewable energy sources, such as onshore wind and solar, but the unique advantage of accessing deeper offshore wind resources drives significant growth. Mergers and acquisitions (M&A) activity is increasing, with larger players consolidating their market share and smaller companies seeking strategic partnerships for growth.
- Market Concentration: Moderately concentrated, with top 5 players holding approximately xx% market share in 2025.
- Technological Innovation: Focus on improving turbine efficiency, reducing costs of floating platforms, and developing advanced mooring systems.
- Regulatory Framework: Government subsidies, tax incentives, and streamlined permitting processes are essential drivers. Varied regulations across different regions present challenges.
- Competitive Substitutes: Onshore wind, solar PV, and traditional fossil fuels.
- End-User Demographics: Primarily utilities and energy companies, along with independent power producers (IPPs).
- M&A Trends: Increased M&A activity reflects the industry's consolidation and the need for capital investment in large-scale projects. The number of M&A deals in the last 5 years is estimated at xx.
Floating Offshore Wind Market Growth Trends & Insights
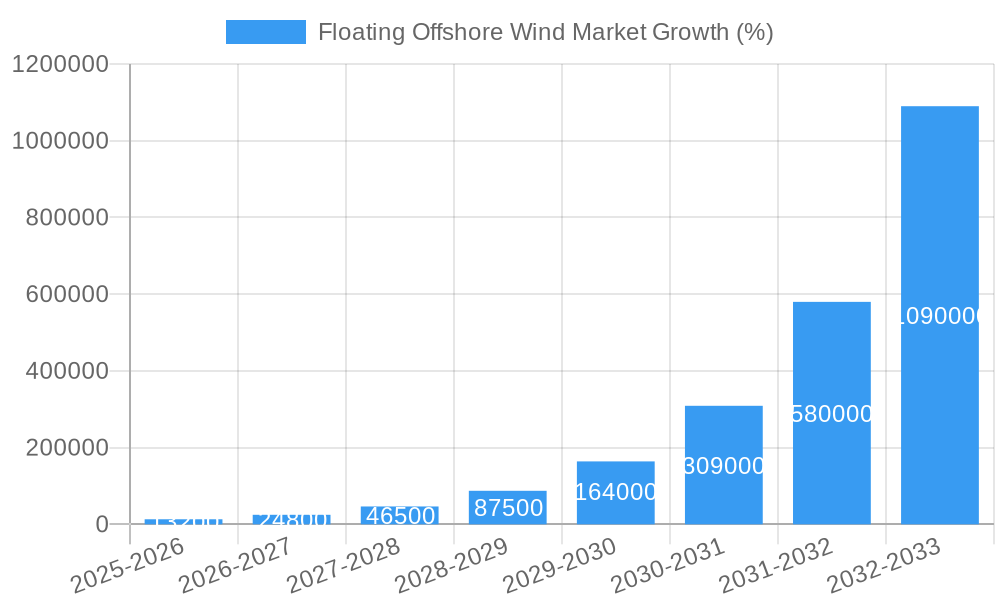
The Floating Offshore Wind market experienced significant growth between 2019 and 2024, driven by factors such as increasing demand for renewable energy, technological advancements, and supportive government policies. The market is projected to maintain a strong Compound Annual Growth Rate (CAGR) of xx% during the forecast period (2025-2033), reaching a market size of xx Million by 2033. This growth is fueled by expanding deployment in deeper waters, cost reductions in floating platforms, and an increasing number of large-scale projects. Market penetration is expected to increase significantly, with a growing number of countries embracing floating offshore wind technology as part of their renewable energy targets. Technological disruptions are streamlining the entire value chain, from design to installation and operation, making the projects more economically viable. The evolving consumer behavior towards a greener energy landscape further fuels this growth.
Dominant Regions, Countries, or Segments in Floating Offshore Wind Market
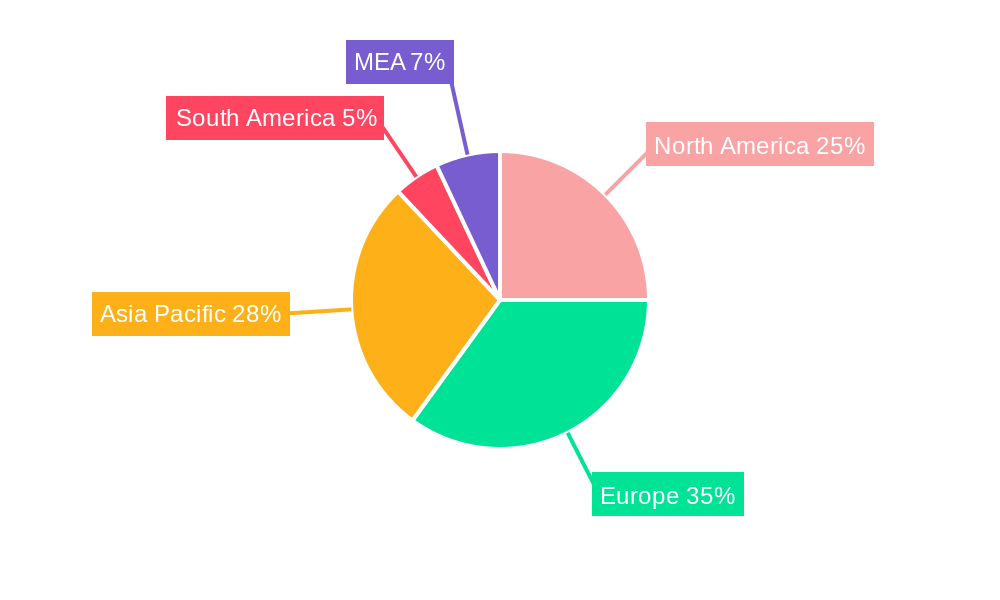
The Floating Offshore Wind market is experiencing significant growth across various regions, with Europe currently leading the market due to supportive policy frameworks and substantial offshore wind resources. Specifically, the UK, Norway, and Scotland are at the forefront. Asia Pacific is poised for substantial growth, driven by increasing energy demand and government initiatives in countries like Japan, South Korea, and China. The Americas are also witnessing growing adoption, driven mainly by initiatives in the United States and some countries in Latin America. While qualitative analysis shows each water depth is significant, the dominance shifts with technological advancements. Shallow water projects are more mature, and transitional and deep-water segments are experiencing fast growth, offering vast untapped potential.
- Europe: Strong policy support, abundant resources, and technological leadership drive significant growth.
- Asia Pacific: High energy demand, government incentives, and technological advancements contribute to rapid market expansion.
- Americas: Growing interest in renewable energy, combined with technological developments, fuels market growth.
- Water Depth Segments: Shallow water projects demonstrate a larger installed capacity, but deep water presents enormous future potential.
Floating Offshore Wind Market Product Landscape
The floating offshore wind market features a diverse range of products, including various floating platform designs (spar buoys, tension leg platforms, semi-submersibles), wind turbines with advanced features to maximize energy capture, and sophisticated subsea cable and grid connection technologies. Product innovation focuses on improving turbine efficiency, enhancing platform stability in challenging weather conditions, and reducing overall system costs. The unique selling propositions center around enhanced energy yield from deeper water sites, reduced environmental impact compared to onshore wind farms, and grid-integration solutions enabling a seamless transition to clean energy.
Key Drivers, Barriers & Challenges in Floating Offshore Wind Market
Key Drivers:
- Increasing demand for renewable energy sources to combat climate change.
- Technological advancements that reduce costs and improve efficiency.
- Supportive government policies and regulations, including subsidies and tax incentives.
- Expanding access to offshore wind resources in deeper waters.
Key Barriers and Challenges:
- High capital costs associated with project development and deployment.
- Technological risks and challenges related to operation and maintenance in harsh marine environments.
- Regulatory complexities and permitting processes, differing widely between regions.
- Supply chain constraints and potential resource bottlenecks.
- Intermittency and variability of wind power generation.
Emerging Opportunities in Floating Offshore Wind Market
The floating offshore wind market presents several emerging opportunities. These include exploring untapped offshore areas with abundant wind resources, developing innovative floating platform designs for specific geographic and environmental conditions, developing floating wind farms in synergy with other offshore activities such as aquaculture or wave energy projects, creating innovative hybrid energy generation systems, expanding into new geographic markets, exploring innovative financing and investment models to reduce capital costs, and collaborating with other renewable energy industries and stakeholders.
Growth Accelerators in the Floating Offshore Wind Market Industry
The long-term growth of the floating offshore wind market is fueled by several key factors. Continuous technological breakthroughs, leading to reduced capital expenditures and improved operational efficiency, are crucial. Strategic partnerships between technology providers, energy companies, and infrastructure developers accelerate project deployment and facilitate knowledge transfer. Furthermore, the increasing adoption of innovative financing models and government support policies will play a significant role in driving market expansion, enabling more projects to reach financial close. Finally, increased private sector involvement accelerates project development.
Key Players Shaping the Floating Offshore Wind Market Market
- Equinor ASA
- Siemens Gamesa Renewable Energy SA
- BW Ideol AS
- Macquarie Group Limited
- Marubeni Corporation
- Doosan Enerbility Co Ltd
- Vestas Wind Systems AS
- General Electric Company
Notable Milestones in Floating Offshore Wind Market Sector
- April 2024: Octopus Energy invests in Ocergy, boosting global floating offshore wind farm development.
- April 2024: Vårgrønn and Flotation Energy secure planning approval for the Green Volt project, expected to be the first commercial-scale floating wind farm offshore Scotland.
In-Depth Floating Offshore Wind Market Market Outlook
The future of the floating offshore wind market is exceptionally promising. Continued technological advancements, coupled with increasing policy support and falling costs, will significantly expand the market's reach. Strategic partnerships and innovative financing models will unlock further investment, driving large-scale project deployments globally. The market will increasingly tap into previously inaccessible deep-water resources, leading to substantial growth in installed capacity. Opportunities for innovation across various aspects of the value chain, from turbine design to grid integration, will attract further investment and competition, solidifying the sector's position as a vital player in the global transition to renewable energy.
Floating Offshore Wind Market Segmentation
-
1. Water Depth (Qualitative Analysis Only)
- 1.1. Shallow Water (less than 30 m depth)
- 1.2. Transitional Water (30 m to 60 m depth)
- 1.3. Deep Water (higher than 60 m depth)
Floating Offshore Wind Market Segmentation By Geography
-
1. North America
- 1.1. United States
- 1.2. Canada
- 1.3. Rest of North America
-
2. Europe
- 2.1. United Kingdom
- 2.2. Germany
- 2.3. France
- 2.4. Italy
- 2.5. Spain
- 2.6. Nordic Countries
- 2.7. Russia
- 2.8. Rest of Europe
-
3. Asia Pacific
- 3.1. China
- 3.2. India
- 3.3. Japan
- 3.4. Indonesia
- 3.5. Malaysia
- 3.6. Vietnam
- 3.7. Thailand
- 3.8. Rest of Asia Pacific
-
4. South America
- 4.1. Brazil
- 4.2. Argentina
- 4.3. Colombia
- 4.4. Rest of South America
-
5. Middle East and Africa
- 5.1. Saudi Arabia
- 5.2. United Arab Emirates
- 5.3. Egypt
- 5.4. South Africa
- 5.5. Nigeria
- 5.6. Rest of the Middle East and Africa
Floating Offshore Wind Market REPORT HIGHLIGHTS
| Aspects | Details |
|---|---|
| Study Period | 2019-2033 |
| Base Year | 2024 |
| Estimated Year | 2025 |
| Forecast Period | 2025-2033 |
| Historical Period | 2019-2024 |
| Growth Rate | CAGR of 88.36% from 2019-2033 |
| Segmentation |
|
Table of Contents
- 1. Introduction
- 1.1. Research Scope
- 1.2. Market Segmentation
- 1.3. Research Methodology
- 1.4. Definitions and Assumptions
- 2. Executive Summary
- 2.1. Introduction
- 3. Market Dynamics
- 3.1. Introduction
- 3.2. Market Drivers
- 3.2.1. 4.; Rising investments in offshore renewable wind energy projects4.; Advanced and readily accessible offshore wind turbine technologies
- 3.3. Market Restrains
- 3.3.1. 4.; The Increasing Adoption of Alternate Clean Power Sources Such as Solar and Biomass
- 3.4. Market Trends
- 3.4.1. The Transitional Water (30 m to 60 m depth) Segment is Expected to Grow
- 4. Market Factor Analysis
- 4.1. Porters Five Forces
- 4.2. Supply/Value Chain
- 4.3. PESTEL analysis
- 4.4. Market Entropy
- 4.5. Patent/Trademark Analysis
- 5. Global Floating Offshore Wind Market Analysis, Insights and Forecast, 2019-2031
- 5.1. Market Analysis, Insights and Forecast - by Water Depth (Qualitative Analysis Only)
- 5.1.1. Shallow Water (less than 30 m depth)
- 5.1.2. Transitional Water (30 m to 60 m depth)
- 5.1.3. Deep Water (higher than 60 m depth)
- 5.2. Market Analysis, Insights and Forecast - by Region
- 5.2.1. North America
- 5.2.2. Europe
- 5.2.3. Asia Pacific
- 5.2.4. South America
- 5.2.5. Middle East and Africa
- 5.1. Market Analysis, Insights and Forecast - by Water Depth (Qualitative Analysis Only)
- 6. North America Floating Offshore Wind Market Analysis, Insights and Forecast, 2019-2031
- 6.1. Market Analysis, Insights and Forecast - by Water Depth (Qualitative Analysis Only)
- 6.1.1. Shallow Water (less than 30 m depth)
- 6.1.2. Transitional Water (30 m to 60 m depth)
- 6.1.3. Deep Water (higher than 60 m depth)
- 6.1. Market Analysis, Insights and Forecast - by Water Depth (Qualitative Analysis Only)
- 7. Europe Floating Offshore Wind Market Analysis, Insights and Forecast, 2019-2031
- 7.1. Market Analysis, Insights and Forecast - by Water Depth (Qualitative Analysis Only)
- 7.1.1. Shallow Water (less than 30 m depth)
- 7.1.2. Transitional Water (30 m to 60 m depth)
- 7.1.3. Deep Water (higher than 60 m depth)
- 7.1. Market Analysis, Insights and Forecast - by Water Depth (Qualitative Analysis Only)
- 8. Asia Pacific Floating Offshore Wind Market Analysis, Insights and Forecast, 2019-2031
- 8.1. Market Analysis, Insights and Forecast - by Water Depth (Qualitative Analysis Only)
- 8.1.1. Shallow Water (less than 30 m depth)
- 8.1.2. Transitional Water (30 m to 60 m depth)
- 8.1.3. Deep Water (higher than 60 m depth)
- 8.1. Market Analysis, Insights and Forecast - by Water Depth (Qualitative Analysis Only)
- 9. South America Floating Offshore Wind Market Analysis, Insights and Forecast, 2019-2031
- 9.1. Market Analysis, Insights and Forecast - by Water Depth (Qualitative Analysis Only)
- 9.1.1. Shallow Water (less than 30 m depth)
- 9.1.2. Transitional Water (30 m to 60 m depth)
- 9.1.3. Deep Water (higher than 60 m depth)
- 9.1. Market Analysis, Insights and Forecast - by Water Depth (Qualitative Analysis Only)
- 10. Middle East and Africa Floating Offshore Wind Market Analysis, Insights and Forecast, 2019-2031
- 10.1. Market Analysis, Insights and Forecast - by Water Depth (Qualitative Analysis Only)
- 10.1.1. Shallow Water (less than 30 m depth)
- 10.1.2. Transitional Water (30 m to 60 m depth)
- 10.1.3. Deep Water (higher than 60 m depth)
- 10.1. Market Analysis, Insights and Forecast - by Water Depth (Qualitative Analysis Only)
- 11. North America Floating Offshore Wind Market Analysis, Insights and Forecast, 2019-2031
- 11.1. Market Analysis, Insights and Forecast - By Country/Sub-region
- 11.1.1 United States
- 11.1.2 Canada
- 11.1.3 Mexico
- 12. Europe Floating Offshore Wind Market Analysis, Insights and Forecast, 2019-2031
- 12.1. Market Analysis, Insights and Forecast - By Country/Sub-region
- 12.1.1 Germany
- 12.1.2 United Kingdom
- 12.1.3 France
- 12.1.4 Spain
- 12.1.5 Italy
- 12.1.6 Spain
- 12.1.7 Belgium
- 12.1.8 Netherland
- 12.1.9 Nordics
- 12.1.10 Rest of Europe
- 13. Asia Pacific Floating Offshore Wind Market Analysis, Insights and Forecast, 2019-2031
- 13.1. Market Analysis, Insights and Forecast - By Country/Sub-region
- 13.1.1 China
- 13.1.2 Japan
- 13.1.3 India
- 13.1.4 South Korea
- 13.1.5 Southeast Asia
- 13.1.6 Australia
- 13.1.7 Indonesia
- 13.1.8 Phillipes
- 13.1.9 Singapore
- 13.1.10 Thailandc
- 13.1.11 Rest of Asia Pacific
- 14. South America Floating Offshore Wind Market Analysis, Insights and Forecast, 2019-2031
- 14.1. Market Analysis, Insights and Forecast - By Country/Sub-region
- 14.1.1 Brazil
- 14.1.2 Argentina
- 14.1.3 Peru
- 14.1.4 Chile
- 14.1.5 Colombia
- 14.1.6 Ecuador
- 14.1.7 Venezuela
- 14.1.8 Rest of South America
- 15. North America Floating Offshore Wind Market Analysis, Insights and Forecast, 2019-2031
- 15.1. Market Analysis, Insights and Forecast - By Country/Sub-region
- 15.1.1 United States
- 15.1.2 Canada
- 15.1.3 Mexico
- 16. MEA Floating Offshore Wind Market Analysis, Insights and Forecast, 2019-2031
- 16.1. Market Analysis, Insights and Forecast - By Country/Sub-region
- 16.1.1 United Arab Emirates
- 16.1.2 Saudi Arabia
- 16.1.3 South Africa
- 16.1.4 Rest of Middle East and Africa
- 17. Competitive Analysis
- 17.1. Global Market Share Analysis 2024
- 17.2. Company Profiles
- 17.2.1 Equinor ASA
- 17.2.1.1. Overview
- 17.2.1.2. Products
- 17.2.1.3. SWOT Analysis
- 17.2.1.4. Recent Developments
- 17.2.1.5. Financials (Based on Availability)
- 17.2.2 Siemens Gamesa Renewable Energy SA
- 17.2.2.1. Overview
- 17.2.2.2. Products
- 17.2.2.3. SWOT Analysis
- 17.2.2.4. Recent Developments
- 17.2.2.5. Financials (Based on Availability)
- 17.2.3 BW Ideol AS
- 17.2.3.1. Overview
- 17.2.3.2. Products
- 17.2.3.3. SWOT Analysis
- 17.2.3.4. Recent Developments
- 17.2.3.5. Financials (Based on Availability)
- 17.2.4 Macquarie Group Limited
- 17.2.4.1. Overview
- 17.2.4.2. Products
- 17.2.4.3. SWOT Analysis
- 17.2.4.4. Recent Developments
- 17.2.4.5. Financials (Based on Availability)
- 17.2.5 Marubeni Corporation
- 17.2.5.1. Overview
- 17.2.5.2. Products
- 17.2.5.3. SWOT Analysis
- 17.2.5.4. Recent Developments
- 17.2.5.5. Financials (Based on Availability)
- 17.2.6 Doosan Enerbility Co Ltd
- 17.2.6.1. Overview
- 17.2.6.2. Products
- 17.2.6.3. SWOT Analysis
- 17.2.6.4. Recent Developments
- 17.2.6.5. Financials (Based on Availability)
- 17.2.7 Vestas Wind Systems AS
- 17.2.7.1. Overview
- 17.2.7.2. Products
- 17.2.7.3. SWOT Analysis
- 17.2.7.4. Recent Developments
- 17.2.7.5. Financials (Based on Availability)
- 17.2.8 General Electric Company
- 17.2.8.1. Overview
- 17.2.8.2. Products
- 17.2.8.3. SWOT Analysis
- 17.2.8.4. Recent Developments
- 17.2.8.5. Financials (Based on Availability)
- 17.2.1 Equinor ASA
List of Figures
- Figure 1: Global Floating Offshore Wind Market Revenue Breakdown (Million, %) by Region 2024 & 2032
- Figure 2: Global Floating Offshore Wind Market Volume Breakdown (gigawatt, %) by Region 2024 & 2032
- Figure 3: North America Floating Offshore Wind Market Revenue (Million), by Country 2024 & 2032
- Figure 4: North America Floating Offshore Wind Market Volume (gigawatt), by Country 2024 & 2032
- Figure 5: North America Floating Offshore Wind Market Revenue Share (%), by Country 2024 & 2032
- Figure 6: North America Floating Offshore Wind Market Volume Share (%), by Country 2024 & 2032
- Figure 7: Europe Floating Offshore Wind Market Revenue (Million), by Country 2024 & 2032
- Figure 8: Europe Floating Offshore Wind Market Volume (gigawatt), by Country 2024 & 2032
- Figure 9: Europe Floating Offshore Wind Market Revenue Share (%), by Country 2024 & 2032
- Figure 10: Europe Floating Offshore Wind Market Volume Share (%), by Country 2024 & 2032
- Figure 11: Asia Pacific Floating Offshore Wind Market Revenue (Million), by Country 2024 & 2032
- Figure 12: Asia Pacific Floating Offshore Wind Market Volume (gigawatt), by Country 2024 & 2032
- Figure 13: Asia Pacific Floating Offshore Wind Market Revenue Share (%), by Country 2024 & 2032
- Figure 14: Asia Pacific Floating Offshore Wind Market Volume Share (%), by Country 2024 & 2032
- Figure 15: South America Floating Offshore Wind Market Revenue (Million), by Country 2024 & 2032
- Figure 16: South America Floating Offshore Wind Market Volume (gigawatt), by Country 2024 & 2032
- Figure 17: South America Floating Offshore Wind Market Revenue Share (%), by Country 2024 & 2032
- Figure 18: South America Floating Offshore Wind Market Volume Share (%), by Country 2024 & 2032
- Figure 19: North America Floating Offshore Wind Market Revenue (Million), by Country 2024 & 2032
- Figure 20: North America Floating Offshore Wind Market Volume (gigawatt), by Country 2024 & 2032
- Figure 21: North America Floating Offshore Wind Market Revenue Share (%), by Country 2024 & 2032
- Figure 22: North America Floating Offshore Wind Market Volume Share (%), by Country 2024 & 2032
- Figure 23: MEA Floating Offshore Wind Market Revenue (Million), by Country 2024 & 2032
- Figure 24: MEA Floating Offshore Wind Market Volume (gigawatt), by Country 2024 & 2032
- Figure 25: MEA Floating Offshore Wind Market Revenue Share (%), by Country 2024 & 2032
- Figure 26: MEA Floating Offshore Wind Market Volume Share (%), by Country 2024 & 2032
- Figure 27: North America Floating Offshore Wind Market Revenue (Million), by Water Depth (Qualitative Analysis Only) 2024 & 2032
- Figure 28: North America Floating Offshore Wind Market Volume (gigawatt), by Water Depth (Qualitative Analysis Only) 2024 & 2032
- Figure 29: North America Floating Offshore Wind Market Revenue Share (%), by Water Depth (Qualitative Analysis Only) 2024 & 2032
- Figure 30: North America Floating Offshore Wind Market Volume Share (%), by Water Depth (Qualitative Analysis Only) 2024 & 2032
- Figure 31: North America Floating Offshore Wind Market Revenue (Million), by Country 2024 & 2032
- Figure 32: North America Floating Offshore Wind Market Volume (gigawatt), by Country 2024 & 2032
- Figure 33: North America Floating Offshore Wind Market Revenue Share (%), by Country 2024 & 2032
- Figure 34: North America Floating Offshore Wind Market Volume Share (%), by Country 2024 & 2032
- Figure 35: Europe Floating Offshore Wind Market Revenue (Million), by Water Depth (Qualitative Analysis Only) 2024 & 2032
- Figure 36: Europe Floating Offshore Wind Market Volume (gigawatt), by Water Depth (Qualitative Analysis Only) 2024 & 2032
- Figure 37: Europe Floating Offshore Wind Market Revenue Share (%), by Water Depth (Qualitative Analysis Only) 2024 & 2032
- Figure 38: Europe Floating Offshore Wind Market Volume Share (%), by Water Depth (Qualitative Analysis Only) 2024 & 2032
- Figure 39: Europe Floating Offshore Wind Market Revenue (Million), by Country 2024 & 2032
- Figure 40: Europe Floating Offshore Wind Market Volume (gigawatt), by Country 2024 & 2032
- Figure 41: Europe Floating Offshore Wind Market Revenue Share (%), by Country 2024 & 2032
- Figure 42: Europe Floating Offshore Wind Market Volume Share (%), by Country 2024 & 2032
- Figure 43: Asia Pacific Floating Offshore Wind Market Revenue (Million), by Water Depth (Qualitative Analysis Only) 2024 & 2032
- Figure 44: Asia Pacific Floating Offshore Wind Market Volume (gigawatt), by Water Depth (Qualitative Analysis Only) 2024 & 2032
- Figure 45: Asia Pacific Floating Offshore Wind Market Revenue Share (%), by Water Depth (Qualitative Analysis Only) 2024 & 2032
- Figure 46: Asia Pacific Floating Offshore Wind Market Volume Share (%), by Water Depth (Qualitative Analysis Only) 2024 & 2032
- Figure 47: Asia Pacific Floating Offshore Wind Market Revenue (Million), by Country 2024 & 2032
- Figure 48: Asia Pacific Floating Offshore Wind Market Volume (gigawatt), by Country 2024 & 2032
- Figure 49: Asia Pacific Floating Offshore Wind Market Revenue Share (%), by Country 2024 & 2032
- Figure 50: Asia Pacific Floating Offshore Wind Market Volume Share (%), by Country 2024 & 2032
- Figure 51: South America Floating Offshore Wind Market Revenue (Million), by Water Depth (Qualitative Analysis Only) 2024 & 2032
- Figure 52: South America Floating Offshore Wind Market Volume (gigawatt), by Water Depth (Qualitative Analysis Only) 2024 & 2032
- Figure 53: South America Floating Offshore Wind Market Revenue Share (%), by Water Depth (Qualitative Analysis Only) 2024 & 2032
- Figure 54: South America Floating Offshore Wind Market Volume Share (%), by Water Depth (Qualitative Analysis Only) 2024 & 2032
- Figure 55: South America Floating Offshore Wind Market Revenue (Million), by Country 2024 & 2032
- Figure 56: South America Floating Offshore Wind Market Volume (gigawatt), by Country 2024 & 2032
- Figure 57: South America Floating Offshore Wind Market Revenue Share (%), by Country 2024 & 2032
- Figure 58: South America Floating Offshore Wind Market Volume Share (%), by Country 2024 & 2032
- Figure 59: Middle East and Africa Floating Offshore Wind Market Revenue (Million), by Water Depth (Qualitative Analysis Only) 2024 & 2032
- Figure 60: Middle East and Africa Floating Offshore Wind Market Volume (gigawatt), by Water Depth (Qualitative Analysis Only) 2024 & 2032
- Figure 61: Middle East and Africa Floating Offshore Wind Market Revenue Share (%), by Water Depth (Qualitative Analysis Only) 2024 & 2032
- Figure 62: Middle East and Africa Floating Offshore Wind Market Volume Share (%), by Water Depth (Qualitative Analysis Only) 2024 & 2032
- Figure 63: Middle East and Africa Floating Offshore Wind Market Revenue (Million), by Country 2024 & 2032
- Figure 64: Middle East and Africa Floating Offshore Wind Market Volume (gigawatt), by Country 2024 & 2032
- Figure 65: Middle East and Africa Floating Offshore Wind Market Revenue Share (%), by Country 2024 & 2032
- Figure 66: Middle East and Africa Floating Offshore Wind Market Volume Share (%), by Country 2024 & 2032
List of Tables
- Table 1: Global Floating Offshore Wind Market Revenue Million Forecast, by Region 2019 & 2032
- Table 2: Global Floating Offshore Wind Market Volume gigawatt Forecast, by Region 2019 & 2032
- Table 3: Global Floating Offshore Wind Market Revenue Million Forecast, by Water Depth (Qualitative Analysis Only) 2019 & 2032
- Table 4: Global Floating Offshore Wind Market Volume gigawatt Forecast, by Water Depth (Qualitative Analysis Only) 2019 & 2032
- Table 5: Global Floating Offshore Wind Market Revenue Million Forecast, by Region 2019 & 2032
- Table 6: Global Floating Offshore Wind Market Volume gigawatt Forecast, by Region 2019 & 2032
- Table 7: Global Floating Offshore Wind Market Revenue Million Forecast, by Country 2019 & 2032
- Table 8: Global Floating Offshore Wind Market Volume gigawatt Forecast, by Country 2019 & 2032
- Table 9: United States Floating Offshore Wind Market Revenue (Million) Forecast, by Application 2019 & 2032
- Table 10: United States Floating Offshore Wind Market Volume (gigawatt) Forecast, by Application 2019 & 2032
- Table 11: Canada Floating Offshore Wind Market Revenue (Million) Forecast, by Application 2019 & 2032
- Table 12: Canada Floating Offshore Wind Market Volume (gigawatt) Forecast, by Application 2019 & 2032
- Table 13: Mexico Floating Offshore Wind Market Revenue (Million) Forecast, by Application 2019 & 2032
- Table 14: Mexico Floating Offshore Wind Market Volume (gigawatt) Forecast, by Application 2019 & 2032
- Table 15: Global Floating Offshore Wind Market Revenue Million Forecast, by Country 2019 & 2032
- Table 16: Global Floating Offshore Wind Market Volume gigawatt Forecast, by Country 2019 & 2032
- Table 17: Germany Floating Offshore Wind Market Revenue (Million) Forecast, by Application 2019 & 2032
- Table 18: Germany Floating Offshore Wind Market Volume (gigawatt) Forecast, by Application 2019 & 2032
- Table 19: United Kingdom Floating Offshore Wind Market Revenue (Million) Forecast, by Application 2019 & 2032
- Table 20: United Kingdom Floating Offshore Wind Market Volume (gigawatt) Forecast, by Application 2019 & 2032
- Table 21: France Floating Offshore Wind Market Revenue (Million) Forecast, by Application 2019 & 2032
- Table 22: France Floating Offshore Wind Market Volume (gigawatt) Forecast, by Application 2019 & 2032
- Table 23: Spain Floating Offshore Wind Market Revenue (Million) Forecast, by Application 2019 & 2032
- Table 24: Spain Floating Offshore Wind Market Volume (gigawatt) Forecast, by Application 2019 & 2032
- Table 25: Italy Floating Offshore Wind Market Revenue (Million) Forecast, by Application 2019 & 2032
- Table 26: Italy Floating Offshore Wind Market Volume (gigawatt) Forecast, by Application 2019 & 2032
- Table 27: Spain Floating Offshore Wind Market Revenue (Million) Forecast, by Application 2019 & 2032
- Table 28: Spain Floating Offshore Wind Market Volume (gigawatt) Forecast, by Application 2019 & 2032
- Table 29: Belgium Floating Offshore Wind Market Revenue (Million) Forecast, by Application 2019 & 2032
- Table 30: Belgium Floating Offshore Wind Market Volume (gigawatt) Forecast, by Application 2019 & 2032
- Table 31: Netherland Floating Offshore Wind Market Revenue (Million) Forecast, by Application 2019 & 2032
- Table 32: Netherland Floating Offshore Wind Market Volume (gigawatt) Forecast, by Application 2019 & 2032
- Table 33: Nordics Floating Offshore Wind Market Revenue (Million) Forecast, by Application 2019 & 2032
- Table 34: Nordics Floating Offshore Wind Market Volume (gigawatt) Forecast, by Application 2019 & 2032
- Table 35: Rest of Europe Floating Offshore Wind Market Revenue (Million) Forecast, by Application 2019 & 2032
- Table 36: Rest of Europe Floating Offshore Wind Market Volume (gigawatt) Forecast, by Application 2019 & 2032
- Table 37: Global Floating Offshore Wind Market Revenue Million Forecast, by Country 2019 & 2032
- Table 38: Global Floating Offshore Wind Market Volume gigawatt Forecast, by Country 2019 & 2032
- Table 39: China Floating Offshore Wind Market Revenue (Million) Forecast, by Application 2019 & 2032
- Table 40: China Floating Offshore Wind Market Volume (gigawatt) Forecast, by Application 2019 & 2032
- Table 41: Japan Floating Offshore Wind Market Revenue (Million) Forecast, by Application 2019 & 2032
- Table 42: Japan Floating Offshore Wind Market Volume (gigawatt) Forecast, by Application 2019 & 2032
- Table 43: India Floating Offshore Wind Market Revenue (Million) Forecast, by Application 2019 & 2032
- Table 44: India Floating Offshore Wind Market Volume (gigawatt) Forecast, by Application 2019 & 2032
- Table 45: South Korea Floating Offshore Wind Market Revenue (Million) Forecast, by Application 2019 & 2032
- Table 46: South Korea Floating Offshore Wind Market Volume (gigawatt) Forecast, by Application 2019 & 2032
- Table 47: Southeast Asia Floating Offshore Wind Market Revenue (Million) Forecast, by Application 2019 & 2032
- Table 48: Southeast Asia Floating Offshore Wind Market Volume (gigawatt) Forecast, by Application 2019 & 2032
- Table 49: Australia Floating Offshore Wind Market Revenue (Million) Forecast, by Application 2019 & 2032
- Table 50: Australia Floating Offshore Wind Market Volume (gigawatt) Forecast, by Application 2019 & 2032
- Table 51: Indonesia Floating Offshore Wind Market Revenue (Million) Forecast, by Application 2019 & 2032
- Table 52: Indonesia Floating Offshore Wind Market Volume (gigawatt) Forecast, by Application 2019 & 2032
- Table 53: Phillipes Floating Offshore Wind Market Revenue (Million) Forecast, by Application 2019 & 2032
- Table 54: Phillipes Floating Offshore Wind Market Volume (gigawatt) Forecast, by Application 2019 & 2032
- Table 55: Singapore Floating Offshore Wind Market Revenue (Million) Forecast, by Application 2019 & 2032
- Table 56: Singapore Floating Offshore Wind Market Volume (gigawatt) Forecast, by Application 2019 & 2032
- Table 57: Thailandc Floating Offshore Wind Market Revenue (Million) Forecast, by Application 2019 & 2032
- Table 58: Thailandc Floating Offshore Wind Market Volume (gigawatt) Forecast, by Application 2019 & 2032
- Table 59: Rest of Asia Pacific Floating Offshore Wind Market Revenue (Million) Forecast, by Application 2019 & 2032
- Table 60: Rest of Asia Pacific Floating Offshore Wind Market Volume (gigawatt) Forecast, by Application 2019 & 2032
- Table 61: Global Floating Offshore Wind Market Revenue Million Forecast, by Country 2019 & 2032
- Table 62: Global Floating Offshore Wind Market Volume gigawatt Forecast, by Country 2019 & 2032
- Table 63: Brazil Floating Offshore Wind Market Revenue (Million) Forecast, by Application 2019 & 2032
- Table 64: Brazil Floating Offshore Wind Market Volume (gigawatt) Forecast, by Application 2019 & 2032
- Table 65: Argentina Floating Offshore Wind Market Revenue (Million) Forecast, by Application 2019 & 2032
- Table 66: Argentina Floating Offshore Wind Market Volume (gigawatt) Forecast, by Application 2019 & 2032
- Table 67: Peru Floating Offshore Wind Market Revenue (Million) Forecast, by Application 2019 & 2032
- Table 68: Peru Floating Offshore Wind Market Volume (gigawatt) Forecast, by Application 2019 & 2032
- Table 69: Chile Floating Offshore Wind Market Revenue (Million) Forecast, by Application 2019 & 2032
- Table 70: Chile Floating Offshore Wind Market Volume (gigawatt) Forecast, by Application 2019 & 2032
- Table 71: Colombia Floating Offshore Wind Market Revenue (Million) Forecast, by Application 2019 & 2032
- Table 72: Colombia Floating Offshore Wind Market Volume (gigawatt) Forecast, by Application 2019 & 2032
- Table 73: Ecuador Floating Offshore Wind Market Revenue (Million) Forecast, by Application 2019 & 2032
- Table 74: Ecuador Floating Offshore Wind Market Volume (gigawatt) Forecast, by Application 2019 & 2032
- Table 75: Venezuela Floating Offshore Wind Market Revenue (Million) Forecast, by Application 2019 & 2032
- Table 76: Venezuela Floating Offshore Wind Market Volume (gigawatt) Forecast, by Application 2019 & 2032
- Table 77: Rest of South America Floating Offshore Wind Market Revenue (Million) Forecast, by Application 2019 & 2032
- Table 78: Rest of South America Floating Offshore Wind Market Volume (gigawatt) Forecast, by Application 2019 & 2032
- Table 79: Global Floating Offshore Wind Market Revenue Million Forecast, by Country 2019 & 2032
- Table 80: Global Floating Offshore Wind Market Volume gigawatt Forecast, by Country 2019 & 2032
- Table 81: United States Floating Offshore Wind Market Revenue (Million) Forecast, by Application 2019 & 2032
- Table 82: United States Floating Offshore Wind Market Volume (gigawatt) Forecast, by Application 2019 & 2032
- Table 83: Canada Floating Offshore Wind Market Revenue (Million) Forecast, by Application 2019 & 2032
- Table 84: Canada Floating Offshore Wind Market Volume (gigawatt) Forecast, by Application 2019 & 2032
- Table 85: Mexico Floating Offshore Wind Market Revenue (Million) Forecast, by Application 2019 & 2032
- Table 86: Mexico Floating Offshore Wind Market Volume (gigawatt) Forecast, by Application 2019 & 2032
- Table 87: Global Floating Offshore Wind Market Revenue Million Forecast, by Country 2019 & 2032
- Table 88: Global Floating Offshore Wind Market Volume gigawatt Forecast, by Country 2019 & 2032
- Table 89: United Arab Emirates Floating Offshore Wind Market Revenue (Million) Forecast, by Application 2019 & 2032
- Table 90: United Arab Emirates Floating Offshore Wind Market Volume (gigawatt) Forecast, by Application 2019 & 2032
- Table 91: Saudi Arabia Floating Offshore Wind Market Revenue (Million) Forecast, by Application 2019 & 2032
- Table 92: Saudi Arabia Floating Offshore Wind Market Volume (gigawatt) Forecast, by Application 2019 & 2032
- Table 93: South Africa Floating Offshore Wind Market Revenue (Million) Forecast, by Application 2019 & 2032
- Table 94: South Africa Floating Offshore Wind Market Volume (gigawatt) Forecast, by Application 2019 & 2032
- Table 95: Rest of Middle East and Africa Floating Offshore Wind Market Revenue (Million) Forecast, by Application 2019 & 2032
- Table 96: Rest of Middle East and Africa Floating Offshore Wind Market Volume (gigawatt) Forecast, by Application 2019 & 2032
- Table 97: Global Floating Offshore Wind Market Revenue Million Forecast, by Water Depth (Qualitative Analysis Only) 2019 & 2032
- Table 98: Global Floating Offshore Wind Market Volume gigawatt Forecast, by Water Depth (Qualitative Analysis Only) 2019 & 2032
- Table 99: Global Floating Offshore Wind Market Revenue Million Forecast, by Country 2019 & 2032
- Table 100: Global Floating Offshore Wind Market Volume gigawatt Forecast, by Country 2019 & 2032
- Table 101: United States Floating Offshore Wind Market Revenue (Million) Forecast, by Application 2019 & 2032
- Table 102: United States Floating Offshore Wind Market Volume (gigawatt) Forecast, by Application 2019 & 2032
- Table 103: Canada Floating Offshore Wind Market Revenue (Million) Forecast, by Application 2019 & 2032
- Table 104: Canada Floating Offshore Wind Market Volume (gigawatt) Forecast, by Application 2019 & 2032
- Table 105: Rest of North America Floating Offshore Wind Market Revenue (Million) Forecast, by Application 2019 & 2032
- Table 106: Rest of North America Floating Offshore Wind Market Volume (gigawatt) Forecast, by Application 2019 & 2032
- Table 107: Global Floating Offshore Wind Market Revenue Million Forecast, by Water Depth (Qualitative Analysis Only) 2019 & 2032
- Table 108: Global Floating Offshore Wind Market Volume gigawatt Forecast, by Water Depth (Qualitative Analysis Only) 2019 & 2032
- Table 109: Global Floating Offshore Wind Market Revenue Million Forecast, by Country 2019 & 2032
- Table 110: Global Floating Offshore Wind Market Volume gigawatt Forecast, by Country 2019 & 2032
- Table 111: United Kingdom Floating Offshore Wind Market Revenue (Million) Forecast, by Application 2019 & 2032
- Table 112: United Kingdom Floating Offshore Wind Market Volume (gigawatt) Forecast, by Application 2019 & 2032
- Table 113: Germany Floating Offshore Wind Market Revenue (Million) Forecast, by Application 2019 & 2032
- Table 114: Germany Floating Offshore Wind Market Volume (gigawatt) Forecast, by Application 2019 & 2032
- Table 115: France Floating Offshore Wind Market Revenue (Million) Forecast, by Application 2019 & 2032
- Table 116: France Floating Offshore Wind Market Volume (gigawatt) Forecast, by Application 2019 & 2032
- Table 117: Italy Floating Offshore Wind Market Revenue (Million) Forecast, by Application 2019 & 2032
- Table 118: Italy Floating Offshore Wind Market Volume (gigawatt) Forecast, by Application 2019 & 2032
- Table 119: Spain Floating Offshore Wind Market Revenue (Million) Forecast, by Application 2019 & 2032
- Table 120: Spain Floating Offshore Wind Market Volume (gigawatt) Forecast, by Application 2019 & 2032
- Table 121: Nordic Countries Floating Offshore Wind Market Revenue (Million) Forecast, by Application 2019 & 2032
- Table 122: Nordic Countries Floating Offshore Wind Market Volume (gigawatt) Forecast, by Application 2019 & 2032
- Table 123: Russia Floating Offshore Wind Market Revenue (Million) Forecast, by Application 2019 & 2032
- Table 124: Russia Floating Offshore Wind Market Volume (gigawatt) Forecast, by Application 2019 & 2032
- Table 125: Rest of Europe Floating Offshore Wind Market Revenue (Million) Forecast, by Application 2019 & 2032
- Table 126: Rest of Europe Floating Offshore Wind Market Volume (gigawatt) Forecast, by Application 2019 & 2032
- Table 127: Global Floating Offshore Wind Market Revenue Million Forecast, by Water Depth (Qualitative Analysis Only) 2019 & 2032
- Table 128: Global Floating Offshore Wind Market Volume gigawatt Forecast, by Water Depth (Qualitative Analysis Only) 2019 & 2032
- Table 129: Global Floating Offshore Wind Market Revenue Million Forecast, by Country 2019 & 2032
- Table 130: Global Floating Offshore Wind Market Volume gigawatt Forecast, by Country 2019 & 2032
- Table 131: China Floating Offshore Wind Market Revenue (Million) Forecast, by Application 2019 & 2032
- Table 132: China Floating Offshore Wind Market Volume (gigawatt) Forecast, by Application 2019 & 2032
- Table 133: India Floating Offshore Wind Market Revenue (Million) Forecast, by Application 2019 & 2032
- Table 134: India Floating Offshore Wind Market Volume (gigawatt) Forecast, by Application 2019 & 2032
- Table 135: Japan Floating Offshore Wind Market Revenue (Million) Forecast, by Application 2019 & 2032
- Table 136: Japan Floating Offshore Wind Market Volume (gigawatt) Forecast, by Application 2019 & 2032
- Table 137: Indonesia Floating Offshore Wind Market Revenue (Million) Forecast, by Application 2019 & 2032
- Table 138: Indonesia Floating Offshore Wind Market Volume (gigawatt) Forecast, by Application 2019 & 2032
- Table 139: Malaysia Floating Offshore Wind Market Revenue (Million) Forecast, by Application 2019 & 2032
- Table 140: Malaysia Floating Offshore Wind Market Volume (gigawatt) Forecast, by Application 2019 & 2032
- Table 141: Vietnam Floating Offshore Wind Market Revenue (Million) Forecast, by Application 2019 & 2032
- Table 142: Vietnam Floating Offshore Wind Market Volume (gigawatt) Forecast, by Application 2019 & 2032
- Table 143: Thailand Floating Offshore Wind Market Revenue (Million) Forecast, by Application 2019 & 2032
- Table 144: Thailand Floating Offshore Wind Market Volume (gigawatt) Forecast, by Application 2019 & 2032
- Table 145: Rest of Asia Pacific Floating Offshore Wind Market Revenue (Million) Forecast, by Application 2019 & 2032
- Table 146: Rest of Asia Pacific Floating Offshore Wind Market Volume (gigawatt) Forecast, by Application 2019 & 2032
- Table 147: Global Floating Offshore Wind Market Revenue Million Forecast, by Water Depth (Qualitative Analysis Only) 2019 & 2032
- Table 148: Global Floating Offshore Wind Market Volume gigawatt Forecast, by Water Depth (Qualitative Analysis Only) 2019 & 2032
- Table 149: Global Floating Offshore Wind Market Revenue Million Forecast, by Country 2019 & 2032
- Table 150: Global Floating Offshore Wind Market Volume gigawatt Forecast, by Country 2019 & 2032
- Table 151: Brazil Floating Offshore Wind Market Revenue (Million) Forecast, by Application 2019 & 2032
- Table 152: Brazil Floating Offshore Wind Market Volume (gigawatt) Forecast, by Application 2019 & 2032
- Table 153: Argentina Floating Offshore Wind Market Revenue (Million) Forecast, by Application 2019 & 2032
- Table 154: Argentina Floating Offshore Wind Market Volume (gigawatt) Forecast, by Application 2019 & 2032
- Table 155: Colombia Floating Offshore Wind Market Revenue (Million) Forecast, by Application 2019 & 2032
- Table 156: Colombia Floating Offshore Wind Market Volume (gigawatt) Forecast, by Application 2019 & 2032
- Table 157: Rest of South America Floating Offshore Wind Market Revenue (Million) Forecast, by Application 2019 & 2032
- Table 158: Rest of South America Floating Offshore Wind Market Volume (gigawatt) Forecast, by Application 2019 & 2032
- Table 159: Global Floating Offshore Wind Market Revenue Million Forecast, by Water Depth (Qualitative Analysis Only) 2019 & 2032
- Table 160: Global Floating Offshore Wind Market Volume gigawatt Forecast, by Water Depth (Qualitative Analysis Only) 2019 & 2032
- Table 161: Global Floating Offshore Wind Market Revenue Million Forecast, by Country 2019 & 2032
- Table 162: Global Floating Offshore Wind Market Volume gigawatt Forecast, by Country 2019 & 2032
- Table 163: Saudi Arabia Floating Offshore Wind Market Revenue (Million) Forecast, by Application 2019 & 2032
- Table 164: Saudi Arabia Floating Offshore Wind Market Volume (gigawatt) Forecast, by Application 2019 & 2032
- Table 165: United Arab Emirates Floating Offshore Wind Market Revenue (Million) Forecast, by Application 2019 & 2032
- Table 166: United Arab Emirates Floating Offshore Wind Market Volume (gigawatt) Forecast, by Application 2019 & 2032
- Table 167: Egypt Floating Offshore Wind Market Revenue (Million) Forecast, by Application 2019 & 2032
- Table 168: Egypt Floating Offshore Wind Market Volume (gigawatt) Forecast, by Application 2019 & 2032
- Table 169: South Africa Floating Offshore Wind Market Revenue (Million) Forecast, by Application 2019 & 2032
- Table 170: South Africa Floating Offshore Wind Market Volume (gigawatt) Forecast, by Application 2019 & 2032
- Table 171: Nigeria Floating Offshore Wind Market Revenue (Million) Forecast, by Application 2019 & 2032
- Table 172: Nigeria Floating Offshore Wind Market Volume (gigawatt) Forecast, by Application 2019 & 2032
- Table 173: Rest of the Middle East and Africa Floating Offshore Wind Market Revenue (Million) Forecast, by Application 2019 & 2032
- Table 174: Rest of the Middle East and Africa Floating Offshore Wind Market Volume (gigawatt) Forecast, by Application 2019 & 2032
Frequently Asked Questions
1. What is the projected Compound Annual Growth Rate (CAGR) of the Floating Offshore Wind Market?
The projected CAGR is approximately 88.36%.
2. Which companies are prominent players in the Floating Offshore Wind Market?
Key companies in the market include Equinor ASA, Siemens Gamesa Renewable Energy SA, BW Ideol AS, Macquarie Group Limited, Marubeni Corporation, Doosan Enerbility Co Ltd, Vestas Wind Systems AS, General Electric Company.
3. What are the main segments of the Floating Offshore Wind Market?
The market segments include Water Depth (Qualitative Analysis Only).
4. Can you provide details about the market size?
The market size is estimated to be USD XX Million as of 2022.
5. What are some drivers contributing to market growth?
4.; Rising investments in offshore renewable wind energy projects4.; Advanced and readily accessible offshore wind turbine technologies.
6. What are the notable trends driving market growth?
The Transitional Water (30 m to 60 m depth) Segment is Expected to Grow.
7. Are there any restraints impacting market growth?
4.; The Increasing Adoption of Alternate Clean Power Sources Such as Solar and Biomass.
8. Can you provide examples of recent developments in the market?
April 2024: Octopus Energy, a European renewable energy group specializing in sustainable energy, announced investments in Ocergy, a US-headquartered floating offshore wind tech company, to boost the development of floating offshore wind farms globally.
9. What pricing options are available for accessing the report?
Pricing options include single-user, multi-user, and enterprise licenses priced at USD 4750, USD 5250, and USD 8750 respectively.
10. Is the market size provided in terms of value or volume?
The market size is provided in terms of value, measured in Million and volume, measured in gigawatt.
11. Are there any specific market keywords associated with the report?
Yes, the market keyword associated with the report is "Floating Offshore Wind Market," which aids in identifying and referencing the specific market segment covered.
12. How do I determine which pricing option suits my needs best?
The pricing options vary based on user requirements and access needs. Individual users may opt for single-user licenses, while businesses requiring broader access may choose multi-user or enterprise licenses for cost-effective access to the report.
13. Are there any additional resources or data provided in the Floating Offshore Wind Market report?
While the report offers comprehensive insights, it's advisable to review the specific contents or supplementary materials provided to ascertain if additional resources or data are available.
14. How can I stay updated on further developments or reports in the Floating Offshore Wind Market?
To stay informed about further developments, trends, and reports in the Floating Offshore Wind Market, consider subscribing to industry newsletters, following relevant companies and organizations, or regularly checking reputable industry news sources and publications.
Methodology
Step 1 - Identification of Relevant Samples Size from Population Database


Step 2 - Approaches for Defining Global Market Size (Value, Volume* & Price*)

Note*: In applicable scenarios
Step 3 - Data Sources
Primary Research
- Web Analytics
- Survey Reports
- Research Institute
- Latest Research Reports
- Opinion Leaders
Secondary Research
- Annual Reports
- White Paper
- Latest Press Release
- Industry Association
- Paid Database
- Investor Presentations

Step 4 - Data Triangulation
Involves using different sources of information in order to increase the validity of a study
These sources are likely to be stakeholders in a program - participants, other researchers, program staff, other community members, and so on.
Then we put all data in single framework & apply various statistical tools to find out the dynamic on the market.
During the analysis stage, feedback from the stakeholder groups would be compared to determine areas of agreement as well as areas of divergence


