
Key Insights
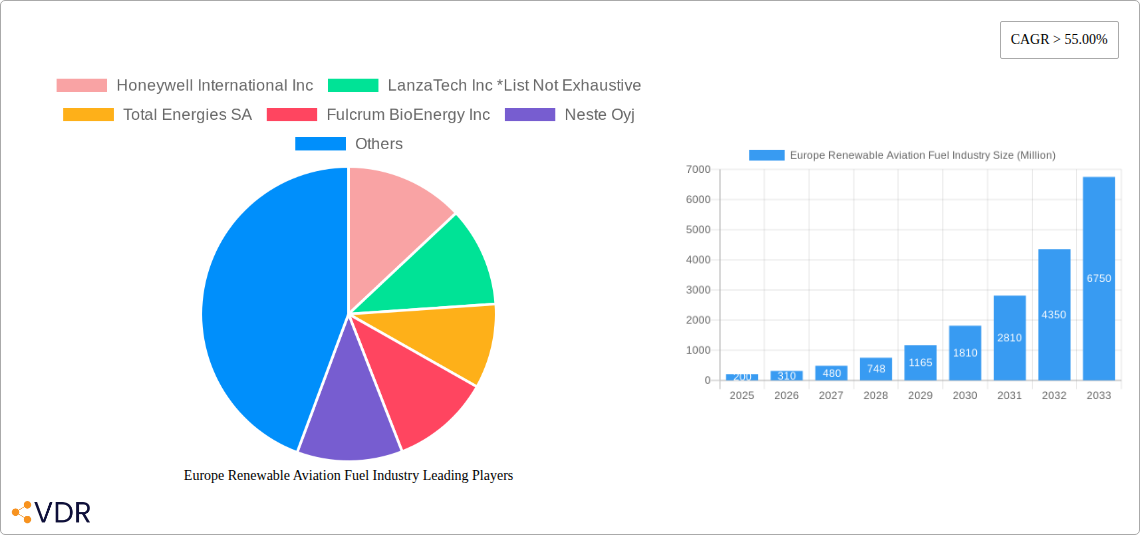
The European renewable aviation fuel (RAF) market is experiencing explosive growth, projected to maintain a Compound Annual Growth Rate (CAGR) exceeding 55% from 2025 to 2033. Driven by stringent environmental regulations aimed at reducing aviation's carbon footprint, coupled with increasing consumer demand for sustainable travel options, this sector shows immense potential. Several technological advancements are fueling this expansion. Fischer-Tropsch (FT) synthesis, Hydroprocessed Esters and Fatty Acids (HEFA), Synthesized Iso-Paraffinic (SIP), and Alcohol-to-Jet (AJT) technologies are all contributing to a diversified RAF production landscape. Major players like Honeywell, LanzaTech, Total Energies, Neste, and Gevo are investing heavily in research and development, scaling up production facilities, and securing strategic partnerships to capitalize on this burgeoning market. The commercial aviation segment currently dominates, yet significant growth is anticipated within the defense sector as nations strive to decarbonize their military operations. Germany, France, the UK, and the Netherlands are leading the charge in Europe, benefiting from robust government support policies, established biofuel infrastructure, and a strong commitment to sustainability. However, challenges remain, including the relatively high production costs of RAF compared to conventional jet fuel and the need for further development in feedstock availability and supply chain optimization.
Despite these challenges, the long-term outlook for the European RAF market remains overwhelmingly positive. The market's substantial growth trajectory is largely fueled by regulatory pressures mandating a progressive increase in the blending of sustainable aviation fuels into conventional jet fuel. Coupled with strong investor interest and continuous technological innovations, overcoming initial hurdles like cost competitiveness and feedstock constraints is expected. The focus on improving the efficiency and scalability of various RAF production technologies, coupled with a growing awareness of the environmental impact of air travel among consumers and businesses, promises to further accelerate market expansion throughout the forecast period. The geographical distribution of growth will likely be influenced by existing biofuel infrastructure, government policies supporting RAF adoption, and the availability of suitable feedstock sources in each region.
Europe Renewable Aviation Fuel Industry: A Comprehensive Market Report (2019-2033)
This comprehensive report provides an in-depth analysis of the European renewable aviation fuel (SAF) industry, encompassing market dynamics, growth trends, dominant segments, and key players. With a focus on the parent market (Sustainable Aviation Fuel) and child markets (Commercial & Defense applications; FT, HEFA, SIP, and AJT technologies), this report offers crucial insights for industry professionals, investors, and policymakers. The study period covers 2019-2033, with a base year of 2025 and a forecast period of 2025-2033. Market values are presented in millions of units.
Europe Renewable Aviation Fuel Industry Market Dynamics & Structure
This section analyzes the European renewable aviation fuel market's competitive landscape, technological advancements, regulatory environment, and market trends. The report delves into market concentration, identifying key players and their market share percentages. We examine the impact of technological innovations like Fischer-Tropsch (FT), Hydroprocessed Esters and Fatty Acids (HEFA), Synthesisized Iso-Paraffinic (SIP), and Alcohol-to-Jet (AJT) technologies on market growth. Furthermore, we analyze the influence of regulatory frameworks, competitive substitutes, and end-user demographics, including the commercial and defense sectors. The report also explores mergers and acquisitions (M&A) activity within the industry, providing quantitative insights into deal volumes and qualitative assessments of their impact.
- Market Concentration: xx% controlled by top 5 players in 2024; expected to increase to xx% by 2033.
- Technological Innovation Drivers: Focus on improving feedstock efficiency, reducing production costs, and enhancing SAF quality.
- Regulatory Frameworks: Analysis of EU policies promoting SAF adoption and their impact on market growth.
- Competitive Product Substitutes: Assessment of alternative sustainable fuels and their potential impact on market share.
- End-User Demographics: Detailed analysis of SAF demand from commercial and defense aviation sectors.
- M&A Trends: Analysis of xx M&A deals in the historical period; xx predicted for the forecast period. Qualitative assessment of synergistic effects. Innovation barriers are also identified and quantified (e.g., high capital expenditure).
Europe Renewable Aviation Fuel Industry Growth Trends & Insights
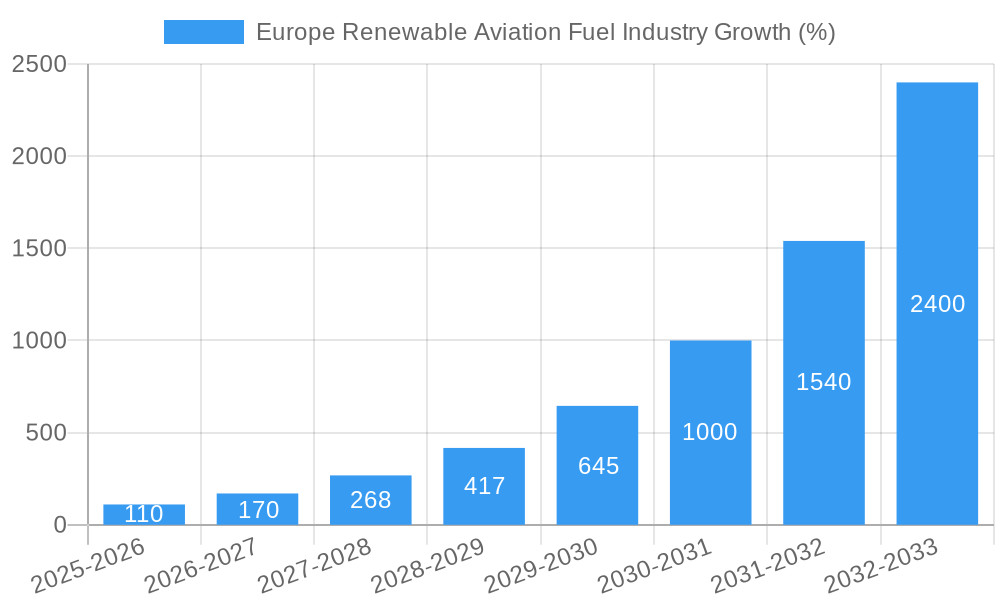
Leveraging extensive primary and secondary research, this section provides a detailed analysis of the European renewable aviation fuel market's growth trajectory. It examines historical market size evolution (2019-2024), projects future market size (2025-2033), and determines the Compound Annual Growth Rate (CAGR). The analysis incorporates adoption rates across different segments (commercial vs. defense; technology types), assesses technological disruptions impacting market dynamics, and investigates shifts in consumer behavior (e.g., airline preferences for sustainable options). Specific metrics, including market penetration rates and regional variations, are presented to facilitate a thorough understanding of market growth drivers and challenges.
- Market size in 2024: xx Million
- Projected market size in 2033: xx Million
- CAGR (2025-2033): xx%
- Market penetration rate in 2024: xx%
- Projected market penetration rate in 2033: xx%
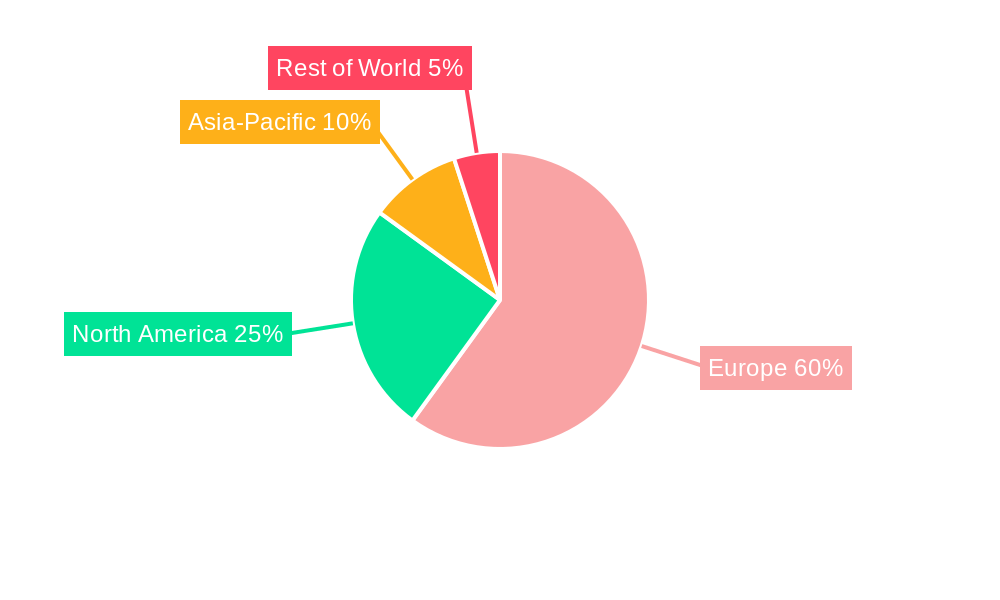
Dominant Regions, Countries, or Segments in Europe Renewable Aviation Fuel Industry
This section pinpoints the leading regions, countries, and segments within the European SAF market driving its growth. It examines the dominance of specific applications (Commercial, Defense) and technologies (FT, HEFA, SIP, AJT) through detailed analysis of market share, growth potential, and key drivers. This analysis incorporates economic policies, infrastructure development, and regional regulatory environments.
- Leading Region: (e.g., Northwest Europe) – Factors contributing to dominance (e.g., strong policy support, established infrastructure).
- Leading Country: (e.g., Germany) – Specific economic policies and supportive initiatives that drive growth.
- Leading Application Segment: (e.g., Commercial Aviation) – Market share, future projections, and factors contributing to growth.
- Leading Technology Segment: (e.g., HEFA) – Reasons for its dominance, including technological advantages and cost-efficiency.
Europe Renewable Aviation Fuel Industry Product Landscape
This section provides an overview of the various renewable aviation fuels available, highlighting their applications and performance characteristics. It emphasizes unique selling propositions (USPs) and describes technological advancements driving innovation. The discussion includes comparative analysis of different SAF types based on sustainability metrics, cost-effectiveness, and operational compatibility with existing aircraft engines.
Key Drivers, Barriers & Challenges in Europe Renewable Aviation Fuel Industry
This section outlines the key factors propelling the European renewable aviation fuel market's growth, encompassing technological advancements, supportive government policies, and increasing environmental awareness. Conversely, it also addresses significant challenges including supply chain bottlenecks, regulatory hurdles, and intense competition. Quantitative data showcasing the impact of these challenges (e.g., cost implications, production limitations) are integrated.
Key Drivers:
- Increasing demand for sustainable aviation solutions due to climate change concerns.
- Technological advancements making SAF production more efficient and cost-effective.
- Supportive government policies and incentives promoting SAF adoption.
Key Challenges:
- High production costs compared to conventional jet fuel.
- Limited availability of sustainable feedstock.
- Regulatory complexities and standardization challenges.
Emerging Opportunities in Europe Renewable Aviation Fuel Industry
This section identifies promising opportunities within the European renewable aviation fuel market. It focuses on untapped market segments, innovative applications, and evolving consumer preferences. The discussion includes the potential for strategic partnerships, technological breakthroughs, and market expansion strategies.
Growth Accelerators in the Europe Renewable Aviation Fuel Industry Industry
This section explores catalysts that can significantly boost the long-term growth of the European renewable aviation fuel market. The analysis incorporates technological breakthroughs leading to cost reduction and efficiency improvements, strategic partnerships fostering innovation and scale-up, and market expansion strategies targeting new regions and applications.
Key Players Shaping the Europe Renewable Aviation Fuel Industry Market
- Honeywell International Inc
- LanzaTech Inc
- Total Energies SA
- Fulcrum BioEnergy Inc
- Neste Oyj
- Swedish Biofuels AB
- Gevo Inc
- List Not Exhaustive
Notable Milestones in Europe Renewable Aviation Fuel Industry Sector
- December 2022: TotalEnergies signed a memorandum of understanding to deliver more than 800,000 tonnes of sustainable aviation fuel to Air France-KLM Group airlines over ten years (2023-2033). This significantly boosts SAF supply commitments.
- January 2022: Cepsa's agreement with Iberia and Iberia Express marks a major step towards large-scale SAF production from waste and sustainable feedstocks in Spain. This demonstrates commitment to sustainable practices among major airlines.
In-Depth Europe Renewable Aviation Fuel Industry Market Outlook
The European renewable aviation fuel market is poised for substantial growth, driven by increasing environmental regulations, airline commitments to sustainability, and technological advancements. Strategic partnerships and innovative feedstock solutions will further accelerate market expansion. The long-term outlook is positive, with significant opportunities for companies engaged in SAF production, distribution, and technology development.
Europe Renewable Aviation Fuel Industry Segmentation
-
1. Technology
- 1.1. Fischer-Tropsch (FT)
- 1.2. Hydroprocessed Esters and Fatty Acids (HEFA)
- 1.3. Synthesi
-
2. Application
- 2.1. Commercial
- 2.2. Defense
Europe Renewable Aviation Fuel Industry Segmentation By Geography
- 1. Germany
- 2. France
- 3. United Kingdom
- 4. Rest of Europe
Europe Renewable Aviation Fuel Industry REPORT HIGHLIGHTS
| Aspects | Details |
|---|---|
| Study Period | 2019-2033 |
| Base Year | 2024 |
| Estimated Year | 2025 |
| Forecast Period | 2025-2033 |
| Historical Period | 2019-2024 |
| Growth Rate | CAGR of > 55.00% from 2019-2033 |
| Segmentation |
|
Table of Contents
- 1. Introduction
- 1.1. Research Scope
- 1.2. Market Segmentation
- 1.3. Research Methodology
- 1.4. Definitions and Assumptions
- 2. Executive Summary
- 2.1. Introduction
- 3. Market Dynamics
- 3.1. Introduction
- 3.2. Market Drivers
- 3.2.1. 4.; Declining Solar Panel Costs4.; Supportive Government Policies
- 3.3. Market Restrains
- 3.3.1. 4.; High Upfront Cost
- 3.4. Market Trends
- 3.4.1. Commercial Sector to be the Largest Segment
- 4. Market Factor Analysis
- 4.1. Porters Five Forces
- 4.2. Supply/Value Chain
- 4.3. PESTEL analysis
- 4.4. Market Entropy
- 4.5. Patent/Trademark Analysis
- 5. Europe Renewable Aviation Fuel Industry Analysis, Insights and Forecast, 2019-2031
- 5.1. Market Analysis, Insights and Forecast - by Technology
- 5.1.1. Fischer-Tropsch (FT)
- 5.1.2. Hydroprocessed Esters and Fatty Acids (HEFA)
- 5.1.3. Synthesi
- 5.2. Market Analysis, Insights and Forecast - by Application
- 5.2.1. Commercial
- 5.2.2. Defense
- 5.3. Market Analysis, Insights and Forecast - by Region
- 5.3.1. Germany
- 5.3.2. France
- 5.3.3. United Kingdom
- 5.3.4. Rest of Europe
- 5.1. Market Analysis, Insights and Forecast - by Technology
- 6. Germany Europe Renewable Aviation Fuel Industry Analysis, Insights and Forecast, 2019-2031
- 6.1. Market Analysis, Insights and Forecast - by Technology
- 6.1.1. Fischer-Tropsch (FT)
- 6.1.2. Hydroprocessed Esters and Fatty Acids (HEFA)
- 6.1.3. Synthesi
- 6.2. Market Analysis, Insights and Forecast - by Application
- 6.2.1. Commercial
- 6.2.2. Defense
- 6.1. Market Analysis, Insights and Forecast - by Technology
- 7. France Europe Renewable Aviation Fuel Industry Analysis, Insights and Forecast, 2019-2031
- 7.1. Market Analysis, Insights and Forecast - by Technology
- 7.1.1. Fischer-Tropsch (FT)
- 7.1.2. Hydroprocessed Esters and Fatty Acids (HEFA)
- 7.1.3. Synthesi
- 7.2. Market Analysis, Insights and Forecast - by Application
- 7.2.1. Commercial
- 7.2.2. Defense
- 7.1. Market Analysis, Insights and Forecast - by Technology
- 8. United Kingdom Europe Renewable Aviation Fuel Industry Analysis, Insights and Forecast, 2019-2031
- 8.1. Market Analysis, Insights and Forecast - by Technology
- 8.1.1. Fischer-Tropsch (FT)
- 8.1.2. Hydroprocessed Esters and Fatty Acids (HEFA)
- 8.1.3. Synthesi
- 8.2. Market Analysis, Insights and Forecast - by Application
- 8.2.1. Commercial
- 8.2.2. Defense
- 8.1. Market Analysis, Insights and Forecast - by Technology
- 9. Rest of Europe Europe Renewable Aviation Fuel Industry Analysis, Insights and Forecast, 2019-2031
- 9.1. Market Analysis, Insights and Forecast - by Technology
- 9.1.1. Fischer-Tropsch (FT)
- 9.1.2. Hydroprocessed Esters and Fatty Acids (HEFA)
- 9.1.3. Synthesi
- 9.2. Market Analysis, Insights and Forecast - by Application
- 9.2.1. Commercial
- 9.2.2. Defense
- 9.1. Market Analysis, Insights and Forecast - by Technology
- 10. Germany Europe Renewable Aviation Fuel Industry Analysis, Insights and Forecast, 2019-2031
- 11. France Europe Renewable Aviation Fuel Industry Analysis, Insights and Forecast, 2019-2031
- 12. Italy Europe Renewable Aviation Fuel Industry Analysis, Insights and Forecast, 2019-2031
- 13. United Kingdom Europe Renewable Aviation Fuel Industry Analysis, Insights and Forecast, 2019-2031
- 14. Netherlands Europe Renewable Aviation Fuel Industry Analysis, Insights and Forecast, 2019-2031
- 15. Sweden Europe Renewable Aviation Fuel Industry Analysis, Insights and Forecast, 2019-2031
- 16. Rest of Europe Europe Renewable Aviation Fuel Industry Analysis, Insights and Forecast, 2019-2031
- 17. Competitive Analysis
- 17.1. Market Share Analysis 2024
- 17.2. Company Profiles
- 17.2.1 Honeywell International Inc
- 17.2.1.1. Overview
- 17.2.1.2. Products
- 17.2.1.3. SWOT Analysis
- 17.2.1.4. Recent Developments
- 17.2.1.5. Financials (Based on Availability)
- 17.2.2 LanzaTech Inc *List Not Exhaustive
- 17.2.2.1. Overview
- 17.2.2.2. Products
- 17.2.2.3. SWOT Analysis
- 17.2.2.4. Recent Developments
- 17.2.2.5. Financials (Based on Availability)
- 17.2.3 Total Energies SA
- 17.2.3.1. Overview
- 17.2.3.2. Products
- 17.2.3.3. SWOT Analysis
- 17.2.3.4. Recent Developments
- 17.2.3.5. Financials (Based on Availability)
- 17.2.4 Fulcrum BioEnergy Inc
- 17.2.4.1. Overview
- 17.2.4.2. Products
- 17.2.4.3. SWOT Analysis
- 17.2.4.4. Recent Developments
- 17.2.4.5. Financials (Based on Availability)
- 17.2.5 Neste Oyj
- 17.2.5.1. Overview
- 17.2.5.2. Products
- 17.2.5.3. SWOT Analysis
- 17.2.5.4. Recent Developments
- 17.2.5.5. Financials (Based on Availability)
- 17.2.6 Swedish Biofuels AB
- 17.2.6.1. Overview
- 17.2.6.2. Products
- 17.2.6.3. SWOT Analysis
- 17.2.6.4. Recent Developments
- 17.2.6.5. Financials (Based on Availability)
- 17.2.7 Gevo Inc
- 17.2.7.1. Overview
- 17.2.7.2. Products
- 17.2.7.3. SWOT Analysis
- 17.2.7.4. Recent Developments
- 17.2.7.5. Financials (Based on Availability)
- 17.2.1 Honeywell International Inc
List of Figures
- Figure 1: Europe Renewable Aviation Fuel Industry Revenue Breakdown (Million, %) by Product 2024 & 2032
- Figure 2: Europe Renewable Aviation Fuel Industry Share (%) by Company 2024
List of Tables
- Table 1: Europe Renewable Aviation Fuel Industry Revenue Million Forecast, by Region 2019 & 2032
- Table 2: Europe Renewable Aviation Fuel Industry Volume K Tons Forecast, by Region 2019 & 2032
- Table 3: Europe Renewable Aviation Fuel Industry Revenue Million Forecast, by Technology 2019 & 2032
- Table 4: Europe Renewable Aviation Fuel Industry Volume K Tons Forecast, by Technology 2019 & 2032
- Table 5: Europe Renewable Aviation Fuel Industry Revenue Million Forecast, by Application 2019 & 2032
- Table 6: Europe Renewable Aviation Fuel Industry Volume K Tons Forecast, by Application 2019 & 2032
- Table 7: Europe Renewable Aviation Fuel Industry Revenue Million Forecast, by Region 2019 & 2032
- Table 8: Europe Renewable Aviation Fuel Industry Volume K Tons Forecast, by Region 2019 & 2032
- Table 9: Europe Renewable Aviation Fuel Industry Revenue Million Forecast, by Country 2019 & 2032
- Table 10: Europe Renewable Aviation Fuel Industry Volume K Tons Forecast, by Country 2019 & 2032
- Table 11: Germany Europe Renewable Aviation Fuel Industry Revenue (Million) Forecast, by Application 2019 & 2032
- Table 12: Germany Europe Renewable Aviation Fuel Industry Volume (K Tons) Forecast, by Application 2019 & 2032
- Table 13: France Europe Renewable Aviation Fuel Industry Revenue (Million) Forecast, by Application 2019 & 2032
- Table 14: France Europe Renewable Aviation Fuel Industry Volume (K Tons) Forecast, by Application 2019 & 2032
- Table 15: Italy Europe Renewable Aviation Fuel Industry Revenue (Million) Forecast, by Application 2019 & 2032
- Table 16: Italy Europe Renewable Aviation Fuel Industry Volume (K Tons) Forecast, by Application 2019 & 2032
- Table 17: United Kingdom Europe Renewable Aviation Fuel Industry Revenue (Million) Forecast, by Application 2019 & 2032
- Table 18: United Kingdom Europe Renewable Aviation Fuel Industry Volume (K Tons) Forecast, by Application 2019 & 2032
- Table 19: Netherlands Europe Renewable Aviation Fuel Industry Revenue (Million) Forecast, by Application 2019 & 2032
- Table 20: Netherlands Europe Renewable Aviation Fuel Industry Volume (K Tons) Forecast, by Application 2019 & 2032
- Table 21: Sweden Europe Renewable Aviation Fuel Industry Revenue (Million) Forecast, by Application 2019 & 2032
- Table 22: Sweden Europe Renewable Aviation Fuel Industry Volume (K Tons) Forecast, by Application 2019 & 2032
- Table 23: Rest of Europe Europe Renewable Aviation Fuel Industry Revenue (Million) Forecast, by Application 2019 & 2032
- Table 24: Rest of Europe Europe Renewable Aviation Fuel Industry Volume (K Tons) Forecast, by Application 2019 & 2032
- Table 25: Europe Renewable Aviation Fuel Industry Revenue Million Forecast, by Technology 2019 & 2032
- Table 26: Europe Renewable Aviation Fuel Industry Volume K Tons Forecast, by Technology 2019 & 2032
- Table 27: Europe Renewable Aviation Fuel Industry Revenue Million Forecast, by Application 2019 & 2032
- Table 28: Europe Renewable Aviation Fuel Industry Volume K Tons Forecast, by Application 2019 & 2032
- Table 29: Europe Renewable Aviation Fuel Industry Revenue Million Forecast, by Country 2019 & 2032
- Table 30: Europe Renewable Aviation Fuel Industry Volume K Tons Forecast, by Country 2019 & 2032
- Table 31: Europe Renewable Aviation Fuel Industry Revenue Million Forecast, by Technology 2019 & 2032
- Table 32: Europe Renewable Aviation Fuel Industry Volume K Tons Forecast, by Technology 2019 & 2032
- Table 33: Europe Renewable Aviation Fuel Industry Revenue Million Forecast, by Application 2019 & 2032
- Table 34: Europe Renewable Aviation Fuel Industry Volume K Tons Forecast, by Application 2019 & 2032
- Table 35: Europe Renewable Aviation Fuel Industry Revenue Million Forecast, by Country 2019 & 2032
- Table 36: Europe Renewable Aviation Fuel Industry Volume K Tons Forecast, by Country 2019 & 2032
- Table 37: Europe Renewable Aviation Fuel Industry Revenue Million Forecast, by Technology 2019 & 2032
- Table 38: Europe Renewable Aviation Fuel Industry Volume K Tons Forecast, by Technology 2019 & 2032
- Table 39: Europe Renewable Aviation Fuel Industry Revenue Million Forecast, by Application 2019 & 2032
- Table 40: Europe Renewable Aviation Fuel Industry Volume K Tons Forecast, by Application 2019 & 2032
- Table 41: Europe Renewable Aviation Fuel Industry Revenue Million Forecast, by Country 2019 & 2032
- Table 42: Europe Renewable Aviation Fuel Industry Volume K Tons Forecast, by Country 2019 & 2032
- Table 43: Europe Renewable Aviation Fuel Industry Revenue Million Forecast, by Technology 2019 & 2032
- Table 44: Europe Renewable Aviation Fuel Industry Volume K Tons Forecast, by Technology 2019 & 2032
- Table 45: Europe Renewable Aviation Fuel Industry Revenue Million Forecast, by Application 2019 & 2032
- Table 46: Europe Renewable Aviation Fuel Industry Volume K Tons Forecast, by Application 2019 & 2032
- Table 47: Europe Renewable Aviation Fuel Industry Revenue Million Forecast, by Country 2019 & 2032
- Table 48: Europe Renewable Aviation Fuel Industry Volume K Tons Forecast, by Country 2019 & 2032
Frequently Asked Questions
1. What is the projected Compound Annual Growth Rate (CAGR) of the Europe Renewable Aviation Fuel Industry?
The projected CAGR is approximately > 55.00%.
2. Which companies are prominent players in the Europe Renewable Aviation Fuel Industry?
Key companies in the market include Honeywell International Inc, LanzaTech Inc *List Not Exhaustive, Total Energies SA, Fulcrum BioEnergy Inc, Neste Oyj, Swedish Biofuels AB, Gevo Inc.
3. What are the main segments of the Europe Renewable Aviation Fuel Industry?
The market segments include Technology, Application.
4. Can you provide details about the market size?
The market size is estimated to be USD XX Million as of 2022.
5. What are some drivers contributing to market growth?
4.; Declining Solar Panel Costs4.; Supportive Government Policies.
6. What are the notable trends driving market growth?
Commercial Sector to be the Largest Segment.
7. Are there any restraints impacting market growth?
4.; High Upfront Cost.
8. Can you provide examples of recent developments in the market?
December 2022: TotalEnergies signed a memorandum of understanding to deliver more than one million cubic meters/800,000 tonnes of sustainable aviation fuel to Air France-KLM Group airlines over the ten years from 2023 to 2033.
9. What pricing options are available for accessing the report?
Pricing options include single-user, multi-user, and enterprise licenses priced at USD 4750, USD 5250, and USD 8750 respectively.
10. Is the market size provided in terms of value or volume?
The market size is provided in terms of value, measured in Million and volume, measured in K Tons.
11. Are there any specific market keywords associated with the report?
Yes, the market keyword associated with the report is "Europe Renewable Aviation Fuel Industry," which aids in identifying and referencing the specific market segment covered.
12. How do I determine which pricing option suits my needs best?
The pricing options vary based on user requirements and access needs. Individual users may opt for single-user licenses, while businesses requiring broader access may choose multi-user or enterprise licenses for cost-effective access to the report.
13. Are there any additional resources or data provided in the Europe Renewable Aviation Fuel Industry report?
While the report offers comprehensive insights, it's advisable to review the specific contents or supplementary materials provided to ascertain if additional resources or data are available.
14. How can I stay updated on further developments or reports in the Europe Renewable Aviation Fuel Industry?
To stay informed about further developments, trends, and reports in the Europe Renewable Aviation Fuel Industry, consider subscribing to industry newsletters, following relevant companies and organizations, or regularly checking reputable industry news sources and publications.
Methodology
Step 1 - Identification of Relevant Samples Size from Population Database


Step 2 - Approaches for Defining Global Market Size (Value, Volume* & Price*)

Note*: In applicable scenarios
Step 3 - Data Sources
Primary Research
- Web Analytics
- Survey Reports
- Research Institute
- Latest Research Reports
- Opinion Leaders
Secondary Research
- Annual Reports
- White Paper
- Latest Press Release
- Industry Association
- Paid Database
- Investor Presentations

Step 4 - Data Triangulation
Involves using different sources of information in order to increase the validity of a study
These sources are likely to be stakeholders in a program - participants, other researchers, program staff, other community members, and so on.
Then we put all data in single framework & apply various statistical tools to find out the dynamic on the market.
During the analysis stage, feedback from the stakeholder groups would be compared to determine areas of agreement as well as areas of divergence


