
Key Insights
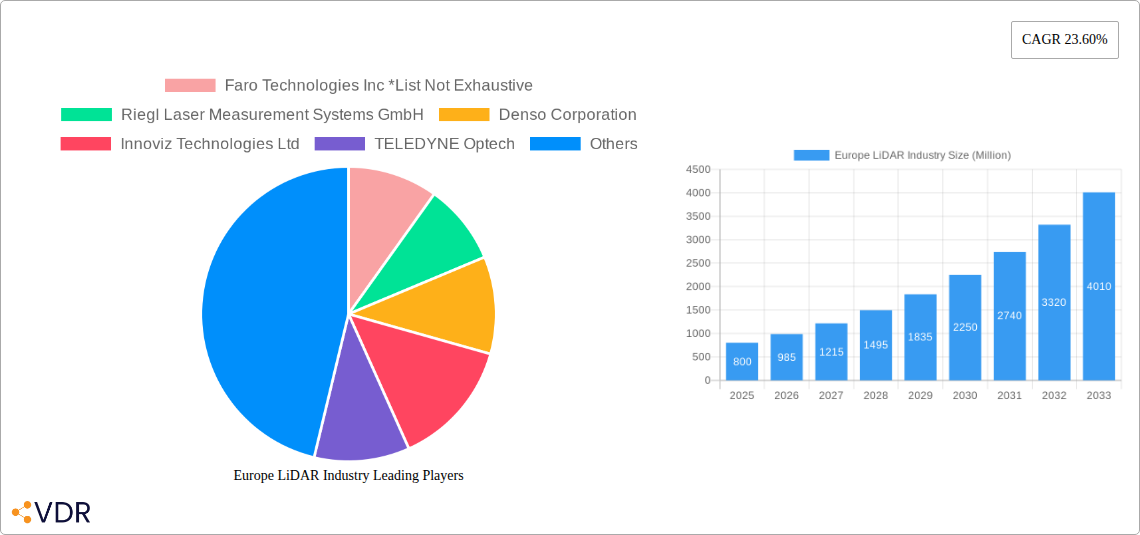
The European LiDAR market is experiencing robust growth, driven by increasing adoption across diverse sectors. The market's Compound Annual Growth Rate (CAGR) of 23.60% from 2019 to 2024 signifies a significant expansion, projecting substantial market size expansion through 2033. Key drivers include the rising demand for autonomous vehicles, precision agriculture, and advancements in 3D mapping and surveying. The automotive industry is a major contributor, with LiDAR technology crucial for the development of advanced driver-assistance systems (ADAS) and self-driving cars. Furthermore, the construction and engineering sectors are leveraging LiDAR for precise measurements and efficient project management. The growth is further fueled by continuous technological advancements in LiDAR sensors, offering improved accuracy, range, and cost-effectiveness. Ground-based LiDAR systems are currently dominating the market due to their widespread use in surveying and mapping applications, while aerial LiDAR is gaining traction for large-scale mapping projects.
However, certain restraints exist, including the high initial investment costs associated with LiDAR systems and the need for skilled personnel for data processing and interpretation. The market's segmentation reveals a strong presence across several European countries, with Germany, the United Kingdom, and France leading the way due to their strong technological infrastructure and significant investments in infrastructure development and autonomous vehicle technology. The competitive landscape is dynamic, featuring both established players like Leica Geosystems, Trimble, and Velodyne Lidar, and emerging innovative companies focusing on specific niche applications within the market. This competition fosters innovation and drives down costs, potentially further accelerating market growth in the years to come. The continued focus on sustainable infrastructure development and advancements in autonomous technologies will likely propel the European LiDAR market to even greater heights in the forecast period (2025-2033).
Europe LiDAR Industry Market Report: 2019-2033
This comprehensive report provides an in-depth analysis of the European LiDAR industry, covering market dynamics, growth trends, key players, and future outlook. With a focus on both parent and child markets, this report is an essential resource for industry professionals, investors, and strategic decision-makers. The study period spans from 2019 to 2033, with 2025 as the base and estimated year.
Study Period: 2019–2033 Base Year: 2025 Estimated Year: 2025 Forecast Period: 2025–2033 Historical Period: 2019–2024
Europe LiDAR Industry Market Dynamics & Structure
The European LiDAR market is experiencing robust growth, driven by technological advancements, increasing demand across various sectors, and supportive regulatory frameworks. Market concentration is moderate, with several key players holding significant market share, but a fragmented landscape also exists with numerous smaller companies. The market is characterized by continuous technological innovation, particularly in areas such as sensor miniaturization, improved accuracy, and data processing capabilities. Regulatory frameworks, while generally supportive of LiDAR adoption, vary across European nations and sometimes present challenges related to data privacy and safety standards. Competition from alternative technologies, such as radar and cameras, exists, but LiDAR's unique 3D imaging capabilities offer a competitive advantage in applications demanding high accuracy. End-user demographics are diverse, spanning engineering, automotive, industrial, aerospace & defense sectors, with the automotive sector currently showing the most significant growth. M&A activity has been steady, with strategic acquisitions boosting both market consolidation and technological integration.
- Market Concentration: Moderate, with xx% held by top 5 players in 2024.
- Technological Innovation: Focus on improved range, accuracy, and miniaturization driving continuous advancements.
- Regulatory Frameworks: Vary across Europe, impacting adoption rates and necessitating compliance adjustments.
- Competitive Substitutes: Radar and camera systems pose some competition, but LiDAR offers unique advantages.
- End-User Demographics: Strong demand from automotive, engineering, and industrial sectors, with Aerospace and Defence exhibiting steady growth.
- M&A Activity: xx deals recorded between 2019-2024, driven by strategic expansion and technological integration.
Europe LiDAR Industry Growth Trends & Insights
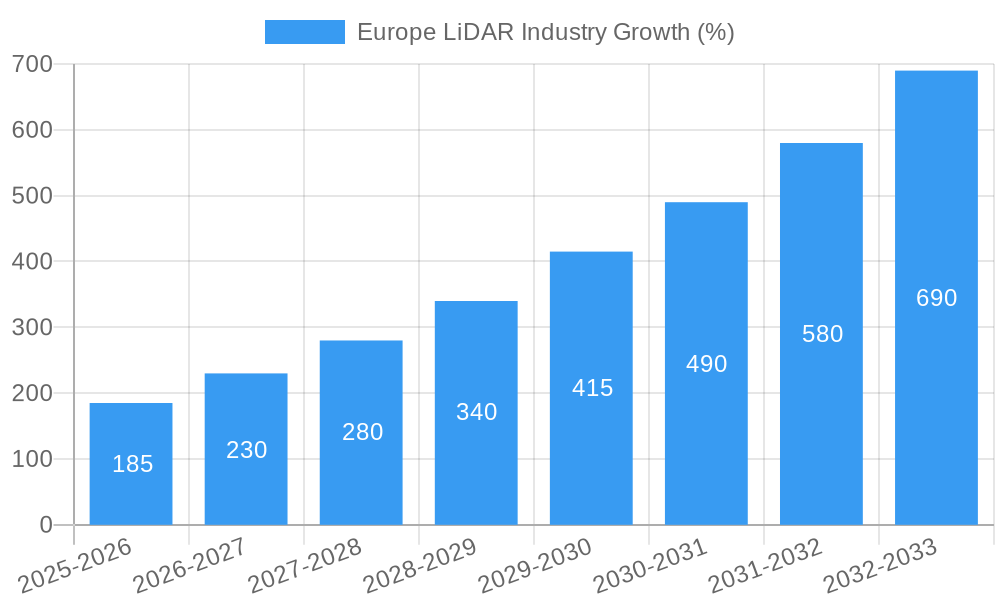
The European LiDAR market exhibited significant growth during the historical period (2019-2024), driven by increasing adoption across various sectors, especially automotive. The market is expected to maintain a strong growth trajectory during the forecast period (2025-2033), with a Compound Annual Growth Rate (CAGR) of xx%. This growth is fueled by technological advancements, leading to reduced costs and improved performance of LiDAR systems. The automotive industry's transition towards autonomous driving is a primary driver, creating significant demand for high-performance LiDAR sensors. Adoption rates are increasing across all end-user industries, with the engineering and industrial segments experiencing notable growth alongside the automotive industry. Consumer behavior shifts towards safer and more efficient transportation and infrastructure are further boosting market demand. Technological disruptions, such as the development of solid-state LiDAR, are expected to further accelerate market growth in the coming years. Increased accessibility of affordable, high-performance LiDAR is creating new opportunities in a range of applications. Market penetration is expected to increase from xx% in 2024 to xx% by 2033.
Dominant Regions, Countries, or Segments in Europe LiDAR Industry
The German and UK markets are currently the leading regions driving market growth within Europe, exhibiting the highest adoption rates and significant investments in LiDAR technology. Germany benefits from its strong automotive industry and technological prowess, while the UK is witnessing substantial growth in infrastructure development and autonomous vehicle testing. France and the Netherlands also present notable growth opportunities. The automotive end-user segment shows the strongest growth, followed closely by the engineering and industrial sectors. Within LiDAR products, ground-based LiDAR currently holds a larger market share than aerial LiDAR, but the latter is expected to experience significant growth driven by advancements in drone technology and increased application in surveying and mapping. Laser scanners constitute the largest component market, followed by GPS and Inertial Measurement Units (IMU).
- Key Drivers (Germany): Strong automotive industry, robust technological infrastructure, government support for R&D.
- Key Drivers (UK): Significant investments in infrastructure projects, focus on autonomous vehicle development.
- Key Drivers (Automotive Segment): Rapid adoption of autonomous driving technologies, increased safety regulations.
- Key Drivers (Ground-Based LiDAR): Wider range of applications, cost-effectiveness compared to aerial systems.
- Key Drivers (Laser Scanners): Core component of LiDAR systems, high demand across various applications.
Europe LiDAR Industry Product Landscape
The LiDAR product landscape is evolving rapidly, with innovations focused on improving performance, reducing costs, and expanding applications. Solid-state LiDAR technology is gaining traction, offering advantages in size, weight, power consumption, and reliability compared to traditional mechanical LiDAR. New applications are emerging in areas such as robotics, precision agriculture, and environmental monitoring. Key performance metrics, including range, accuracy, field of view, and frame rate, are constantly being improved, pushing the boundaries of what's possible with LiDAR technology. Unique selling propositions are increasingly focused on specific application needs, such as high-resolution imaging for autonomous driving or long-range detection for surveying. Technological advancements are driven by improvements in laser technology, sensor design, and data processing algorithms.
Key Drivers, Barriers & Challenges in Europe LiDAR Industry
Key Drivers: The increasing demand for autonomous vehicles, advancements in sensor technology leading to lower costs and improved performance, and government initiatives promoting the adoption of LiDAR in various sectors are driving market growth. Furthermore, the growing need for precise 3D mapping in infrastructure development and urban planning significantly contributes to the market's expansion.
Challenges: High initial investment costs for LiDAR systems can be a barrier to entry for some companies. Supply chain disruptions, particularly of crucial components such as lasers and semiconductors, can lead to production delays and increased prices. Regulatory uncertainties and data privacy concerns can also hinder wider adoption. The competition from alternative sensing technologies such as radar and cameras poses a significant challenge. Furthermore, ensuring sufficient skilled labor for LiDAR system development and maintenance remains a challenge for companies within the industry. The competitive landscape, characterized by both established players and emerging startups, creates intense market pressure.
Emerging Opportunities in Europe LiDAR Industry
Untapped markets in sectors like precision agriculture and environmental monitoring present significant opportunities for LiDAR technology. The development of new applications in robotics and industrial automation further expands market potential. Evolving consumer preferences towards safer, more efficient, and environmentally friendly solutions will drive demand for LiDAR-based systems. The growing adoption of smart cities initiatives presents opportunities for integrating LiDAR into urban infrastructure monitoring and management systems. The increasing demand for high-resolution 3D mapping for various applications presents another significant opportunity. Expanding into new geographic regions and further developing integration solutions will create further growth potential.
Growth Accelerators in the Europe LiDAR Industry
Technological breakthroughs in solid-state LiDAR and improved data processing capabilities are key growth accelerators. Strategic partnerships between LiDAR manufacturers and automotive companies are driving rapid adoption in the autonomous vehicle sector. Market expansion strategies targeting new applications and geographic regions will further accelerate growth. Government support and initiatives promoting LiDAR technology adoption are essential catalysts. The development of innovative business models and service offerings will drive wider market penetration. Investments in research and development aimed at enhancing LiDAR's capabilities will drive innovation.
Key Players Shaping the Europe LiDAR Industry Market
- Faro Technologies Inc
- Riegl Laser Measurement Systems GmbH
- Denso Corporation
- Innoviz Technologies Ltd
- TELEDYNE Optech
- Quanergy Systems Inc
- Phantom Intelligence Inc
- Velodyne Lidar Inc
- Geoslam
- Trimble Inc
- Topcon Corporation
- Sick AG
- Neptec Technologies Corp
- Leica Geosystems AG
Notable Milestones in Europe LiDAR Industry Sector
- June 2022: Stellantis selects Valeo's third-generation LiDAR for Level 3 automation in multiple vehicle models from 2024. This signifies a major step towards widespread adoption of advanced driver-assistance systems (ADAS).
- January 2022: Blickfeld launches Qb2, a smart LiDAR integrating software and hardware, simplifying 3D data capture and processing. This reflects the trend towards more integrated and user-friendly LiDAR solutions.
In-Depth Europe LiDAR Industry Market Outlook
The European LiDAR market is poised for significant growth over the next decade, driven by technological advancements, increasing adoption across various sectors, and supportive regulatory environments. The continued development of solid-state LiDAR, cost reductions, and increased performance will unlock new market opportunities. Strategic partnerships and market expansion initiatives will fuel long-term growth. The focus on developing innovative applications in areas such as smart cities, autonomous vehicles, and precision agriculture will further propel market expansion. The market's future potential is considerable, offering ample strategic opportunities for businesses to participate in this dynamic and rapidly evolving sector.
Europe LiDAR Industry Segmentation
-
1. Product
- 1.1. Aerial LiDAR
- 1.2. Ground-based LiDAR
-
2. Component
- 2.1. GPS
- 2.2. Laser Scanners
- 2.3. Inertial Measurement Unit
- 2.4. Other Components
-
3. End-user Industry
- 3.1. Engineering
- 3.2. Automotive
- 3.3. Industrial
- 3.4. Aerospace and Defense
Europe LiDAR Industry Segmentation By Geography
-
1. Europe
- 1.1. United Kingdom
- 1.2. Germany
- 1.3. France
- 1.4. Italy
- 1.5. Spain
- 1.6. Netherlands
- 1.7. Belgium
- 1.8. Sweden
- 1.9. Norway
- 1.10. Poland
- 1.11. Denmark
Europe LiDAR Industry REPORT HIGHLIGHTS
| Aspects | Details |
|---|---|
| Study Period | 2019-2033 |
| Base Year | 2024 |
| Estimated Year | 2025 |
| Forecast Period | 2025-2033 |
| Historical Period | 2019-2024 |
| Growth Rate | CAGR of 23.60% from 2019-2033 |
| Segmentation |
|
Table of Contents
- 1. Introduction
- 1.1. Research Scope
- 1.2. Market Segmentation
- 1.3. Research Methodology
- 1.4. Definitions and Assumptions
- 2. Executive Summary
- 2.1. Introduction
- 3. Market Dynamics
- 3.1. Introduction
- 3.2. Market Drivers
- 3.2.1. Fast Paced Developments and Increasing Applications of Drones; Increasing Adoption in the Automotive Industry
- 3.3. Market Restrains
- 3.3.1. High Cost of the LiDAR Systems
- 3.4. Market Trends
- 3.4.1. Engineering Industry to Hold Considerable Market Share
- 4. Market Factor Analysis
- 4.1. Porters Five Forces
- 4.2. Supply/Value Chain
- 4.3. PESTEL analysis
- 4.4. Market Entropy
- 4.5. Patent/Trademark Analysis
- 5. Europe LiDAR Industry Analysis, Insights and Forecast, 2019-2031
- 5.1. Market Analysis, Insights and Forecast - by Product
- 5.1.1. Aerial LiDAR
- 5.1.2. Ground-based LiDAR
- 5.2. Market Analysis, Insights and Forecast - by Component
- 5.2.1. GPS
- 5.2.2. Laser Scanners
- 5.2.3. Inertial Measurement Unit
- 5.2.4. Other Components
- 5.3. Market Analysis, Insights and Forecast - by End-user Industry
- 5.3.1. Engineering
- 5.3.2. Automotive
- 5.3.3. Industrial
- 5.3.4. Aerospace and Defense
- 5.4. Market Analysis, Insights and Forecast - by Region
- 5.4.1. Europe
- 5.1. Market Analysis, Insights and Forecast - by Product
- 6. Germany Europe LiDAR Industry Analysis, Insights and Forecast, 2019-2031
- 7. France Europe LiDAR Industry Analysis, Insights and Forecast, 2019-2031
- 8. Italy Europe LiDAR Industry Analysis, Insights and Forecast, 2019-2031
- 9. United Kingdom Europe LiDAR Industry Analysis, Insights and Forecast, 2019-2031
- 10. Netherlands Europe LiDAR Industry Analysis, Insights and Forecast, 2019-2031
- 11. Sweden Europe LiDAR Industry Analysis, Insights and Forecast, 2019-2031
- 12. Rest of Europe Europe LiDAR Industry Analysis, Insights and Forecast, 2019-2031
- 13. Competitive Analysis
- 13.1. Market Share Analysis 2024
- 13.2. Company Profiles
- 13.2.1 Faro Technologies Inc *List Not Exhaustive
- 13.2.1.1. Overview
- 13.2.1.2. Products
- 13.2.1.3. SWOT Analysis
- 13.2.1.4. Recent Developments
- 13.2.1.5. Financials (Based on Availability)
- 13.2.2 Riegl Laser Measurement Systems GmbH
- 13.2.2.1. Overview
- 13.2.2.2. Products
- 13.2.2.3. SWOT Analysis
- 13.2.2.4. Recent Developments
- 13.2.2.5. Financials (Based on Availability)
- 13.2.3 Denso Corporation
- 13.2.3.1. Overview
- 13.2.3.2. Products
- 13.2.3.3. SWOT Analysis
- 13.2.3.4. Recent Developments
- 13.2.3.5. Financials (Based on Availability)
- 13.2.4 Innoviz Technologies Ltd
- 13.2.4.1. Overview
- 13.2.4.2. Products
- 13.2.4.3. SWOT Analysis
- 13.2.4.4. Recent Developments
- 13.2.4.5. Financials (Based on Availability)
- 13.2.5 TELEDYNE Optech
- 13.2.5.1. Overview
- 13.2.5.2. Products
- 13.2.5.3. SWOT Analysis
- 13.2.5.4. Recent Developments
- 13.2.5.5. Financials (Based on Availability)
- 13.2.6 Quanergy Systems Inc
- 13.2.6.1. Overview
- 13.2.6.2. Products
- 13.2.6.3. SWOT Analysis
- 13.2.6.4. Recent Developments
- 13.2.6.5. Financials (Based on Availability)
- 13.2.7 Phantom Intelligence Inc
- 13.2.7.1. Overview
- 13.2.7.2. Products
- 13.2.7.3. SWOT Analysis
- 13.2.7.4. Recent Developments
- 13.2.7.5. Financials (Based on Availability)
- 13.2.8 Velodyne Lidar Inc
- 13.2.8.1. Overview
- 13.2.8.2. Products
- 13.2.8.3. SWOT Analysis
- 13.2.8.4. Recent Developments
- 13.2.8.5. Financials (Based on Availability)
- 13.2.9 Geoslam
- 13.2.9.1. Overview
- 13.2.9.2. Products
- 13.2.9.3. SWOT Analysis
- 13.2.9.4. Recent Developments
- 13.2.9.5. Financials (Based on Availability)
- 13.2.10 Trimble Inc
- 13.2.10.1. Overview
- 13.2.10.2. Products
- 13.2.10.3. SWOT Analysis
- 13.2.10.4. Recent Developments
- 13.2.10.5. Financials (Based on Availability)
- 13.2.11 Topcon Corporation
- 13.2.11.1. Overview
- 13.2.11.2. Products
- 13.2.11.3. SWOT Analysis
- 13.2.11.4. Recent Developments
- 13.2.11.5. Financials (Based on Availability)
- 13.2.12 Sick Ag
- 13.2.12.1. Overview
- 13.2.12.2. Products
- 13.2.12.3. SWOT Analysis
- 13.2.12.4. Recent Developments
- 13.2.12.5. Financials (Based on Availability)
- 13.2.13 Neptec Technologies Corp
- 13.2.13.1. Overview
- 13.2.13.2. Products
- 13.2.13.3. SWOT Analysis
- 13.2.13.4. Recent Developments
- 13.2.13.5. Financials (Based on Availability)
- 13.2.14 Leica Geosystems Ag
- 13.2.14.1. Overview
- 13.2.14.2. Products
- 13.2.14.3. SWOT Analysis
- 13.2.14.4. Recent Developments
- 13.2.14.5. Financials (Based on Availability)
- 13.2.1 Faro Technologies Inc *List Not Exhaustive
List of Figures
- Figure 1: Europe LiDAR Industry Revenue Breakdown (Million, %) by Product 2024 & 2032
- Figure 2: Europe LiDAR Industry Share (%) by Company 2024
List of Tables
- Table 1: Europe LiDAR Industry Revenue Million Forecast, by Region 2019 & 2032
- Table 2: Europe LiDAR Industry Revenue Million Forecast, by Product 2019 & 2032
- Table 3: Europe LiDAR Industry Revenue Million Forecast, by Component 2019 & 2032
- Table 4: Europe LiDAR Industry Revenue Million Forecast, by End-user Industry 2019 & 2032
- Table 5: Europe LiDAR Industry Revenue Million Forecast, by Region 2019 & 2032
- Table 6: Europe LiDAR Industry Revenue Million Forecast, by Country 2019 & 2032
- Table 7: Germany Europe LiDAR Industry Revenue (Million) Forecast, by Application 2019 & 2032
- Table 8: France Europe LiDAR Industry Revenue (Million) Forecast, by Application 2019 & 2032
- Table 9: Italy Europe LiDAR Industry Revenue (Million) Forecast, by Application 2019 & 2032
- Table 10: United Kingdom Europe LiDAR Industry Revenue (Million) Forecast, by Application 2019 & 2032
- Table 11: Netherlands Europe LiDAR Industry Revenue (Million) Forecast, by Application 2019 & 2032
- Table 12: Sweden Europe LiDAR Industry Revenue (Million) Forecast, by Application 2019 & 2032
- Table 13: Rest of Europe Europe LiDAR Industry Revenue (Million) Forecast, by Application 2019 & 2032
- Table 14: Europe LiDAR Industry Revenue Million Forecast, by Product 2019 & 2032
- Table 15: Europe LiDAR Industry Revenue Million Forecast, by Component 2019 & 2032
- Table 16: Europe LiDAR Industry Revenue Million Forecast, by End-user Industry 2019 & 2032
- Table 17: Europe LiDAR Industry Revenue Million Forecast, by Country 2019 & 2032
- Table 18: United Kingdom Europe LiDAR Industry Revenue (Million) Forecast, by Application 2019 & 2032
- Table 19: Germany Europe LiDAR Industry Revenue (Million) Forecast, by Application 2019 & 2032
- Table 20: France Europe LiDAR Industry Revenue (Million) Forecast, by Application 2019 & 2032
- Table 21: Italy Europe LiDAR Industry Revenue (Million) Forecast, by Application 2019 & 2032
- Table 22: Spain Europe LiDAR Industry Revenue (Million) Forecast, by Application 2019 & 2032
- Table 23: Netherlands Europe LiDAR Industry Revenue (Million) Forecast, by Application 2019 & 2032
- Table 24: Belgium Europe LiDAR Industry Revenue (Million) Forecast, by Application 2019 & 2032
- Table 25: Sweden Europe LiDAR Industry Revenue (Million) Forecast, by Application 2019 & 2032
- Table 26: Norway Europe LiDAR Industry Revenue (Million) Forecast, by Application 2019 & 2032
- Table 27: Poland Europe LiDAR Industry Revenue (Million) Forecast, by Application 2019 & 2032
- Table 28: Denmark Europe LiDAR Industry Revenue (Million) Forecast, by Application 2019 & 2032
Frequently Asked Questions
1. What is the projected Compound Annual Growth Rate (CAGR) of the Europe LiDAR Industry?
The projected CAGR is approximately 23.60%.
2. Which companies are prominent players in the Europe LiDAR Industry?
Key companies in the market include Faro Technologies Inc *List Not Exhaustive, Riegl Laser Measurement Systems GmbH, Denso Corporation, Innoviz Technologies Ltd, TELEDYNE Optech, Quanergy Systems Inc, Phantom Intelligence Inc, Velodyne Lidar Inc, Geoslam, Trimble Inc, Topcon Corporation, Sick Ag, Neptec Technologies Corp, Leica Geosystems Ag.
3. What are the main segments of the Europe LiDAR Industry?
The market segments include Product, Component, End-user Industry.
4. Can you provide details about the market size?
The market size is estimated to be USD XX Million as of 2022.
5. What are some drivers contributing to market growth?
Fast Paced Developments and Increasing Applications of Drones; Increasing Adoption in the Automotive Industry.
6. What are the notable trends driving market growth?
Engineering Industry to Hold Considerable Market Share.
7. Are there any restraints impacting market growth?
High Cost of the LiDAR Systems.
8. Can you provide examples of recent developments in the market?
June 2022 - Stellantis has selected Valeo's third-generation LiDAR to equip multiple models of its different automotive brands from 2024. The Valeo SCALA 3 LiDAR will enable these vehicles to be certified for level 3 automation. Valeo's third-generation LiDAR sees everything, even if it is far ahead and invisible to the human eye. It can detect objects more than 150 meters away that the human eye, cameras, and radars cannot, such as small objects with very low reflectivity.
9. What pricing options are available for accessing the report?
Pricing options include single-user, multi-user, and enterprise licenses priced at USD 4750, USD 4950, and USD 6800 respectively.
10. Is the market size provided in terms of value or volume?
The market size is provided in terms of value, measured in Million.
11. Are there any specific market keywords associated with the report?
Yes, the market keyword associated with the report is "Europe LiDAR Industry," which aids in identifying and referencing the specific market segment covered.
12. How do I determine which pricing option suits my needs best?
The pricing options vary based on user requirements and access needs. Individual users may opt for single-user licenses, while businesses requiring broader access may choose multi-user or enterprise licenses for cost-effective access to the report.
13. Are there any additional resources or data provided in the Europe LiDAR Industry report?
While the report offers comprehensive insights, it's advisable to review the specific contents or supplementary materials provided to ascertain if additional resources or data are available.
14. How can I stay updated on further developments or reports in the Europe LiDAR Industry?
To stay informed about further developments, trends, and reports in the Europe LiDAR Industry, consider subscribing to industry newsletters, following relevant companies and organizations, or regularly checking reputable industry news sources and publications.
Methodology
Step 1 - Identification of Relevant Samples Size from Population Database


Step 2 - Approaches for Defining Global Market Size (Value, Volume* & Price*)

Note*: In applicable scenarios
Step 3 - Data Sources
Primary Research
- Web Analytics
- Survey Reports
- Research Institute
- Latest Research Reports
- Opinion Leaders
Secondary Research
- Annual Reports
- White Paper
- Latest Press Release
- Industry Association
- Paid Database
- Investor Presentations

Step 4 - Data Triangulation
Involves using different sources of information in order to increase the validity of a study
These sources are likely to be stakeholders in a program - participants, other researchers, program staff, other community members, and so on.
Then we put all data in single framework & apply various statistical tools to find out the dynamic on the market.
During the analysis stage, feedback from the stakeholder groups would be compared to determine areas of agreement as well as areas of divergence


