
Key Insights
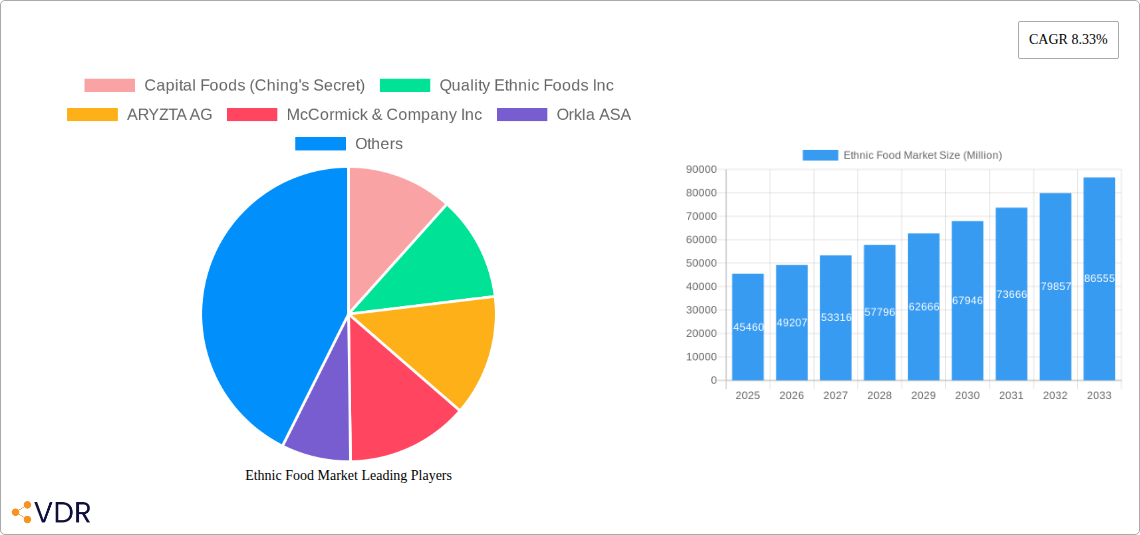
The global ethnic food market, valued at $45.46 billion in 2025, is projected to experience robust growth, driven by several key factors. The increasing popularity of diverse cuisines, fueled by globalization and immigration, is a primary driver. Consumers are increasingly adventurous in their culinary choices, seeking authentic and exotic flavors beyond traditional fare. This trend is further amplified by the rise of social media and food blogs, which expose consumers to a wider range of ethnic foods and recipes. Convenience also plays a significant role, with the growth of online retail channels offering easy access to a diverse range of products. Supermarkets and hypermarkets remain dominant distribution channels, but the online sector is rapidly gaining market share, particularly amongst younger demographics. Furthermore, the rising disposable incomes in developing economies, especially in Asia-Pacific and South America, are contributing to increased spending on ethnic food products. Competition among established players like McCormick & Company Inc and Ajinomoto Co Inc, as well as the emergence of smaller, specialized brands focusing on niche ethnic cuisines, is intensifying.
However, certain challenges exist. Maintaining consistent product quality and authenticity while scaling production can be difficult. Fluctuations in the price of raw materials and supply chain disruptions can also affect profitability. Additionally, cultural nuances and preferences in different regions necessitate targeted marketing strategies, which can increase operational costs. Despite these restraints, the market's inherent growth potential, driven by evolving consumer preferences and demographic shifts, suggests a positive outlook for the foreseeable future. The projected CAGR of 8.33% indicates substantial growth throughout the forecast period (2025-2033), with significant opportunities for companies that effectively navigate the market's dynamics and capitalize on the increasing demand for diverse and authentic culinary experiences.
Ethnic Food Market: A Comprehensive Market Report (2019-2033)
This in-depth report provides a comprehensive analysis of the Ethnic Food Market, offering invaluable insights for industry professionals, investors, and strategic decision-makers. The report covers market dynamics, growth trends, regional analysis, competitive landscape, and future outlook, providing a 360-degree view of this dynamic sector. With a study period spanning 2019-2033, a base year of 2025, and an estimated year of 2025, this report delivers crucial data for informed strategic planning. The total market size in 2025 is estimated at XX Million.
Ethnic Food Market Market Dynamics & Structure
The Ethnic Food Market, a dynamic segment within the broader food and beverage industry, is characterized by increasing consumer demand for diverse culinary experiences and expanding global palates. Market concentration is moderate, with several key players holding significant shares, while a multitude of smaller regional and niche players contribute to the overall landscape. Technological advancements, such as improved food preservation techniques and innovative packaging solutions, are key drivers of market growth. Regulatory frameworks, particularly those concerning food safety and labeling, significantly influence market operations. The emergence of substitutes, like plant-based alternatives and healthier ethnic options, presents both challenges and opportunities for traditional players. End-user demographics, increasingly diverse and globally connected, are a significant catalyst for growth, while M&A activity showcases the industry’s dynamism.
- Market Concentration: Moderate, with top 5 players holding approximately xx% market share in 2025.
- Technological Innovation: Focus on improved preservation, sustainable packaging, and automation.
- Regulatory Landscape: Stringent food safety and labeling regulations, varying across regions.
- Competitive Substitutes: Plant-based alternatives and health-conscious ethnic food options gaining traction.
- End-User Demographics: Increasingly diverse and globally influenced consumer preferences drive demand.
- M&A Activity: XX deals recorded between 2019-2024, indicating a consolidated and growing market.
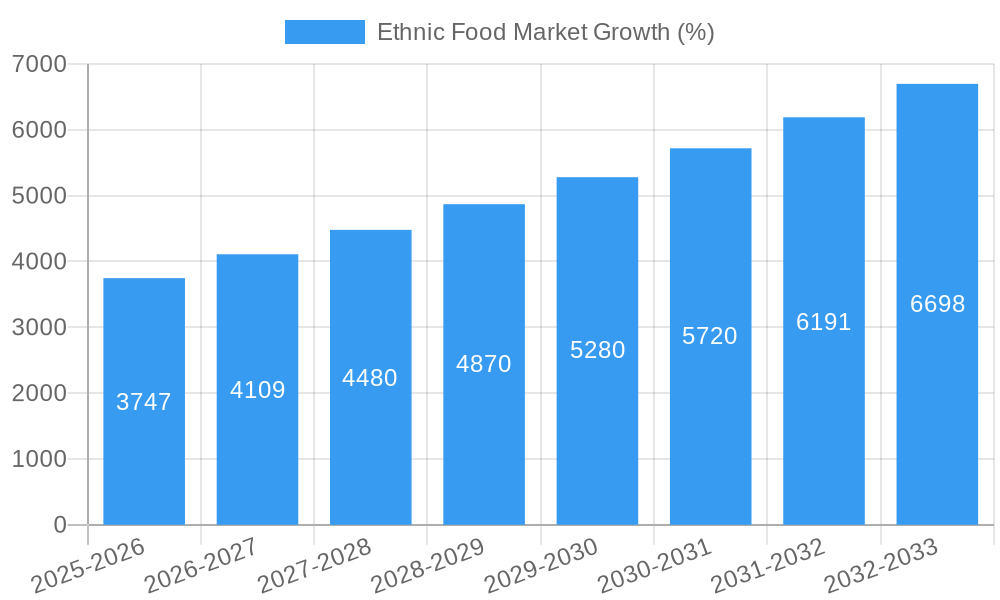
Ethnic Food Market Growth Trends & Insights
The Ethnic Food Market exhibits robust growth, driven by several factors. Market size has experienced a significant expansion over the historical period (2019-2024), reaching an estimated XX Million in 2025. The CAGR during this period is estimated at xx%. Increased adoption rates, particularly among younger demographics, contribute significantly to market expansion. Technological disruptions, such as online grocery delivery platforms and meal kit services catering to ethnic cuisines, further accelerate growth. Consumer behavior shifts towards greater convenience, exploration of diverse cuisines, and demand for authentic flavors are key catalysts. Changing lifestyles and increasing disposable incomes in emerging economies also underpin this growth trajectory. Market penetration continues to rise, fueled by both established brands expanding their reach and a proliferation of new entrants.
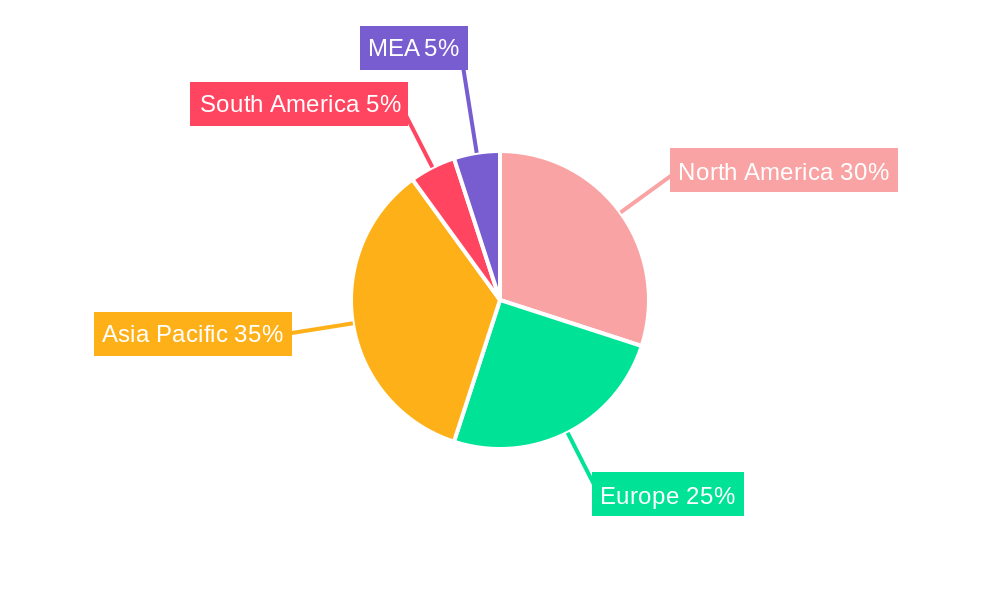
Dominant Regions, Countries, or Segments in Ethnic Food Market
The Ethnic Food Market demonstrates strong regional variations in growth and dominance. Supermarkets/Hypermarkets currently hold the largest market share among distribution channels in 2025, projected at XX Million, representing approximately xx% of the total market. This dominance is attributed to factors such as wide consumer reach, established supply chains, and effective product placement strategies. Online retail channels, however, are experiencing the fastest growth, projected to reach XX Million by 2033, representing a CAGR of xx%.
- Supermarkets/Hypermarkets: Wide reach, established supply chains, and strategic product placement contribute to market leadership.
- Convenience Stores: Growing demand for convenient ethnic food options fuels moderate growth.
- Online Retail Channels: Fastest-growing segment, driven by e-commerce expansion and changing consumer preferences.
- Other Distribution Channels: Includes ethnic grocery stores, specialty food shops, and direct-to-consumer channels.
Ethnic Food Market Product Landscape
The Ethnic Food Market showcases a diverse product landscape, encompassing ready-to-eat meals, sauces, spices, snacks, and bakery items representing a variety of ethnic cuisines. Product innovation focuses on convenience, health-conscious options (e.g., low-sodium, gluten-free), and authentic flavor profiles. Technological advancements in food processing and packaging enhance shelf life and maintain product quality. Unique selling propositions frequently emphasize authenticity, convenience, and high-quality ingredients.
Key Drivers, Barriers & Challenges in Ethnic Food Market
Key Drivers:
- Increasing demand for diverse and authentic culinary experiences.
- Rising disposable incomes and changing lifestyles in emerging economies.
- Expansion of e-commerce and online grocery delivery platforms.
- Government initiatives promoting food diversification and culinary tourism.
Challenges & Restraints:
- Maintaining authenticity while catering to diverse consumer preferences.
- Fluctuations in raw material costs and supply chain disruptions.
- Stringent food safety regulations and labeling requirements.
- Intense competition among established brands and new entrants. The impact of these challenges is estimated to reduce market growth by approximately xx% by 2033.
Emerging Opportunities in Ethnic Food Market
Emerging opportunities abound in the Ethnic Food Market. Untapped markets in developing regions, particularly in Asia and Africa, offer significant growth potential. Innovative applications, such as meal kits catering to specific dietary restrictions or ethnic diets, present a substantial avenue for expansion. Evolving consumer preferences towards convenience, health, and sustainability drive demand for innovative product formats. The expansion of ethnic food into mainstream culinary culture provides additional opportunities.
Growth Accelerators in the Ethnic Food Market Industry
Long-term growth in the Ethnic Food Market is significantly propelled by several factors. Technological advancements, including improved food processing techniques and smart packaging solutions, enhance product quality, shelf life, and convenience. Strategic partnerships, such as collaborations between established brands and emerging ethnic food businesses, unlock new markets and distribution channels. Market expansion strategies, including global product launches and aggressive marketing campaigns targeting niche consumer segments, will accelerate growth.
Key Players Shaping the Ethnic Food Market Market
- Capital Foods (Ching's Secret)
- Quality Ethnic Foods Inc
- ARYZTA AG
- McCormick & Company Inc
- Orkla ASA
- Ajinomoto Co Inc
- Charlie Bigham
- The Spice Tailor
- Paulig Ltd
- Associated British Foods PLC
- Asli Fine Foods
- General Mills Inc (Old El Paso)
Notable Milestones in Ethnic Food Market Sector
- October 2021: General Mills expanded its Old El Paso range with new flavored taco shells.
- January 2022: Paulig acquired Liven, expanding its Tex-Mex and snacking activities.
- February 2022: Aryzta acquired De-Luxe Food Services, strengthening its bakery position in Malaysia.
- February 2022: Patak launched its "Patak's Makes Perfect" TV advertisement.
In-Depth Ethnic Food Market Market Outlook
The Ethnic Food Market is poised for continued robust growth throughout the forecast period (2025-2033). The increasing globalization of tastes, coupled with technological advancements and strategic market expansion by key players, will drive market expansion. Opportunities abound in emerging markets and through the development of innovative product offerings catering to evolving consumer preferences. Strategic partnerships and investments in research and development will further accelerate the growth of this dynamic sector. The market is projected to reach XX Million by 2033.
Ethnic Food Market Segmentation
-
1. Distribution Channel
- 1.1. Supermarkets/Hypermarkets
- 1.2. Convenience Stores
- 1.3. Online Retail Channels
- 1.4. Other Distribution Channels
Ethnic Food Market Segmentation By Geography
-
1. North America
- 1.1. United States
- 1.2. Canada
- 1.3. Mexico
- 1.4. Rest of North America
-
2. Europe
- 2.1. United Kingdom
- 2.2. Germany
- 2.3. Spain
- 2.4. France
- 2.5. Italy
- 2.6. Russia
- 2.7. Rest of Europe
-
3. Asia Pacific
- 3.1. China
- 3.2. Japan
- 3.3. India
- 3.4. Australia
- 3.5. Rest of Asia Pacific
-
4. Rest of the World
- 4.1. South America
- 4.2. Middle East
Ethnic Food Market REPORT HIGHLIGHTS
| Aspects | Details |
|---|---|
| Study Period | 2019-2033 |
| Base Year | 2024 |
| Estimated Year | 2025 |
| Forecast Period | 2025-2033 |
| Historical Period | 2019-2024 |
| Growth Rate | CAGR of 8.33% from 2019-2033 |
| Segmentation |
|
Table of Contents
- 1. Introduction
- 1.1. Research Scope
- 1.2. Market Segmentation
- 1.3. Research Methodology
- 1.4. Definitions and Assumptions
- 2. Executive Summary
- 2.1. Introduction
- 3. Market Dynamics
- 3.1. Introduction
- 3.2. Market Drivers
- 3.2.1. Consumer inclination toward functional food and beverages; Increasing Number of Applications and Growing Industrial Use
- 3.3. Market Restrains
- 3.3.1. Increasing Shift Toward Plant-Based Protein
- 3.4. Market Trends
- 3.4.1. Presence of Asian Cuisine in the US Ethnic Food Marketspace
- 4. Market Factor Analysis
- 4.1. Porters Five Forces
- 4.2. Supply/Value Chain
- 4.3. PESTEL analysis
- 4.4. Market Entropy
- 4.5. Patent/Trademark Analysis
- 5. Global Ethnic Food Market Analysis, Insights and Forecast, 2019-2031
- 5.1. Market Analysis, Insights and Forecast - by Distribution Channel
- 5.1.1. Supermarkets/Hypermarkets
- 5.1.2. Convenience Stores
- 5.1.3. Online Retail Channels
- 5.1.4. Other Distribution Channels
- 5.2. Market Analysis, Insights and Forecast - by Region
- 5.2.1. North America
- 5.2.2. Europe
- 5.2.3. Asia Pacific
- 5.2.4. Rest of the World
- 5.1. Market Analysis, Insights and Forecast - by Distribution Channel
- 6. North America Ethnic Food Market Analysis, Insights and Forecast, 2019-2031
- 6.1. Market Analysis, Insights and Forecast - by Distribution Channel
- 6.1.1. Supermarkets/Hypermarkets
- 6.1.2. Convenience Stores
- 6.1.3. Online Retail Channels
- 6.1.4. Other Distribution Channels
- 6.1. Market Analysis, Insights and Forecast - by Distribution Channel
- 7. Europe Ethnic Food Market Analysis, Insights and Forecast, 2019-2031
- 7.1. Market Analysis, Insights and Forecast - by Distribution Channel
- 7.1.1. Supermarkets/Hypermarkets
- 7.1.2. Convenience Stores
- 7.1.3. Online Retail Channels
- 7.1.4. Other Distribution Channels
- 7.1. Market Analysis, Insights and Forecast - by Distribution Channel
- 8. Asia Pacific Ethnic Food Market Analysis, Insights and Forecast, 2019-2031
- 8.1. Market Analysis, Insights and Forecast - by Distribution Channel
- 8.1.1. Supermarkets/Hypermarkets
- 8.1.2. Convenience Stores
- 8.1.3. Online Retail Channels
- 8.1.4. Other Distribution Channels
- 8.1. Market Analysis, Insights and Forecast - by Distribution Channel
- 9. Rest of the World Ethnic Food Market Analysis, Insights and Forecast, 2019-2031
- 9.1. Market Analysis, Insights and Forecast - by Distribution Channel
- 9.1.1. Supermarkets/Hypermarkets
- 9.1.2. Convenience Stores
- 9.1.3. Online Retail Channels
- 9.1.4. Other Distribution Channels
- 9.1. Market Analysis, Insights and Forecast - by Distribution Channel
- 10. North America Ethnic Food Market Analysis, Insights and Forecast, 2019-2031
- 10.1. Market Analysis, Insights and Forecast - By Country/Sub-region
- 10.1.1 United States
- 10.1.2 Canada
- 10.1.3 Mexico
- 11. Europe Ethnic Food Market Analysis, Insights and Forecast, 2019-2031
- 11.1. Market Analysis, Insights and Forecast - By Country/Sub-region
- 11.1.1 Germany
- 11.1.2 United Kingdom
- 11.1.3 France
- 11.1.4 Spain
- 11.1.5 Italy
- 11.1.6 Spain
- 11.1.7 Belgium
- 11.1.8 Netherland
- 11.1.9 Nordics
- 11.1.10 Rest of Europe
- 12. Asia Pacific Ethnic Food Market Analysis, Insights and Forecast, 2019-2031
- 12.1. Market Analysis, Insights and Forecast - By Country/Sub-region
- 12.1.1 China
- 12.1.2 Japan
- 12.1.3 India
- 12.1.4 South Korea
- 12.1.5 Southeast Asia
- 12.1.6 Australia
- 12.1.7 Indonesia
- 12.1.8 Phillipes
- 12.1.9 Singapore
- 12.1.10 Thailandc
- 12.1.11 Rest of Asia Pacific
- 13. South America Ethnic Food Market Analysis, Insights and Forecast, 2019-2031
- 13.1. Market Analysis, Insights and Forecast - By Country/Sub-region
- 13.1.1 Brazil
- 13.1.2 Argentina
- 13.1.3 Peru
- 13.1.4 Chile
- 13.1.5 Colombia
- 13.1.6 Ecuador
- 13.1.7 Venezuela
- 13.1.8 Rest of South America
- 14. MEA Ethnic Food Market Analysis, Insights and Forecast, 2019-2031
- 14.1. Market Analysis, Insights and Forecast - By Country/Sub-region
- 14.1.1 United Arab Emirates
- 14.1.2 Saudi Arabia
- 14.1.3 South Africa
- 14.1.4 Rest of Middle East and Africa
- 15. Competitive Analysis
- 15.1. Global Market Share Analysis 2024
- 15.2. Company Profiles
- 15.2.1 Capital Foods (Ching's Secret)
- 15.2.1.1. Overview
- 15.2.1.2. Products
- 15.2.1.3. SWOT Analysis
- 15.2.1.4. Recent Developments
- 15.2.1.5. Financials (Based on Availability)
- 15.2.2 Quality Ethnic Foods Inc
- 15.2.2.1. Overview
- 15.2.2.2. Products
- 15.2.2.3. SWOT Analysis
- 15.2.2.4. Recent Developments
- 15.2.2.5. Financials (Based on Availability)
- 15.2.3 ARYZTA AG
- 15.2.3.1. Overview
- 15.2.3.2. Products
- 15.2.3.3. SWOT Analysis
- 15.2.3.4. Recent Developments
- 15.2.3.5. Financials (Based on Availability)
- 15.2.4 McCormick & Company Inc
- 15.2.4.1. Overview
- 15.2.4.2. Products
- 15.2.4.3. SWOT Analysis
- 15.2.4.4. Recent Developments
- 15.2.4.5. Financials (Based on Availability)
- 15.2.5 Orkla ASA
- 15.2.5.1. Overview
- 15.2.5.2. Products
- 15.2.5.3. SWOT Analysis
- 15.2.5.4. Recent Developments
- 15.2.5.5. Financials (Based on Availability)
- 15.2.6 Ajinomoto Co Inc
- 15.2.6.1. Overview
- 15.2.6.2. Products
- 15.2.6.3. SWOT Analysis
- 15.2.6.4. Recent Developments
- 15.2.6.5. Financials (Based on Availability)
- 15.2.7 Charlie Bigham
- 15.2.7.1. Overview
- 15.2.7.2. Products
- 15.2.7.3. SWOT Analysis
- 15.2.7.4. Recent Developments
- 15.2.7.5. Financials (Based on Availability)
- 15.2.8 The Spice Tailor
- 15.2.8.1. Overview
- 15.2.8.2. Products
- 15.2.8.3. SWOT Analysis
- 15.2.8.4. Recent Developments
- 15.2.8.5. Financials (Based on Availability)
- 15.2.9 Paulig Ltd
- 15.2.9.1. Overview
- 15.2.9.2. Products
- 15.2.9.3. SWOT Analysis
- 15.2.9.4. Recent Developments
- 15.2.9.5. Financials (Based on Availability)
- 15.2.10 Associated British Foods PLC
- 15.2.10.1. Overview
- 15.2.10.2. Products
- 15.2.10.3. SWOT Analysis
- 15.2.10.4. Recent Developments
- 15.2.10.5. Financials (Based on Availability)
- 15.2.11 Asli Fine Foods
- 15.2.11.1. Overview
- 15.2.11.2. Products
- 15.2.11.3. SWOT Analysis
- 15.2.11.4. Recent Developments
- 15.2.11.5. Financials (Based on Availability)
- 15.2.12 General Mills Inc (Old El Paso)
- 15.2.12.1. Overview
- 15.2.12.2. Products
- 15.2.12.3. SWOT Analysis
- 15.2.12.4. Recent Developments
- 15.2.12.5. Financials (Based on Availability)
- 15.2.1 Capital Foods (Ching's Secret)
List of Figures
- Figure 1: Global Ethnic Food Market Revenue Breakdown (Million, %) by Region 2024 & 2032
- Figure 2: North America Ethnic Food Market Revenue (Million), by Country 2024 & 2032
- Figure 3: North America Ethnic Food Market Revenue Share (%), by Country 2024 & 2032
- Figure 4: Europe Ethnic Food Market Revenue (Million), by Country 2024 & 2032
- Figure 5: Europe Ethnic Food Market Revenue Share (%), by Country 2024 & 2032
- Figure 6: Asia Pacific Ethnic Food Market Revenue (Million), by Country 2024 & 2032
- Figure 7: Asia Pacific Ethnic Food Market Revenue Share (%), by Country 2024 & 2032
- Figure 8: South America Ethnic Food Market Revenue (Million), by Country 2024 & 2032
- Figure 9: South America Ethnic Food Market Revenue Share (%), by Country 2024 & 2032
- Figure 10: MEA Ethnic Food Market Revenue (Million), by Country 2024 & 2032
- Figure 11: MEA Ethnic Food Market Revenue Share (%), by Country 2024 & 2032
- Figure 12: North America Ethnic Food Market Revenue (Million), by Distribution Channel 2024 & 2032
- Figure 13: North America Ethnic Food Market Revenue Share (%), by Distribution Channel 2024 & 2032
- Figure 14: North America Ethnic Food Market Revenue (Million), by Country 2024 & 2032
- Figure 15: North America Ethnic Food Market Revenue Share (%), by Country 2024 & 2032
- Figure 16: Europe Ethnic Food Market Revenue (Million), by Distribution Channel 2024 & 2032
- Figure 17: Europe Ethnic Food Market Revenue Share (%), by Distribution Channel 2024 & 2032
- Figure 18: Europe Ethnic Food Market Revenue (Million), by Country 2024 & 2032
- Figure 19: Europe Ethnic Food Market Revenue Share (%), by Country 2024 & 2032
- Figure 20: Asia Pacific Ethnic Food Market Revenue (Million), by Distribution Channel 2024 & 2032
- Figure 21: Asia Pacific Ethnic Food Market Revenue Share (%), by Distribution Channel 2024 & 2032
- Figure 22: Asia Pacific Ethnic Food Market Revenue (Million), by Country 2024 & 2032
- Figure 23: Asia Pacific Ethnic Food Market Revenue Share (%), by Country 2024 & 2032
- Figure 24: Rest of the World Ethnic Food Market Revenue (Million), by Distribution Channel 2024 & 2032
- Figure 25: Rest of the World Ethnic Food Market Revenue Share (%), by Distribution Channel 2024 & 2032
- Figure 26: Rest of the World Ethnic Food Market Revenue (Million), by Country 2024 & 2032
- Figure 27: Rest of the World Ethnic Food Market Revenue Share (%), by Country 2024 & 2032
List of Tables
- Table 1: Global Ethnic Food Market Revenue Million Forecast, by Region 2019 & 2032
- Table 2: Global Ethnic Food Market Revenue Million Forecast, by Distribution Channel 2019 & 2032
- Table 3: Global Ethnic Food Market Revenue Million Forecast, by Region 2019 & 2032
- Table 4: Global Ethnic Food Market Revenue Million Forecast, by Country 2019 & 2032
- Table 5: United States Ethnic Food Market Revenue (Million) Forecast, by Application 2019 & 2032
- Table 6: Canada Ethnic Food Market Revenue (Million) Forecast, by Application 2019 & 2032
- Table 7: Mexico Ethnic Food Market Revenue (Million) Forecast, by Application 2019 & 2032
- Table 8: Global Ethnic Food Market Revenue Million Forecast, by Country 2019 & 2032
- Table 9: Germany Ethnic Food Market Revenue (Million) Forecast, by Application 2019 & 2032
- Table 10: United Kingdom Ethnic Food Market Revenue (Million) Forecast, by Application 2019 & 2032
- Table 11: France Ethnic Food Market Revenue (Million) Forecast, by Application 2019 & 2032
- Table 12: Spain Ethnic Food Market Revenue (Million) Forecast, by Application 2019 & 2032
- Table 13: Italy Ethnic Food Market Revenue (Million) Forecast, by Application 2019 & 2032
- Table 14: Spain Ethnic Food Market Revenue (Million) Forecast, by Application 2019 & 2032
- Table 15: Belgium Ethnic Food Market Revenue (Million) Forecast, by Application 2019 & 2032
- Table 16: Netherland Ethnic Food Market Revenue (Million) Forecast, by Application 2019 & 2032
- Table 17: Nordics Ethnic Food Market Revenue (Million) Forecast, by Application 2019 & 2032
- Table 18: Rest of Europe Ethnic Food Market Revenue (Million) Forecast, by Application 2019 & 2032
- Table 19: Global Ethnic Food Market Revenue Million Forecast, by Country 2019 & 2032
- Table 20: China Ethnic Food Market Revenue (Million) Forecast, by Application 2019 & 2032
- Table 21: Japan Ethnic Food Market Revenue (Million) Forecast, by Application 2019 & 2032
- Table 22: India Ethnic Food Market Revenue (Million) Forecast, by Application 2019 & 2032
- Table 23: South Korea Ethnic Food Market Revenue (Million) Forecast, by Application 2019 & 2032
- Table 24: Southeast Asia Ethnic Food Market Revenue (Million) Forecast, by Application 2019 & 2032
- Table 25: Australia Ethnic Food Market Revenue (Million) Forecast, by Application 2019 & 2032
- Table 26: Indonesia Ethnic Food Market Revenue (Million) Forecast, by Application 2019 & 2032
- Table 27: Phillipes Ethnic Food Market Revenue (Million) Forecast, by Application 2019 & 2032
- Table 28: Singapore Ethnic Food Market Revenue (Million) Forecast, by Application 2019 & 2032
- Table 29: Thailandc Ethnic Food Market Revenue (Million) Forecast, by Application 2019 & 2032
- Table 30: Rest of Asia Pacific Ethnic Food Market Revenue (Million) Forecast, by Application 2019 & 2032
- Table 31: Global Ethnic Food Market Revenue Million Forecast, by Country 2019 & 2032
- Table 32: Brazil Ethnic Food Market Revenue (Million) Forecast, by Application 2019 & 2032
- Table 33: Argentina Ethnic Food Market Revenue (Million) Forecast, by Application 2019 & 2032
- Table 34: Peru Ethnic Food Market Revenue (Million) Forecast, by Application 2019 & 2032
- Table 35: Chile Ethnic Food Market Revenue (Million) Forecast, by Application 2019 & 2032
- Table 36: Colombia Ethnic Food Market Revenue (Million) Forecast, by Application 2019 & 2032
- Table 37: Ecuador Ethnic Food Market Revenue (Million) Forecast, by Application 2019 & 2032
- Table 38: Venezuela Ethnic Food Market Revenue (Million) Forecast, by Application 2019 & 2032
- Table 39: Rest of South America Ethnic Food Market Revenue (Million) Forecast, by Application 2019 & 2032
- Table 40: Global Ethnic Food Market Revenue Million Forecast, by Country 2019 & 2032
- Table 41: United Arab Emirates Ethnic Food Market Revenue (Million) Forecast, by Application 2019 & 2032
- Table 42: Saudi Arabia Ethnic Food Market Revenue (Million) Forecast, by Application 2019 & 2032
- Table 43: South Africa Ethnic Food Market Revenue (Million) Forecast, by Application 2019 & 2032
- Table 44: Rest of Middle East and Africa Ethnic Food Market Revenue (Million) Forecast, by Application 2019 & 2032
- Table 45: Global Ethnic Food Market Revenue Million Forecast, by Distribution Channel 2019 & 2032
- Table 46: Global Ethnic Food Market Revenue Million Forecast, by Country 2019 & 2032
- Table 47: United States Ethnic Food Market Revenue (Million) Forecast, by Application 2019 & 2032
- Table 48: Canada Ethnic Food Market Revenue (Million) Forecast, by Application 2019 & 2032
- Table 49: Mexico Ethnic Food Market Revenue (Million) Forecast, by Application 2019 & 2032
- Table 50: Rest of North America Ethnic Food Market Revenue (Million) Forecast, by Application 2019 & 2032
- Table 51: Global Ethnic Food Market Revenue Million Forecast, by Distribution Channel 2019 & 2032
- Table 52: Global Ethnic Food Market Revenue Million Forecast, by Country 2019 & 2032
- Table 53: United Kingdom Ethnic Food Market Revenue (Million) Forecast, by Application 2019 & 2032
- Table 54: Germany Ethnic Food Market Revenue (Million) Forecast, by Application 2019 & 2032
- Table 55: Spain Ethnic Food Market Revenue (Million) Forecast, by Application 2019 & 2032
- Table 56: France Ethnic Food Market Revenue (Million) Forecast, by Application 2019 & 2032
- Table 57: Italy Ethnic Food Market Revenue (Million) Forecast, by Application 2019 & 2032
- Table 58: Russia Ethnic Food Market Revenue (Million) Forecast, by Application 2019 & 2032
- Table 59: Rest of Europe Ethnic Food Market Revenue (Million) Forecast, by Application 2019 & 2032
- Table 60: Global Ethnic Food Market Revenue Million Forecast, by Distribution Channel 2019 & 2032
- Table 61: Global Ethnic Food Market Revenue Million Forecast, by Country 2019 & 2032
- Table 62: China Ethnic Food Market Revenue (Million) Forecast, by Application 2019 & 2032
- Table 63: Japan Ethnic Food Market Revenue (Million) Forecast, by Application 2019 & 2032
- Table 64: India Ethnic Food Market Revenue (Million) Forecast, by Application 2019 & 2032
- Table 65: Australia Ethnic Food Market Revenue (Million) Forecast, by Application 2019 & 2032
- Table 66: Rest of Asia Pacific Ethnic Food Market Revenue (Million) Forecast, by Application 2019 & 2032
- Table 67: Global Ethnic Food Market Revenue Million Forecast, by Distribution Channel 2019 & 2032
- Table 68: Global Ethnic Food Market Revenue Million Forecast, by Country 2019 & 2032
- Table 69: South America Ethnic Food Market Revenue (Million) Forecast, by Application 2019 & 2032
- Table 70: Middle East Ethnic Food Market Revenue (Million) Forecast, by Application 2019 & 2032
Frequently Asked Questions
1. What is the projected Compound Annual Growth Rate (CAGR) of the Ethnic Food Market?
The projected CAGR is approximately 8.33%.
2. Which companies are prominent players in the Ethnic Food Market?
Key companies in the market include Capital Foods (Ching's Secret), Quality Ethnic Foods Inc, ARYZTA AG, McCormick & Company Inc, Orkla ASA, Ajinomoto Co Inc, Charlie Bigham, The Spice Tailor, Paulig Ltd, Associated British Foods PLC, Asli Fine Foods, General Mills Inc (Old El Paso).
3. What are the main segments of the Ethnic Food Market?
The market segments include Distribution Channel.
4. Can you provide details about the market size?
The market size is estimated to be USD 45.46 Million as of 2022.
5. What are some drivers contributing to market growth?
Consumer inclination toward functional food and beverages; Increasing Number of Applications and Growing Industrial Use.
6. What are the notable trends driving market growth?
Presence of Asian Cuisine in the US Ethnic Food Marketspace.
7. Are there any restraints impacting market growth?
Increasing Shift Toward Plant-Based Protein.
8. Can you provide examples of recent developments in the market?
February 2022: Patak launched its "Patak's Makes Perfect" TV advertisement in collaboration with a creative advertising agency, BMB. With this new advertisement, the company aimed to strengthen its market presence in the ethnic foods retail space.
9. What pricing options are available for accessing the report?
Pricing options include single-user, multi-user, and enterprise licenses priced at USD 4750, USD 5250, and USD 8750 respectively.
10. Is the market size provided in terms of value or volume?
The market size is provided in terms of value, measured in Million.
11. Are there any specific market keywords associated with the report?
Yes, the market keyword associated with the report is "Ethnic Food Market," which aids in identifying and referencing the specific market segment covered.
12. How do I determine which pricing option suits my needs best?
The pricing options vary based on user requirements and access needs. Individual users may opt for single-user licenses, while businesses requiring broader access may choose multi-user or enterprise licenses for cost-effective access to the report.
13. Are there any additional resources or data provided in the Ethnic Food Market report?
While the report offers comprehensive insights, it's advisable to review the specific contents or supplementary materials provided to ascertain if additional resources or data are available.
14. How can I stay updated on further developments or reports in the Ethnic Food Market?
To stay informed about further developments, trends, and reports in the Ethnic Food Market, consider subscribing to industry newsletters, following relevant companies and organizations, or regularly checking reputable industry news sources and publications.
Methodology
Step 1 - Identification of Relevant Samples Size from Population Database


Step 2 - Approaches for Defining Global Market Size (Value, Volume* & Price*)

Note*: In applicable scenarios
Step 3 - Data Sources
Primary Research
- Web Analytics
- Survey Reports
- Research Institute
- Latest Research Reports
- Opinion Leaders
Secondary Research
- Annual Reports
- White Paper
- Latest Press Release
- Industry Association
- Paid Database
- Investor Presentations

Step 4 - Data Triangulation
Involves using different sources of information in order to increase the validity of a study
These sources are likely to be stakeholders in a program - participants, other researchers, program staff, other community members, and so on.
Then we put all data in single framework & apply various statistical tools to find out the dynamic on the market.
During the analysis stage, feedback from the stakeholder groups would be compared to determine areas of agreement as well as areas of divergence


