
Key Insights
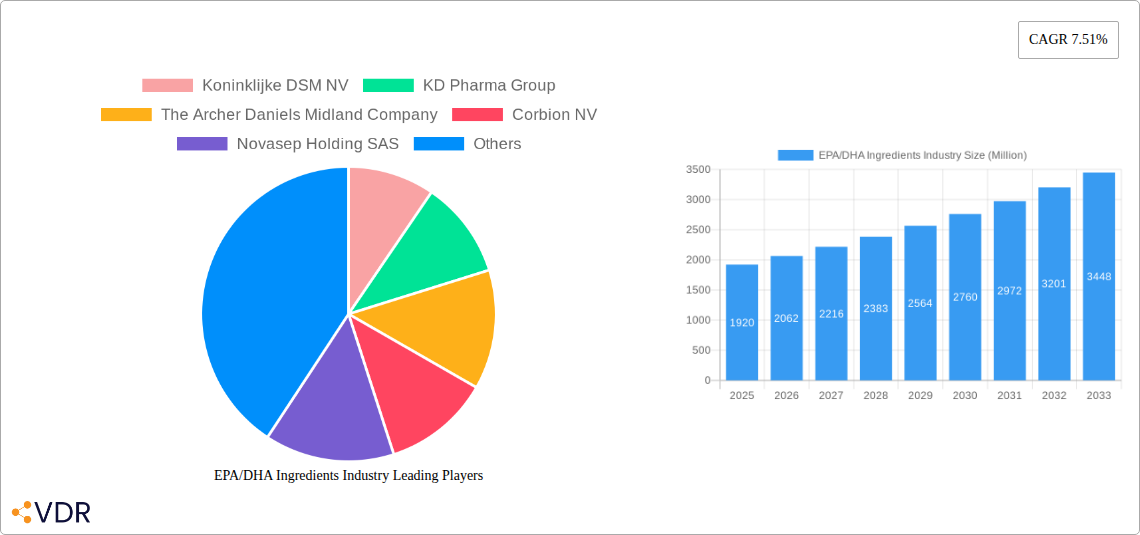
The EPA/DHA Ingredients market, valued at $1.92 billion in 2025, is projected to experience robust growth, driven by increasing consumer awareness of the health benefits associated with omega-3 fatty acids. The market's Compound Annual Growth Rate (CAGR) of 7.51% from 2025 to 2033 signifies a substantial expansion. This growth is fueled by several key factors, including the rising prevalence of chronic diseases like cardiovascular ailments and cognitive decline, where EPA and DHA play a crucial role in preventative and supportive care. The increasing integration of EPA/DHA into functional foods, dietary supplements, and pharmaceuticals further contributes to market expansion. Growing demand for sustainable and responsibly sourced omega-3 ingredients is also shaping market dynamics, leading to innovation in extraction and production methods. Major players like Koninklijke DSM NV, KD Pharma Group, and Archer Daniels Midland Company are actively investing in research and development, expanding their product portfolios, and focusing on strategic partnerships to capture market share.
The market segmentation, while not explicitly provided, can be reasonably inferred. We anticipate significant segments based on source (fish oil, algal oil, krill oil), application (dietary supplements, functional foods, pharmaceuticals), and geographical region. Regional variations in consumption patterns and regulatory landscapes will influence market growth within different areas. Challenges to the market include fluctuating raw material prices, sustainability concerns surrounding fish oil extraction, and the competitive landscape among numerous players. However, the long-term outlook remains positive, driven by the undeniable health benefits of EPA and DHA and the increasing consumer focus on preventative healthcare. The industry is likely to see increased consolidation and diversification of product offerings in the coming years.
EPA/DHA Ingredients Market Report: 2019-2033
This comprehensive report provides an in-depth analysis of the EPA/DHA ingredients market, encompassing market dynamics, growth trends, regional analysis, product landscape, challenges, opportunities, and key players. The study period covers 2019-2033, with a base year of 2025 and a forecast period of 2025-2033. The report utilizes data from the historical period of 2019-2024 and leverages proprietary research methodologies. This report is invaluable for industry professionals, investors, and stakeholders seeking to understand and capitalize on the growth potential within this dynamic market. The parent market is the omega-3 fatty acid market, while the child market is specifically focused on EPA and DHA ingredients.
EPA/DHA Ingredients Industry Market Dynamics & Structure
The EPA/DHA ingredients market exhibits a moderately consolidated structure, with key players holding significant market share. Technological innovation, particularly in extraction and purification methods, is a major driver. Stringent regulatory frameworks, particularly concerning purity and labeling, influence market dynamics. Competitive substitutes, such as plant-based omega-3 sources, are gaining traction, although EPA and DHA remain dominant due to their established health benefits. The end-user demographics are expanding beyond traditional health-conscious consumers to include broader health and wellness-focused markets. M&A activity is moderate, with strategic partnerships and acquisitions shaping market consolidation.
- Market Concentration: Highly concentrated; Top 5 players hold approximately xx% of market share (2024).
- Technological Innovation: Focus on sustainable sourcing, improved extraction techniques, and enhanced bioavailability.
- Regulatory Framework: Stringent regulations regarding purity, labeling, and safety standards.
- Competitive Substitutes: Plant-based alternatives and other omega-3 sources pose a competitive threat, representing xx Million units in 2024.
- End-User Demographics: Expansion into mainstream markets, driven by increasing awareness of heart and brain health benefits.
- M&A Trends: Moderate level of activity, focusing on strengthening supply chains and expanding product portfolios; approximately xx M&A deals in the past 5 years.
EPA/DHA Ingredients Industry Growth Trends & Insights
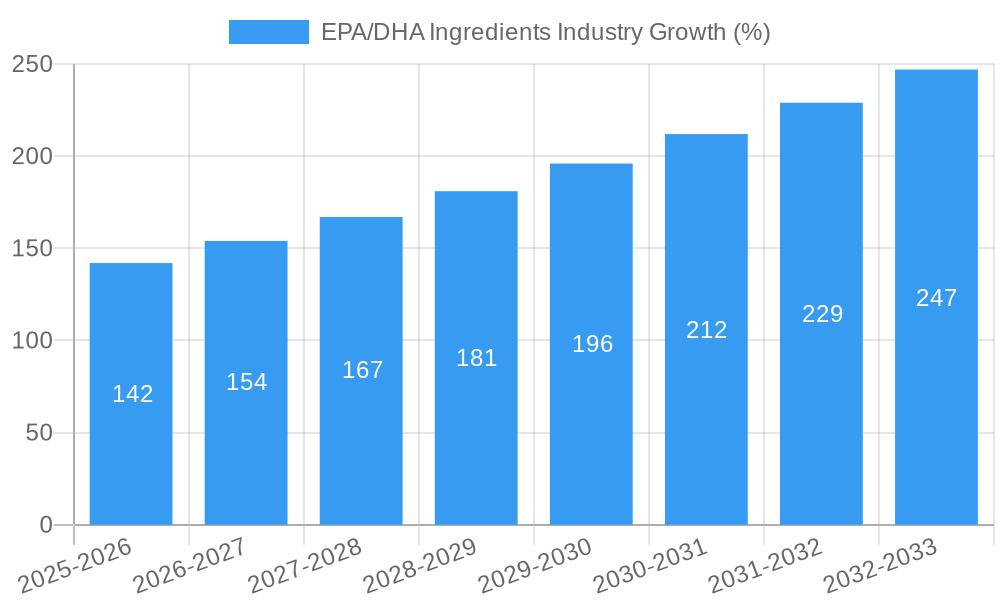
The EPA/DHA ingredients market has witnessed robust growth in recent years, driven by increasing consumer awareness of the health benefits associated with EPA and DHA. The market size, estimated at xx Million units in 2024, is projected to reach xx Million units by 2033, exhibiting a CAGR of xx% during the forecast period. This growth is attributed to rising demand for functional foods, dietary supplements, and pharmaceutical applications. Technological advancements, including improved extraction methods and innovative delivery systems, further fuel market expansion. Consumer behavior shifts towards healthier lifestyles and preventative healthcare are creating significant opportunities. Increased market penetration in emerging economies is also contributing to the growth trajectory.
Dominant Regions, Countries, or Segments in EPA/DHA Ingredients Industry
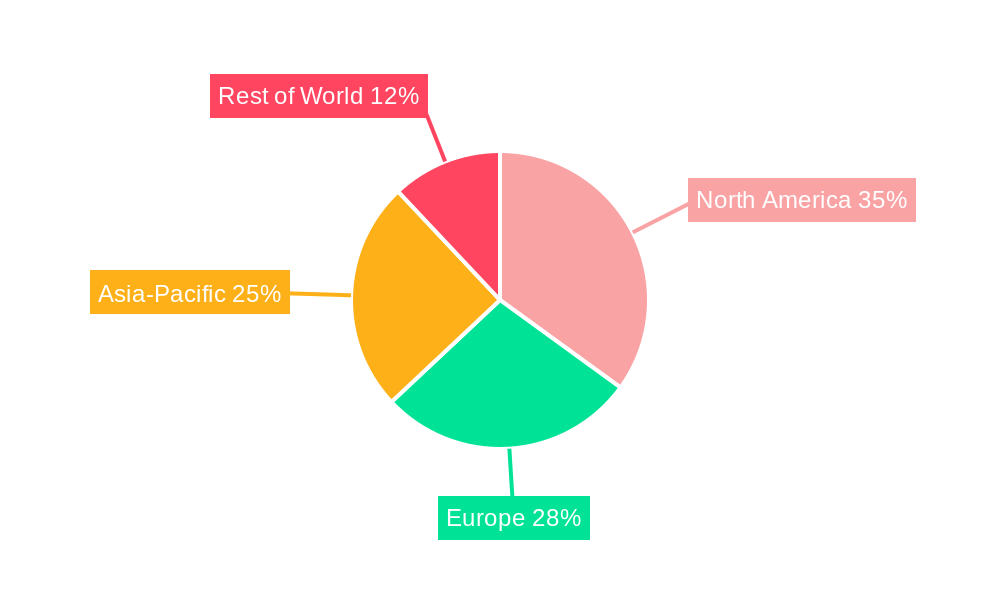
North America and Europe currently dominate the EPA/DHA ingredients market, accounting for approximately xx% of the global market share in 2024. Strong consumer awareness of health benefits, coupled with established regulatory frameworks and robust healthcare infrastructure, drives this dominance. The Asia-Pacific region, however, is projected to experience the fastest growth during the forecast period, driven by rising disposable incomes, increasing health consciousness, and expanding distribution networks.
- North America: High consumer awareness, established regulations, and strong healthcare infrastructure.
- Europe: Significant demand for functional foods and supplements; mature market with high per capita consumption.
- Asia-Pacific: Fastest-growing region, driven by increasing disposable incomes and health consciousness.
- Other regions: Latin America and Africa present emerging opportunities, but market penetration is still limited.
EPA/DHA Ingredients Industry Product Landscape
The EPA/DHA ingredients market offers a diverse range of products, including concentrated oils, powders, and encapsulated forms. Innovations focus on enhancing bioavailability, improving stability, and developing novel delivery systems. Unique selling propositions often highlight purity, sustainability, and traceability. Technological advancements, such as microencapsulation and liposomal delivery, enhance the efficacy and absorption of EPA and DHA.
Key Drivers, Barriers & Challenges in EPA/DHA Ingredients Industry
Key Drivers:
- Growing consumer demand for functional foods and supplements.
- Increasing awareness of the health benefits of EPA and DHA.
- Technological advancements in extraction and purification.
- Rising prevalence of chronic diseases.
Key Challenges:
- Fluctuations in raw material supply, particularly from sustainable sources.
- Stringent regulatory requirements impacting cost and time to market.
- Price competition from substitutes and other omega-3 sources.
- Supply chain disruptions due to geopolitical factors. (Estimated impact on market growth: xx% in 2024)
Emerging Opportunities in EPA/DHA Ingredients Industry
- Expansion into untapped markets in developing countries.
- Development of innovative applications in infant nutrition and animal feed.
- Growing demand for personalized nutrition solutions.
- Increasing focus on sustainable and traceable sourcing.
Growth Accelerators in the EPA/DHA Ingredients Industry
Technological breakthroughs in extraction and purification, strategic partnerships aimed at enhancing supply chains and market reach, and expansion into new geographic markets are key growth accelerators in the EPA/DHA ingredients industry. These factors are expected to drive market expansion and unlock new revenue streams in the coming years.
Key Players Shaping the EPA/DHA Ingredients Market
- Koninklijke DSM NV
- KD Pharma Group
- The Archer Daniels Midland Company
- Corbion NV
- Novasep Holding SAS
- Neptune Wellness Solutions
- BASF SE
- Omega Protein Corporation
- Croda International PLC
- Novotech Nutraceuticals
- List Not Exhaustive
Notable Milestones in EPA/DHA Ingredients Industry Sector
- March 2024: DSM-Firmenich partnered with SCN BestCo to launch omega-3 gummies with EPA and DHA ingredients.
- March 2024: Epax invested USD 40 million in a state-of-the-art distillation facility for ultra-concentrated omega-3 production.
- February 2024: Epax launched EPAX Omega 3-9-11, a full-spectrum oil with potential for skin health supplements.
In-Depth EPA/DHA Ingredients Industry Market Outlook
The EPA/DHA ingredients market is poised for sustained growth, driven by factors including increasing consumer health consciousness, technological advancements, and the growing acceptance of omega-3 fatty acids as essential nutrients. Strategic investments in research and development, coupled with innovative product development, are expected to further fuel market expansion. The focus on sustainable sourcing and traceability will also play a crucial role in shaping the future of the industry.
EPA/DHA Ingredients Industry Segmentation
-
1. Type
- 1.1. Eicosapentaenoic Acid (EPA)
- 1.2. Docosahexaenoic Acid (DHA)
-
2. Source
- 2.1. Fish Oil
- 2.2. Algae Oil
- 2.3. Krill Oil
- 2.4. Other Sources
-
3. Application
- 3.1. Infant Formulae
- 3.2. Dietary Supplements
- 3.3. Fortified Food and Beverages
- 3.4. Pharmaceuticals
- 3.5. Other Applications
EPA/DHA Ingredients Industry Segmentation By Geography
-
1. North America
- 1.1. United States
- 1.2. Mexico
- 1.3. Canada
- 1.4. Rest of North America
-
2. Europe
- 2.1. Spain
- 2.2. United Kingdom
- 2.3. Germany
- 2.4. France
- 2.5. Russia
- 2.6. Italy
- 2.7. Rest of Europe
-
3. Asia Pacific
- 3.1. China
- 3.2. Japan
- 3.3. India
- 3.4. Australia
- 3.5. Rest of Asia Pacific
-
4. South America
- 4.1. Brazil
- 4.2. Argentina
- 4.3. Rest of South America
-
5. Middle East and Africa
- 5.1. United Arab Emirates
- 5.2. South Africa
- 5.3. Rest of Middle East and Africa
EPA/DHA Ingredients Industry REPORT HIGHLIGHTS
| Aspects | Details |
|---|---|
| Study Period | 2019-2033 |
| Base Year | 2024 |
| Estimated Year | 2025 |
| Forecast Period | 2025-2033 |
| Historical Period | 2019-2024 |
| Growth Rate | CAGR of 7.51% from 2019-2033 |
| Segmentation |
|
Table of Contents
- 1. Introduction
- 1.1. Research Scope
- 1.2. Market Segmentation
- 1.3. Research Methodology
- 1.4. Definitions and Assumptions
- 2. Executive Summary
- 2.1. Introduction
- 3. Market Dynamics
- 3.1. Introduction
- 3.2. Market Drivers
- 3.2.1. Increasing Awareness Of Health Benefits Associated With EPA And DHA; Demand for Concentrated Forms of Omega 3
- 3.3. Market Restrains
- 3.3.1. Increasing Awareness Of Health Benefits Associated With EPA And DHA; Demand for Concentrated Forms of Omega 3
- 3.4. Market Trends
- 3.4.1. Increasing Awareness Of Health Benefits Associated With EPA And DHA
- 4. Market Factor Analysis
- 4.1. Porters Five Forces
- 4.2. Supply/Value Chain
- 4.3. PESTEL analysis
- 4.4. Market Entropy
- 4.5. Patent/Trademark Analysis
- 5. Global EPA/DHA Ingredients Industry Analysis, Insights and Forecast, 2019-2031
- 5.1. Market Analysis, Insights and Forecast - by Type
- 5.1.1. Eicosapentaenoic Acid (EPA)
- 5.1.2. Docosahexaenoic Acid (DHA)
- 5.2. Market Analysis, Insights and Forecast - by Source
- 5.2.1. Fish Oil
- 5.2.2. Algae Oil
- 5.2.3. Krill Oil
- 5.2.4. Other Sources
- 5.3. Market Analysis, Insights and Forecast - by Application
- 5.3.1. Infant Formulae
- 5.3.2. Dietary Supplements
- 5.3.3. Fortified Food and Beverages
- 5.3.4. Pharmaceuticals
- 5.3.5. Other Applications
- 5.4. Market Analysis, Insights and Forecast - by Region
- 5.4.1. North America
- 5.4.2. Europe
- 5.4.3. Asia Pacific
- 5.4.4. South America
- 5.4.5. Middle East and Africa
- 5.1. Market Analysis, Insights and Forecast - by Type
- 6. North America EPA/DHA Ingredients Industry Analysis, Insights and Forecast, 2019-2031
- 6.1. Market Analysis, Insights and Forecast - by Type
- 6.1.1. Eicosapentaenoic Acid (EPA)
- 6.1.2. Docosahexaenoic Acid (DHA)
- 6.2. Market Analysis, Insights and Forecast - by Source
- 6.2.1. Fish Oil
- 6.2.2. Algae Oil
- 6.2.3. Krill Oil
- 6.2.4. Other Sources
- 6.3. Market Analysis, Insights and Forecast - by Application
- 6.3.1. Infant Formulae
- 6.3.2. Dietary Supplements
- 6.3.3. Fortified Food and Beverages
- 6.3.4. Pharmaceuticals
- 6.3.5. Other Applications
- 6.1. Market Analysis, Insights and Forecast - by Type
- 7. Europe EPA/DHA Ingredients Industry Analysis, Insights and Forecast, 2019-2031
- 7.1. Market Analysis, Insights and Forecast - by Type
- 7.1.1. Eicosapentaenoic Acid (EPA)
- 7.1.2. Docosahexaenoic Acid (DHA)
- 7.2. Market Analysis, Insights and Forecast - by Source
- 7.2.1. Fish Oil
- 7.2.2. Algae Oil
- 7.2.3. Krill Oil
- 7.2.4. Other Sources
- 7.3. Market Analysis, Insights and Forecast - by Application
- 7.3.1. Infant Formulae
- 7.3.2. Dietary Supplements
- 7.3.3. Fortified Food and Beverages
- 7.3.4. Pharmaceuticals
- 7.3.5. Other Applications
- 7.1. Market Analysis, Insights and Forecast - by Type
- 8. Asia Pacific EPA/DHA Ingredients Industry Analysis, Insights and Forecast, 2019-2031
- 8.1. Market Analysis, Insights and Forecast - by Type
- 8.1.1. Eicosapentaenoic Acid (EPA)
- 8.1.2. Docosahexaenoic Acid (DHA)
- 8.2. Market Analysis, Insights and Forecast - by Source
- 8.2.1. Fish Oil
- 8.2.2. Algae Oil
- 8.2.3. Krill Oil
- 8.2.4. Other Sources
- 8.3. Market Analysis, Insights and Forecast - by Application
- 8.3.1. Infant Formulae
- 8.3.2. Dietary Supplements
- 8.3.3. Fortified Food and Beverages
- 8.3.4. Pharmaceuticals
- 8.3.5. Other Applications
- 8.1. Market Analysis, Insights and Forecast - by Type
- 9. South America EPA/DHA Ingredients Industry Analysis, Insights and Forecast, 2019-2031
- 9.1. Market Analysis, Insights and Forecast - by Type
- 9.1.1. Eicosapentaenoic Acid (EPA)
- 9.1.2. Docosahexaenoic Acid (DHA)
- 9.2. Market Analysis, Insights and Forecast - by Source
- 9.2.1. Fish Oil
- 9.2.2. Algae Oil
- 9.2.3. Krill Oil
- 9.2.4. Other Sources
- 9.3. Market Analysis, Insights and Forecast - by Application
- 9.3.1. Infant Formulae
- 9.3.2. Dietary Supplements
- 9.3.3. Fortified Food and Beverages
- 9.3.4. Pharmaceuticals
- 9.3.5. Other Applications
- 9.1. Market Analysis, Insights and Forecast - by Type
- 10. Middle East and Africa EPA/DHA Ingredients Industry Analysis, Insights and Forecast, 2019-2031
- 10.1. Market Analysis, Insights and Forecast - by Type
- 10.1.1. Eicosapentaenoic Acid (EPA)
- 10.1.2. Docosahexaenoic Acid (DHA)
- 10.2. Market Analysis, Insights and Forecast - by Source
- 10.2.1. Fish Oil
- 10.2.2. Algae Oil
- 10.2.3. Krill Oil
- 10.2.4. Other Sources
- 10.3. Market Analysis, Insights and Forecast - by Application
- 10.3.1. Infant Formulae
- 10.3.2. Dietary Supplements
- 10.3.3. Fortified Food and Beverages
- 10.3.4. Pharmaceuticals
- 10.3.5. Other Applications
- 10.1. Market Analysis, Insights and Forecast - by Type
- 11. Competitive Analysis
- 11.1. Global Market Share Analysis 2024
- 11.2. Company Profiles
- 11.2.1 Koninklijke DSM NV
- 11.2.1.1. Overview
- 11.2.1.2. Products
- 11.2.1.3. SWOT Analysis
- 11.2.1.4. Recent Developments
- 11.2.1.5. Financials (Based on Availability)
- 11.2.2 KD Pharma Group
- 11.2.2.1. Overview
- 11.2.2.2. Products
- 11.2.2.3. SWOT Analysis
- 11.2.2.4. Recent Developments
- 11.2.2.5. Financials (Based on Availability)
- 11.2.3 The Archer Daniels Midland Company
- 11.2.3.1. Overview
- 11.2.3.2. Products
- 11.2.3.3. SWOT Analysis
- 11.2.3.4. Recent Developments
- 11.2.3.5. Financials (Based on Availability)
- 11.2.4 Corbion NV
- 11.2.4.1. Overview
- 11.2.4.2. Products
- 11.2.4.3. SWOT Analysis
- 11.2.4.4. Recent Developments
- 11.2.4.5. Financials (Based on Availability)
- 11.2.5 Novasep Holding SAS
- 11.2.5.1. Overview
- 11.2.5.2. Products
- 11.2.5.3. SWOT Analysis
- 11.2.5.4. Recent Developments
- 11.2.5.5. Financials (Based on Availability)
- 11.2.6 Neptune Wellness Solutions
- 11.2.6.1. Overview
- 11.2.6.2. Products
- 11.2.6.3. SWOT Analysis
- 11.2.6.4. Recent Developments
- 11.2.6.5. Financials (Based on Availability)
- 11.2.7 BASF SE
- 11.2.7.1. Overview
- 11.2.7.2. Products
- 11.2.7.3. SWOT Analysis
- 11.2.7.4. Recent Developments
- 11.2.7.5. Financials (Based on Availability)
- 11.2.8 Omega Protein Corporation
- 11.2.8.1. Overview
- 11.2.8.2. Products
- 11.2.8.3. SWOT Analysis
- 11.2.8.4. Recent Developments
- 11.2.8.5. Financials (Based on Availability)
- 11.2.9 Croda International PLC
- 11.2.9.1. Overview
- 11.2.9.2. Products
- 11.2.9.3. SWOT Analysis
- 11.2.9.4. Recent Developments
- 11.2.9.5. Financials (Based on Availability)
- 11.2.10 Novotech Nutraceuticals*List Not Exhaustive
- 11.2.10.1. Overview
- 11.2.10.2. Products
- 11.2.10.3. SWOT Analysis
- 11.2.10.4. Recent Developments
- 11.2.10.5. Financials (Based on Availability)
- 11.2.1 Koninklijke DSM NV
List of Figures
- Figure 1: Global EPA/DHA Ingredients Industry Revenue Breakdown (Million, %) by Region 2024 & 2032
- Figure 2: Global EPA/DHA Ingredients Industry Volume Breakdown (Billion, %) by Region 2024 & 2032
- Figure 3: North America EPA/DHA Ingredients Industry Revenue (Million), by Type 2024 & 2032
- Figure 4: North America EPA/DHA Ingredients Industry Volume (Billion), by Type 2024 & 2032
- Figure 5: North America EPA/DHA Ingredients Industry Revenue Share (%), by Type 2024 & 2032
- Figure 6: North America EPA/DHA Ingredients Industry Volume Share (%), by Type 2024 & 2032
- Figure 7: North America EPA/DHA Ingredients Industry Revenue (Million), by Source 2024 & 2032
- Figure 8: North America EPA/DHA Ingredients Industry Volume (Billion), by Source 2024 & 2032
- Figure 9: North America EPA/DHA Ingredients Industry Revenue Share (%), by Source 2024 & 2032
- Figure 10: North America EPA/DHA Ingredients Industry Volume Share (%), by Source 2024 & 2032
- Figure 11: North America EPA/DHA Ingredients Industry Revenue (Million), by Application 2024 & 2032
- Figure 12: North America EPA/DHA Ingredients Industry Volume (Billion), by Application 2024 & 2032
- Figure 13: North America EPA/DHA Ingredients Industry Revenue Share (%), by Application 2024 & 2032
- Figure 14: North America EPA/DHA Ingredients Industry Volume Share (%), by Application 2024 & 2032
- Figure 15: North America EPA/DHA Ingredients Industry Revenue (Million), by Country 2024 & 2032
- Figure 16: North America EPA/DHA Ingredients Industry Volume (Billion), by Country 2024 & 2032
- Figure 17: North America EPA/DHA Ingredients Industry Revenue Share (%), by Country 2024 & 2032
- Figure 18: North America EPA/DHA Ingredients Industry Volume Share (%), by Country 2024 & 2032
- Figure 19: Europe EPA/DHA Ingredients Industry Revenue (Million), by Type 2024 & 2032
- Figure 20: Europe EPA/DHA Ingredients Industry Volume (Billion), by Type 2024 & 2032
- Figure 21: Europe EPA/DHA Ingredients Industry Revenue Share (%), by Type 2024 & 2032
- Figure 22: Europe EPA/DHA Ingredients Industry Volume Share (%), by Type 2024 & 2032
- Figure 23: Europe EPA/DHA Ingredients Industry Revenue (Million), by Source 2024 & 2032
- Figure 24: Europe EPA/DHA Ingredients Industry Volume (Billion), by Source 2024 & 2032
- Figure 25: Europe EPA/DHA Ingredients Industry Revenue Share (%), by Source 2024 & 2032
- Figure 26: Europe EPA/DHA Ingredients Industry Volume Share (%), by Source 2024 & 2032
- Figure 27: Europe EPA/DHA Ingredients Industry Revenue (Million), by Application 2024 & 2032
- Figure 28: Europe EPA/DHA Ingredients Industry Volume (Billion), by Application 2024 & 2032
- Figure 29: Europe EPA/DHA Ingredients Industry Revenue Share (%), by Application 2024 & 2032
- Figure 30: Europe EPA/DHA Ingredients Industry Volume Share (%), by Application 2024 & 2032
- Figure 31: Europe EPA/DHA Ingredients Industry Revenue (Million), by Country 2024 & 2032
- Figure 32: Europe EPA/DHA Ingredients Industry Volume (Billion), by Country 2024 & 2032
- Figure 33: Europe EPA/DHA Ingredients Industry Revenue Share (%), by Country 2024 & 2032
- Figure 34: Europe EPA/DHA Ingredients Industry Volume Share (%), by Country 2024 & 2032
- Figure 35: Asia Pacific EPA/DHA Ingredients Industry Revenue (Million), by Type 2024 & 2032
- Figure 36: Asia Pacific EPA/DHA Ingredients Industry Volume (Billion), by Type 2024 & 2032
- Figure 37: Asia Pacific EPA/DHA Ingredients Industry Revenue Share (%), by Type 2024 & 2032
- Figure 38: Asia Pacific EPA/DHA Ingredients Industry Volume Share (%), by Type 2024 & 2032
- Figure 39: Asia Pacific EPA/DHA Ingredients Industry Revenue (Million), by Source 2024 & 2032
- Figure 40: Asia Pacific EPA/DHA Ingredients Industry Volume (Billion), by Source 2024 & 2032
- Figure 41: Asia Pacific EPA/DHA Ingredients Industry Revenue Share (%), by Source 2024 & 2032
- Figure 42: Asia Pacific EPA/DHA Ingredients Industry Volume Share (%), by Source 2024 & 2032
- Figure 43: Asia Pacific EPA/DHA Ingredients Industry Revenue (Million), by Application 2024 & 2032
- Figure 44: Asia Pacific EPA/DHA Ingredients Industry Volume (Billion), by Application 2024 & 2032
- Figure 45: Asia Pacific EPA/DHA Ingredients Industry Revenue Share (%), by Application 2024 & 2032
- Figure 46: Asia Pacific EPA/DHA Ingredients Industry Volume Share (%), by Application 2024 & 2032
- Figure 47: Asia Pacific EPA/DHA Ingredients Industry Revenue (Million), by Country 2024 & 2032
- Figure 48: Asia Pacific EPA/DHA Ingredients Industry Volume (Billion), by Country 2024 & 2032
- Figure 49: Asia Pacific EPA/DHA Ingredients Industry Revenue Share (%), by Country 2024 & 2032
- Figure 50: Asia Pacific EPA/DHA Ingredients Industry Volume Share (%), by Country 2024 & 2032
- Figure 51: South America EPA/DHA Ingredients Industry Revenue (Million), by Type 2024 & 2032
- Figure 52: South America EPA/DHA Ingredients Industry Volume (Billion), by Type 2024 & 2032
- Figure 53: South America EPA/DHA Ingredients Industry Revenue Share (%), by Type 2024 & 2032
- Figure 54: South America EPA/DHA Ingredients Industry Volume Share (%), by Type 2024 & 2032
- Figure 55: South America EPA/DHA Ingredients Industry Revenue (Million), by Source 2024 & 2032
- Figure 56: South America EPA/DHA Ingredients Industry Volume (Billion), by Source 2024 & 2032
- Figure 57: South America EPA/DHA Ingredients Industry Revenue Share (%), by Source 2024 & 2032
- Figure 58: South America EPA/DHA Ingredients Industry Volume Share (%), by Source 2024 & 2032
- Figure 59: South America EPA/DHA Ingredients Industry Revenue (Million), by Application 2024 & 2032
- Figure 60: South America EPA/DHA Ingredients Industry Volume (Billion), by Application 2024 & 2032
- Figure 61: South America EPA/DHA Ingredients Industry Revenue Share (%), by Application 2024 & 2032
- Figure 62: South America EPA/DHA Ingredients Industry Volume Share (%), by Application 2024 & 2032
- Figure 63: South America EPA/DHA Ingredients Industry Revenue (Million), by Country 2024 & 2032
- Figure 64: South America EPA/DHA Ingredients Industry Volume (Billion), by Country 2024 & 2032
- Figure 65: South America EPA/DHA Ingredients Industry Revenue Share (%), by Country 2024 & 2032
- Figure 66: South America EPA/DHA Ingredients Industry Volume Share (%), by Country 2024 & 2032
- Figure 67: Middle East and Africa EPA/DHA Ingredients Industry Revenue (Million), by Type 2024 & 2032
- Figure 68: Middle East and Africa EPA/DHA Ingredients Industry Volume (Billion), by Type 2024 & 2032
- Figure 69: Middle East and Africa EPA/DHA Ingredients Industry Revenue Share (%), by Type 2024 & 2032
- Figure 70: Middle East and Africa EPA/DHA Ingredients Industry Volume Share (%), by Type 2024 & 2032
- Figure 71: Middle East and Africa EPA/DHA Ingredients Industry Revenue (Million), by Source 2024 & 2032
- Figure 72: Middle East and Africa EPA/DHA Ingredients Industry Volume (Billion), by Source 2024 & 2032
- Figure 73: Middle East and Africa EPA/DHA Ingredients Industry Revenue Share (%), by Source 2024 & 2032
- Figure 74: Middle East and Africa EPA/DHA Ingredients Industry Volume Share (%), by Source 2024 & 2032
- Figure 75: Middle East and Africa EPA/DHA Ingredients Industry Revenue (Million), by Application 2024 & 2032
- Figure 76: Middle East and Africa EPA/DHA Ingredients Industry Volume (Billion), by Application 2024 & 2032
- Figure 77: Middle East and Africa EPA/DHA Ingredients Industry Revenue Share (%), by Application 2024 & 2032
- Figure 78: Middle East and Africa EPA/DHA Ingredients Industry Volume Share (%), by Application 2024 & 2032
- Figure 79: Middle East and Africa EPA/DHA Ingredients Industry Revenue (Million), by Country 2024 & 2032
- Figure 80: Middle East and Africa EPA/DHA Ingredients Industry Volume (Billion), by Country 2024 & 2032
- Figure 81: Middle East and Africa EPA/DHA Ingredients Industry Revenue Share (%), by Country 2024 & 2032
- Figure 82: Middle East and Africa EPA/DHA Ingredients Industry Volume Share (%), by Country 2024 & 2032
List of Tables
- Table 1: Global EPA/DHA Ingredients Industry Revenue Million Forecast, by Region 2019 & 2032
- Table 2: Global EPA/DHA Ingredients Industry Volume Billion Forecast, by Region 2019 & 2032
- Table 3: Global EPA/DHA Ingredients Industry Revenue Million Forecast, by Type 2019 & 2032
- Table 4: Global EPA/DHA Ingredients Industry Volume Billion Forecast, by Type 2019 & 2032
- Table 5: Global EPA/DHA Ingredients Industry Revenue Million Forecast, by Source 2019 & 2032
- Table 6: Global EPA/DHA Ingredients Industry Volume Billion Forecast, by Source 2019 & 2032
- Table 7: Global EPA/DHA Ingredients Industry Revenue Million Forecast, by Application 2019 & 2032
- Table 8: Global EPA/DHA Ingredients Industry Volume Billion Forecast, by Application 2019 & 2032
- Table 9: Global EPA/DHA Ingredients Industry Revenue Million Forecast, by Region 2019 & 2032
- Table 10: Global EPA/DHA Ingredients Industry Volume Billion Forecast, by Region 2019 & 2032
- Table 11: Global EPA/DHA Ingredients Industry Revenue Million Forecast, by Type 2019 & 2032
- Table 12: Global EPA/DHA Ingredients Industry Volume Billion Forecast, by Type 2019 & 2032
- Table 13: Global EPA/DHA Ingredients Industry Revenue Million Forecast, by Source 2019 & 2032
- Table 14: Global EPA/DHA Ingredients Industry Volume Billion Forecast, by Source 2019 & 2032
- Table 15: Global EPA/DHA Ingredients Industry Revenue Million Forecast, by Application 2019 & 2032
- Table 16: Global EPA/DHA Ingredients Industry Volume Billion Forecast, by Application 2019 & 2032
- Table 17: Global EPA/DHA Ingredients Industry Revenue Million Forecast, by Country 2019 & 2032
- Table 18: Global EPA/DHA Ingredients Industry Volume Billion Forecast, by Country 2019 & 2032
- Table 19: United States EPA/DHA Ingredients Industry Revenue (Million) Forecast, by Application 2019 & 2032
- Table 20: United States EPA/DHA Ingredients Industry Volume (Billion) Forecast, by Application 2019 & 2032
- Table 21: Mexico EPA/DHA Ingredients Industry Revenue (Million) Forecast, by Application 2019 & 2032
- Table 22: Mexico EPA/DHA Ingredients Industry Volume (Billion) Forecast, by Application 2019 & 2032
- Table 23: Canada EPA/DHA Ingredients Industry Revenue (Million) Forecast, by Application 2019 & 2032
- Table 24: Canada EPA/DHA Ingredients Industry Volume (Billion) Forecast, by Application 2019 & 2032
- Table 25: Rest of North America EPA/DHA Ingredients Industry Revenue (Million) Forecast, by Application 2019 & 2032
- Table 26: Rest of North America EPA/DHA Ingredients Industry Volume (Billion) Forecast, by Application 2019 & 2032
- Table 27: Global EPA/DHA Ingredients Industry Revenue Million Forecast, by Type 2019 & 2032
- Table 28: Global EPA/DHA Ingredients Industry Volume Billion Forecast, by Type 2019 & 2032
- Table 29: Global EPA/DHA Ingredients Industry Revenue Million Forecast, by Source 2019 & 2032
- Table 30: Global EPA/DHA Ingredients Industry Volume Billion Forecast, by Source 2019 & 2032
- Table 31: Global EPA/DHA Ingredients Industry Revenue Million Forecast, by Application 2019 & 2032
- Table 32: Global EPA/DHA Ingredients Industry Volume Billion Forecast, by Application 2019 & 2032
- Table 33: Global EPA/DHA Ingredients Industry Revenue Million Forecast, by Country 2019 & 2032
- Table 34: Global EPA/DHA Ingredients Industry Volume Billion Forecast, by Country 2019 & 2032
- Table 35: Spain EPA/DHA Ingredients Industry Revenue (Million) Forecast, by Application 2019 & 2032
- Table 36: Spain EPA/DHA Ingredients Industry Volume (Billion) Forecast, by Application 2019 & 2032
- Table 37: United Kingdom EPA/DHA Ingredients Industry Revenue (Million) Forecast, by Application 2019 & 2032
- Table 38: United Kingdom EPA/DHA Ingredients Industry Volume (Billion) Forecast, by Application 2019 & 2032
- Table 39: Germany EPA/DHA Ingredients Industry Revenue (Million) Forecast, by Application 2019 & 2032
- Table 40: Germany EPA/DHA Ingredients Industry Volume (Billion) Forecast, by Application 2019 & 2032
- Table 41: France EPA/DHA Ingredients Industry Revenue (Million) Forecast, by Application 2019 & 2032
- Table 42: France EPA/DHA Ingredients Industry Volume (Billion) Forecast, by Application 2019 & 2032
- Table 43: Russia EPA/DHA Ingredients Industry Revenue (Million) Forecast, by Application 2019 & 2032
- Table 44: Russia EPA/DHA Ingredients Industry Volume (Billion) Forecast, by Application 2019 & 2032
- Table 45: Italy EPA/DHA Ingredients Industry Revenue (Million) Forecast, by Application 2019 & 2032
- Table 46: Italy EPA/DHA Ingredients Industry Volume (Billion) Forecast, by Application 2019 & 2032
- Table 47: Rest of Europe EPA/DHA Ingredients Industry Revenue (Million) Forecast, by Application 2019 & 2032
- Table 48: Rest of Europe EPA/DHA Ingredients Industry Volume (Billion) Forecast, by Application 2019 & 2032
- Table 49: Global EPA/DHA Ingredients Industry Revenue Million Forecast, by Type 2019 & 2032
- Table 50: Global EPA/DHA Ingredients Industry Volume Billion Forecast, by Type 2019 & 2032
- Table 51: Global EPA/DHA Ingredients Industry Revenue Million Forecast, by Source 2019 & 2032
- Table 52: Global EPA/DHA Ingredients Industry Volume Billion Forecast, by Source 2019 & 2032
- Table 53: Global EPA/DHA Ingredients Industry Revenue Million Forecast, by Application 2019 & 2032
- Table 54: Global EPA/DHA Ingredients Industry Volume Billion Forecast, by Application 2019 & 2032
- Table 55: Global EPA/DHA Ingredients Industry Revenue Million Forecast, by Country 2019 & 2032
- Table 56: Global EPA/DHA Ingredients Industry Volume Billion Forecast, by Country 2019 & 2032
- Table 57: China EPA/DHA Ingredients Industry Revenue (Million) Forecast, by Application 2019 & 2032
- Table 58: China EPA/DHA Ingredients Industry Volume (Billion) Forecast, by Application 2019 & 2032
- Table 59: Japan EPA/DHA Ingredients Industry Revenue (Million) Forecast, by Application 2019 & 2032
- Table 60: Japan EPA/DHA Ingredients Industry Volume (Billion) Forecast, by Application 2019 & 2032
- Table 61: India EPA/DHA Ingredients Industry Revenue (Million) Forecast, by Application 2019 & 2032
- Table 62: India EPA/DHA Ingredients Industry Volume (Billion) Forecast, by Application 2019 & 2032
- Table 63: Australia EPA/DHA Ingredients Industry Revenue (Million) Forecast, by Application 2019 & 2032
- Table 64: Australia EPA/DHA Ingredients Industry Volume (Billion) Forecast, by Application 2019 & 2032
- Table 65: Rest of Asia Pacific EPA/DHA Ingredients Industry Revenue (Million) Forecast, by Application 2019 & 2032
- Table 66: Rest of Asia Pacific EPA/DHA Ingredients Industry Volume (Billion) Forecast, by Application 2019 & 2032
- Table 67: Global EPA/DHA Ingredients Industry Revenue Million Forecast, by Type 2019 & 2032
- Table 68: Global EPA/DHA Ingredients Industry Volume Billion Forecast, by Type 2019 & 2032
- Table 69: Global EPA/DHA Ingredients Industry Revenue Million Forecast, by Source 2019 & 2032
- Table 70: Global EPA/DHA Ingredients Industry Volume Billion Forecast, by Source 2019 & 2032
- Table 71: Global EPA/DHA Ingredients Industry Revenue Million Forecast, by Application 2019 & 2032
- Table 72: Global EPA/DHA Ingredients Industry Volume Billion Forecast, by Application 2019 & 2032
- Table 73: Global EPA/DHA Ingredients Industry Revenue Million Forecast, by Country 2019 & 2032
- Table 74: Global EPA/DHA Ingredients Industry Volume Billion Forecast, by Country 2019 & 2032
- Table 75: Brazil EPA/DHA Ingredients Industry Revenue (Million) Forecast, by Application 2019 & 2032
- Table 76: Brazil EPA/DHA Ingredients Industry Volume (Billion) Forecast, by Application 2019 & 2032
- Table 77: Argentina EPA/DHA Ingredients Industry Revenue (Million) Forecast, by Application 2019 & 2032
- Table 78: Argentina EPA/DHA Ingredients Industry Volume (Billion) Forecast, by Application 2019 & 2032
- Table 79: Rest of South America EPA/DHA Ingredients Industry Revenue (Million) Forecast, by Application 2019 & 2032
- Table 80: Rest of South America EPA/DHA Ingredients Industry Volume (Billion) Forecast, by Application 2019 & 2032
- Table 81: Global EPA/DHA Ingredients Industry Revenue Million Forecast, by Type 2019 & 2032
- Table 82: Global EPA/DHA Ingredients Industry Volume Billion Forecast, by Type 2019 & 2032
- Table 83: Global EPA/DHA Ingredients Industry Revenue Million Forecast, by Source 2019 & 2032
- Table 84: Global EPA/DHA Ingredients Industry Volume Billion Forecast, by Source 2019 & 2032
- Table 85: Global EPA/DHA Ingredients Industry Revenue Million Forecast, by Application 2019 & 2032
- Table 86: Global EPA/DHA Ingredients Industry Volume Billion Forecast, by Application 2019 & 2032
- Table 87: Global EPA/DHA Ingredients Industry Revenue Million Forecast, by Country 2019 & 2032
- Table 88: Global EPA/DHA Ingredients Industry Volume Billion Forecast, by Country 2019 & 2032
- Table 89: United Arab Emirates EPA/DHA Ingredients Industry Revenue (Million) Forecast, by Application 2019 & 2032
- Table 90: United Arab Emirates EPA/DHA Ingredients Industry Volume (Billion) Forecast, by Application 2019 & 2032
- Table 91: South Africa EPA/DHA Ingredients Industry Revenue (Million) Forecast, by Application 2019 & 2032
- Table 92: South Africa EPA/DHA Ingredients Industry Volume (Billion) Forecast, by Application 2019 & 2032
- Table 93: Rest of Middle East and Africa EPA/DHA Ingredients Industry Revenue (Million) Forecast, by Application 2019 & 2032
- Table 94: Rest of Middle East and Africa EPA/DHA Ingredients Industry Volume (Billion) Forecast, by Application 2019 & 2032
Frequently Asked Questions
1. What is the projected Compound Annual Growth Rate (CAGR) of the EPA/DHA Ingredients Industry?
The projected CAGR is approximately 7.51%.
2. Which companies are prominent players in the EPA/DHA Ingredients Industry?
Key companies in the market include Koninklijke DSM NV, KD Pharma Group, The Archer Daniels Midland Company, Corbion NV, Novasep Holding SAS, Neptune Wellness Solutions, BASF SE, Omega Protein Corporation, Croda International PLC, Novotech Nutraceuticals*List Not Exhaustive.
3. What are the main segments of the EPA/DHA Ingredients Industry?
The market segments include Type, Source, Application.
4. Can you provide details about the market size?
The market size is estimated to be USD 1.92 Million as of 2022.
5. What are some drivers contributing to market growth?
Increasing Awareness Of Health Benefits Associated With EPA And DHA; Demand for Concentrated Forms of Omega 3.
6. What are the notable trends driving market growth?
Increasing Awareness Of Health Benefits Associated With EPA And DHA.
7. Are there any restraints impacting market growth?
Increasing Awareness Of Health Benefits Associated With EPA And DHA; Demand for Concentrated Forms of Omega 3.
8. Can you provide examples of recent developments in the market?
March 2024: DSM-Firmenich partnered with SCN BestCo to launch omega-3 gummies with EPA and DHA ingredients.
9. What pricing options are available for accessing the report?
Pricing options include single-user, multi-user, and enterprise licenses priced at USD 4750, USD 5250, and USD 8750 respectively.
10. Is the market size provided in terms of value or volume?
The market size is provided in terms of value, measured in Million and volume, measured in Billion.
11. Are there any specific market keywords associated with the report?
Yes, the market keyword associated with the report is "EPA/DHA Ingredients Industry," which aids in identifying and referencing the specific market segment covered.
12. How do I determine which pricing option suits my needs best?
The pricing options vary based on user requirements and access needs. Individual users may opt for single-user licenses, while businesses requiring broader access may choose multi-user or enterprise licenses for cost-effective access to the report.
13. Are there any additional resources or data provided in the EPA/DHA Ingredients Industry report?
While the report offers comprehensive insights, it's advisable to review the specific contents or supplementary materials provided to ascertain if additional resources or data are available.
14. How can I stay updated on further developments or reports in the EPA/DHA Ingredients Industry?
To stay informed about further developments, trends, and reports in the EPA/DHA Ingredients Industry, consider subscribing to industry newsletters, following relevant companies and organizations, or regularly checking reputable industry news sources and publications.
Methodology
Step 1 - Identification of Relevant Samples Size from Population Database


Step 2 - Approaches for Defining Global Market Size (Value, Volume* & Price*)

Note*: In applicable scenarios
Step 3 - Data Sources
Primary Research
- Web Analytics
- Survey Reports
- Research Institute
- Latest Research Reports
- Opinion Leaders
Secondary Research
- Annual Reports
- White Paper
- Latest Press Release
- Industry Association
- Paid Database
- Investor Presentations

Step 4 - Data Triangulation
Involves using different sources of information in order to increase the validity of a study
These sources are likely to be stakeholders in a program - participants, other researchers, program staff, other community members, and so on.
Then we put all data in single framework & apply various statistical tools to find out the dynamic on the market.
During the analysis stage, feedback from the stakeholder groups would be compared to determine areas of agreement as well as areas of divergence


