
Key Insights
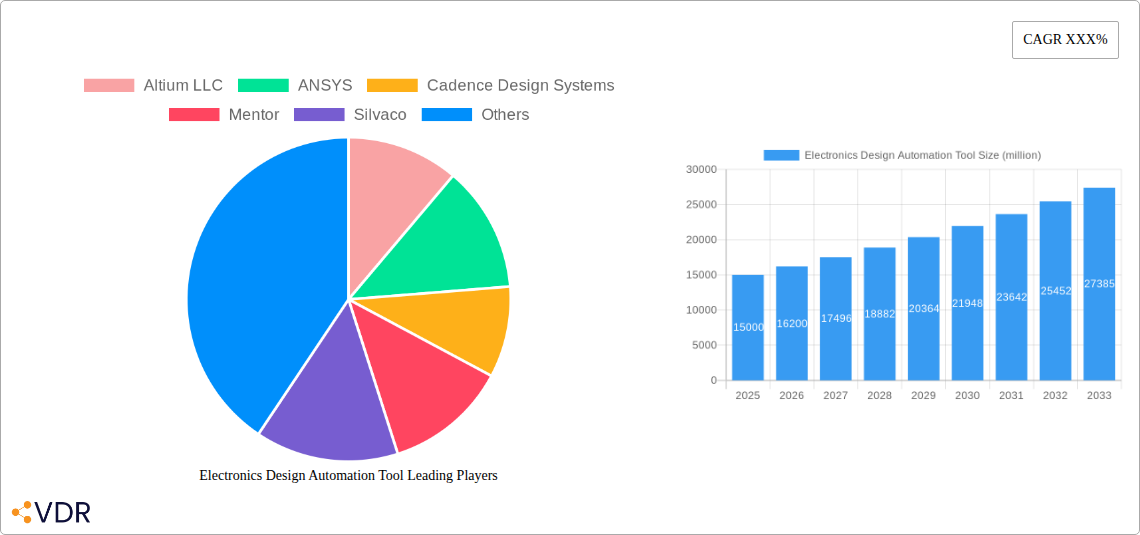
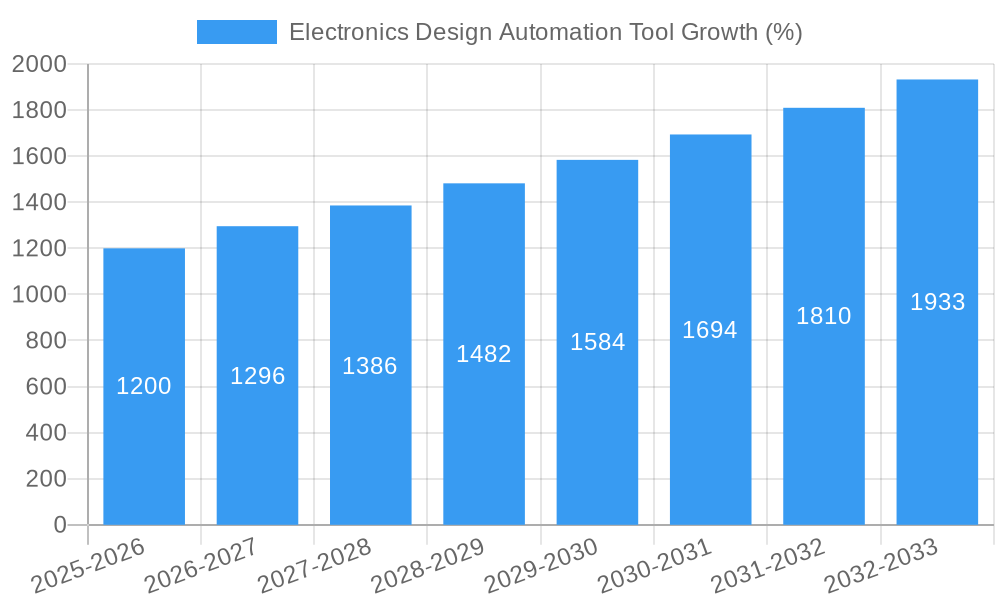
The Electronics Design Automation (EDA) tool market is experiencing robust growth, driven by the increasing complexity of electronic systems and the rising demand for faster and more efficient design processes. The market, estimated at $15 billion in 2025, is projected to maintain a Compound Annual Growth Rate (CAGR) of approximately 8% from 2025 to 2033, reaching an estimated $27 billion by 2033. This expansion is fueled by several key factors, including the proliferation of connected devices in the Internet of Things (IoT) ecosystem, the growing adoption of advanced technologies like 5G and artificial intelligence (AI), and the continuous miniaturization of electronic components demanding sophisticated design tools. Leading companies like Altium, ANSYS, Cadence Design Systems, Mentor Graphics (a Siemens business), Silvaco, Synopsys, and Vennsa Technologies are at the forefront of innovation, constantly improving their EDA software to meet the evolving needs of the industry.
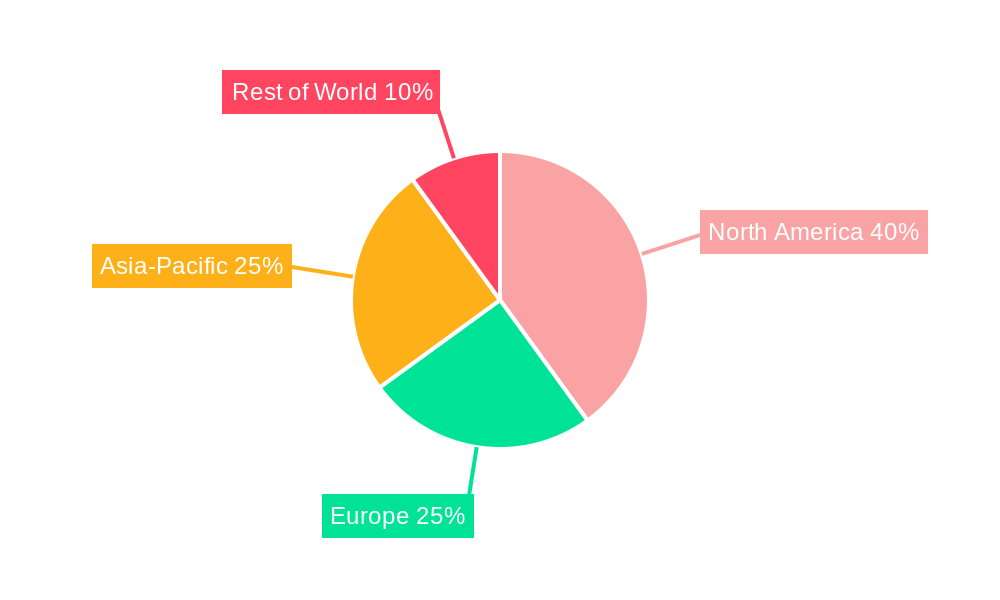
Significant trends shaping the EDA market include the increasing integration of artificial intelligence and machine learning for design optimization and verification, the rise of cloud-based EDA solutions offering enhanced scalability and accessibility, and the growing demand for specialized EDA tools catering to specific application domains like automotive electronics and high-performance computing. Despite these positive trends, challenges remain, such as the high cost of implementation and maintenance of sophisticated EDA software and the need for skilled professionals capable of effectively utilizing these advanced tools. The market segmentation reflects the diverse applications of EDA tools, ranging from printed circuit board (PCB) design to integrated circuit (IC) design and system-level simulation. Geographical growth will be distributed across regions, with North America and Asia-Pacific expected to remain leading markets due to significant technological advancements and manufacturing hubs.
Electronics Design Automation (EDA) Tool Market Report: 2019-2033
This comprehensive report provides a detailed analysis of the Electronics Design Automation (EDA) tool market, offering invaluable insights for industry professionals, investors, and strategic decision-makers. The study covers the period from 2019 to 2033, with a focus on the forecast period of 2025-2033 and a base year of 2025. The report meticulously analyzes market dynamics, growth trends, regional performance, product landscapes, and key players, providing a complete picture of this rapidly evolving sector. The total market value in 2025 is estimated at xx million units, projected to reach xx million units by 2033.
Electronics Design Automation Tool Market Dynamics & Structure
The Electronics Design Automation (EDA) tool market is characterized by a moderately concentrated landscape, with key players like Cadence Design Systems, Siemens, and Synopsys holding significant market share. Market concentration is influenced by high barriers to entry, including substantial R&D investments and the need for specialized expertise. Technological innovation, primarily driven by advancements in Artificial Intelligence (AI), machine learning, and high-performance computing, is a key driver of market growth. Stringent regulatory frameworks surrounding intellectual property and data security also play a crucial role. While direct substitutes are limited, alternative design methodologies and open-source tools pose some competitive pressure. The end-user demographics consist primarily of semiconductor companies, electronics manufacturers, and research institutions. M&A activity in the sector has been moderate, with a xx number of deals recorded between 2019 and 2024, primarily focused on acquiring specialized expertise and expanding product portfolios.
- Market Concentration: Moderately concentrated, with top 5 players holding approximately xx% market share in 2025.
- Innovation Drivers: AI, machine learning, high-performance computing, and cloud-based solutions.
- Regulatory Frameworks: Stringent intellectual property and data security regulations.
- Competitive Substitutes: Limited direct substitutes; open-source tools and alternative design methodologies represent indirect competition.
- End-User Demographics: Semiconductor companies, electronics manufacturers, research institutions.
- M&A Trends: xx M&A deals between 2019 and 2024, focused on technology acquisition and market expansion.
Electronics Design Automation Tool Growth Trends & Insights
The EDA tool market has witnessed consistent growth over the historical period (2019-2024), driven by the increasing complexity of electronic designs and the rising demand for miniaturization and higher performance. The market is projected to experience a Compound Annual Growth Rate (CAGR) of xx% during the forecast period (2025-2033), reaching a market size of xx million units by 2033. This growth is fueled by technological advancements, particularly in areas like 5G, IoT, and autonomous vehicles, which require sophisticated EDA tools for design and verification. The adoption rate of advanced EDA tools is increasing, particularly among larger companies with high R&D budgets. Consumer behavior shifts towards more sophisticated electronic devices and systems are further boosting demand. The market penetration of cloud-based EDA solutions is rapidly growing, further driving market expansion.
Dominant Regions, Countries, or Segments in Electronics Design Automation Tool
North America currently holds the largest market share in the EDA tool market, driven by the presence of major players, substantial R&D investments, and a well-established semiconductor and electronics industry. Asia-Pacific, particularly China and South Korea, is witnessing rapid growth due to expanding domestic electronics manufacturing and increasing government support for technological advancements. Europe also contributes significantly, with a strong presence in specific niche segments.
- North America: Strong market presence of major EDA vendors, high R&D spending, and mature electronics industry.
- Asia-Pacific: Rapid growth fueled by expanding domestic electronics manufacturing and government support.
- Europe: Significant contribution to specific niche segments within the EDA tool market.
Electronics Design Automation Tool Product Landscape
The EDA tool market encompasses a wide range of products, including schematic capture, PCB design, simulation, verification, and physical design tools. Recent product innovations include AI-powered design automation, cloud-based platforms, and improved integration with other design tools. Key performance metrics include design efficiency, simulation accuracy, and verification speed. Unique selling propositions often revolve around specific functionalities, ease of use, and integration capabilities. Technological advancements continue to drive the development of more sophisticated and efficient tools.
Key Drivers, Barriers & Challenges in Electronics Design Automation Tool
Key Drivers:
- Increasing complexity of electronic designs.
- Growing demand for miniaturization and higher performance.
- Technological advancements in AI, machine learning, and high-performance computing.
- Expansion of the semiconductor and electronics industry globally.
Key Challenges & Restraints:
- High cost of EDA tools, especially for small and medium-sized enterprises (SMEs).
- The need for highly skilled professionals to operate and maintain these sophisticated tools.
- Increased competition from open-source tools and alternative design methodologies.
- Potential supply chain disruptions impacting availability of critical components for EDA tool development.
Emerging Opportunities in Electronics Design Automation Tool
Emerging opportunities lie in the development of EDA tools for specific applications, such as automotive electronics, 5G infrastructure, and AI-powered devices. The integration of AI and machine learning into EDA tools is another significant opportunity. Furthermore, the expansion of cloud-based EDA solutions offers significant growth potential. Untapped markets in developing economies also present opportunities for expansion.
Growth Accelerators in the Electronics Design Automation Tool Industry
Long-term growth will be fueled by ongoing technological breakthroughs in areas like AI and high-performance computing. Strategic partnerships between EDA vendors and semiconductor manufacturers are crucial in accelerating market expansion. Market penetration strategies focusing on SMEs and niche markets will also play a role in driving growth.
Key Players Shaping the Electronics Design Automation Tool Market
- Altium LLC
- ANSYS
- Cadence Design Systems
- Mentor (A Siemens Business)
- Silvaco
- Synopsys
- Vennsa Technologies
- Siemens
Notable Milestones in Electronics Design Automation Tool Sector
- 2020: Cadence Design Systems launched its cloud-based EDA platform.
- 2021: Synopsys introduced a new AI-powered verification tool.
- 2022: Siemens acquired a smaller EDA company specializing in specific design tools.
- 2023: Altium released a major update to its PCB design software.
In-Depth Electronics Design Automation Tool Market Outlook
The future of the EDA tool market is bright, with continued growth driven by technological advancements and the increasing complexity of electronic designs. Strategic partnerships, expansion into new markets, and the development of innovative products will be crucial for success. The market presents significant opportunities for both established players and new entrants, particularly those focusing on AI-powered solutions and cloud-based platforms. The continued demand for sophisticated electronic devices across various sectors will ensure sustained growth for the foreseeable future.
Electronics Design Automation Tool Segmentation
-
1. Application
- 1.1. Microprocessors & Controllers
- 1.2. Memory Management Units
- 1.3. Others
-
2. Type
- 2.1. Simulation Electronics Design Automation Tool
- 2.2. Design Electronics Design Automation Tool
- 2.3. Verification Electronics Design Automation Tool
Electronics Design Automation Tool Segmentation By Geography
-
1. North America
- 1.1. United States
- 1.2. Canada
- 1.3. Mexico
-
2. South America
- 2.1. Brazil
- 2.2. Argentina
- 2.3. Rest of South America
-
3. Europe
- 3.1. United Kingdom
- 3.2. Germany
- 3.3. France
- 3.4. Italy
- 3.5. Spain
- 3.6. Russia
- 3.7. Benelux
- 3.8. Nordics
- 3.9. Rest of Europe
-
4. Middle East & Africa
- 4.1. Turkey
- 4.2. Israel
- 4.3. GCC
- 4.4. North Africa
- 4.5. South Africa
- 4.6. Rest of Middle East & Africa
-
5. Asia Pacific
- 5.1. China
- 5.2. India
- 5.3. Japan
- 5.4. South Korea
- 5.5. ASEAN
- 5.6. Oceania
- 5.7. Rest of Asia Pacific
Electronics Design Automation Tool REPORT HIGHLIGHTS
| Aspects | Details |
|---|---|
| Study Period | 2019-2033 |
| Base Year | 2024 |
| Estimated Year | 2025 |
| Forecast Period | 2025-2033 |
| Historical Period | 2019-2024 |
| Growth Rate | CAGR of XXX% from 2019-2033 |
| Segmentation |
|
Table of Contents
- 1. Introduction
- 1.1. Research Scope
- 1.2. Market Segmentation
- 1.3. Research Methodology
- 1.4. Definitions and Assumptions
- 2. Executive Summary
- 2.1. Introduction
- 3. Market Dynamics
- 3.1. Introduction
- 3.2. Market Drivers
- 3.3. Market Restrains
- 3.4. Market Trends
- 4. Market Factor Analysis
- 4.1. Porters Five Forces
- 4.2. Supply/Value Chain
- 4.3. PESTEL analysis
- 4.4. Market Entropy
- 4.5. Patent/Trademark Analysis
- 5. Global Electronics Design Automation Tool Analysis, Insights and Forecast, 2019-2031
- 5.1. Market Analysis, Insights and Forecast - by Application
- 5.1.1. Microprocessors & Controllers
- 5.1.2. Memory Management Units
- 5.1.3. Others
- 5.2. Market Analysis, Insights and Forecast - by Type
- 5.2.1. Simulation Electronics Design Automation Tool
- 5.2.2. Design Electronics Design Automation Tool
- 5.2.3. Verification Electronics Design Automation Tool
- 5.3. Market Analysis, Insights and Forecast - by Region
- 5.3.1. North America
- 5.3.2. South America
- 5.3.3. Europe
- 5.3.4. Middle East & Africa
- 5.3.5. Asia Pacific
- 5.1. Market Analysis, Insights and Forecast - by Application
- 6. North America Electronics Design Automation Tool Analysis, Insights and Forecast, 2019-2031
- 6.1. Market Analysis, Insights and Forecast - by Application
- 6.1.1. Microprocessors & Controllers
- 6.1.2. Memory Management Units
- 6.1.3. Others
- 6.2. Market Analysis, Insights and Forecast - by Type
- 6.2.1. Simulation Electronics Design Automation Tool
- 6.2.2. Design Electronics Design Automation Tool
- 6.2.3. Verification Electronics Design Automation Tool
- 6.1. Market Analysis, Insights and Forecast - by Application
- 7. South America Electronics Design Automation Tool Analysis, Insights and Forecast, 2019-2031
- 7.1. Market Analysis, Insights and Forecast - by Application
- 7.1.1. Microprocessors & Controllers
- 7.1.2. Memory Management Units
- 7.1.3. Others
- 7.2. Market Analysis, Insights and Forecast - by Type
- 7.2.1. Simulation Electronics Design Automation Tool
- 7.2.2. Design Electronics Design Automation Tool
- 7.2.3. Verification Electronics Design Automation Tool
- 7.1. Market Analysis, Insights and Forecast - by Application
- 8. Europe Electronics Design Automation Tool Analysis, Insights and Forecast, 2019-2031
- 8.1. Market Analysis, Insights and Forecast - by Application
- 8.1.1. Microprocessors & Controllers
- 8.1.2. Memory Management Units
- 8.1.3. Others
- 8.2. Market Analysis, Insights and Forecast - by Type
- 8.2.1. Simulation Electronics Design Automation Tool
- 8.2.2. Design Electronics Design Automation Tool
- 8.2.3. Verification Electronics Design Automation Tool
- 8.1. Market Analysis, Insights and Forecast - by Application
- 9. Middle East & Africa Electronics Design Automation Tool Analysis, Insights and Forecast, 2019-2031
- 9.1. Market Analysis, Insights and Forecast - by Application
- 9.1.1. Microprocessors & Controllers
- 9.1.2. Memory Management Units
- 9.1.3. Others
- 9.2. Market Analysis, Insights and Forecast - by Type
- 9.2.1. Simulation Electronics Design Automation Tool
- 9.2.2. Design Electronics Design Automation Tool
- 9.2.3. Verification Electronics Design Automation Tool
- 9.1. Market Analysis, Insights and Forecast - by Application
- 10. Asia Pacific Electronics Design Automation Tool Analysis, Insights and Forecast, 2019-2031
- 10.1. Market Analysis, Insights and Forecast - by Application
- 10.1.1. Microprocessors & Controllers
- 10.1.2. Memory Management Units
- 10.1.3. Others
- 10.2. Market Analysis, Insights and Forecast - by Type
- 10.2.1. Simulation Electronics Design Automation Tool
- 10.2.2. Design Electronics Design Automation Tool
- 10.2.3. Verification Electronics Design Automation Tool
- 10.1. Market Analysis, Insights and Forecast - by Application
- 11. Competitive Analysis
- 11.1. Global Market Share Analysis 2024
- 11.2. Company Profiles
- 11.2.1 Altium LLC
- 11.2.1.1. Overview
- 11.2.1.2. Products
- 11.2.1.3. SWOT Analysis
- 11.2.1.4. Recent Developments
- 11.2.1.5. Financials (Based on Availability)
- 11.2.2 ANSYS
- 11.2.2.1. Overview
- 11.2.2.2. Products
- 11.2.2.3. SWOT Analysis
- 11.2.2.4. Recent Developments
- 11.2.2.5. Financials (Based on Availability)
- 11.2.3 Cadence Design Systems
- 11.2.3.1. Overview
- 11.2.3.2. Products
- 11.2.3.3. SWOT Analysis
- 11.2.3.4. Recent Developments
- 11.2.3.5. Financials (Based on Availability)
- 11.2.4 Mentor
- 11.2.4.1. Overview
- 11.2.4.2. Products
- 11.2.4.3. SWOT Analysis
- 11.2.4.4. Recent Developments
- 11.2.4.5. Financials (Based on Availability)
- 11.2.5 Silvaco
- 11.2.5.1. Overview
- 11.2.5.2. Products
- 11.2.5.3. SWOT Analysis
- 11.2.5.4. Recent Developments
- 11.2.5.5. Financials (Based on Availability)
- 11.2.6 Synopsis
- 11.2.6.1. Overview
- 11.2.6.2. Products
- 11.2.6.3. SWOT Analysis
- 11.2.6.4. Recent Developments
- 11.2.6.5. Financials (Based on Availability)
- 11.2.7 Vennsa Technologies
- 11.2.7.1. Overview
- 11.2.7.2. Products
- 11.2.7.3. SWOT Analysis
- 11.2.7.4. Recent Developments
- 11.2.7.5. Financials (Based on Availability)
- 11.2.8 Siemens
- 11.2.8.1. Overview
- 11.2.8.2. Products
- 11.2.8.3. SWOT Analysis
- 11.2.8.4. Recent Developments
- 11.2.8.5. Financials (Based on Availability)
- 11.2.1 Altium LLC
List of Figures
- Figure 1: Global Electronics Design Automation Tool Revenue Breakdown (million, %) by Region 2024 & 2032
- Figure 2: North America Electronics Design Automation Tool Revenue (million), by Application 2024 & 2032
- Figure 3: North America Electronics Design Automation Tool Revenue Share (%), by Application 2024 & 2032
- Figure 4: North America Electronics Design Automation Tool Revenue (million), by Type 2024 & 2032
- Figure 5: North America Electronics Design Automation Tool Revenue Share (%), by Type 2024 & 2032
- Figure 6: North America Electronics Design Automation Tool Revenue (million), by Country 2024 & 2032
- Figure 7: North America Electronics Design Automation Tool Revenue Share (%), by Country 2024 & 2032
- Figure 8: South America Electronics Design Automation Tool Revenue (million), by Application 2024 & 2032
- Figure 9: South America Electronics Design Automation Tool Revenue Share (%), by Application 2024 & 2032
- Figure 10: South America Electronics Design Automation Tool Revenue (million), by Type 2024 & 2032
- Figure 11: South America Electronics Design Automation Tool Revenue Share (%), by Type 2024 & 2032
- Figure 12: South America Electronics Design Automation Tool Revenue (million), by Country 2024 & 2032
- Figure 13: South America Electronics Design Automation Tool Revenue Share (%), by Country 2024 & 2032
- Figure 14: Europe Electronics Design Automation Tool Revenue (million), by Application 2024 & 2032
- Figure 15: Europe Electronics Design Automation Tool Revenue Share (%), by Application 2024 & 2032
- Figure 16: Europe Electronics Design Automation Tool Revenue (million), by Type 2024 & 2032
- Figure 17: Europe Electronics Design Automation Tool Revenue Share (%), by Type 2024 & 2032
- Figure 18: Europe Electronics Design Automation Tool Revenue (million), by Country 2024 & 2032
- Figure 19: Europe Electronics Design Automation Tool Revenue Share (%), by Country 2024 & 2032
- Figure 20: Middle East & Africa Electronics Design Automation Tool Revenue (million), by Application 2024 & 2032
- Figure 21: Middle East & Africa Electronics Design Automation Tool Revenue Share (%), by Application 2024 & 2032
- Figure 22: Middle East & Africa Electronics Design Automation Tool Revenue (million), by Type 2024 & 2032
- Figure 23: Middle East & Africa Electronics Design Automation Tool Revenue Share (%), by Type 2024 & 2032
- Figure 24: Middle East & Africa Electronics Design Automation Tool Revenue (million), by Country 2024 & 2032
- Figure 25: Middle East & Africa Electronics Design Automation Tool Revenue Share (%), by Country 2024 & 2032
- Figure 26: Asia Pacific Electronics Design Automation Tool Revenue (million), by Application 2024 & 2032
- Figure 27: Asia Pacific Electronics Design Automation Tool Revenue Share (%), by Application 2024 & 2032
- Figure 28: Asia Pacific Electronics Design Automation Tool Revenue (million), by Type 2024 & 2032
- Figure 29: Asia Pacific Electronics Design Automation Tool Revenue Share (%), by Type 2024 & 2032
- Figure 30: Asia Pacific Electronics Design Automation Tool Revenue (million), by Country 2024 & 2032
- Figure 31: Asia Pacific Electronics Design Automation Tool Revenue Share (%), by Country 2024 & 2032
List of Tables
- Table 1: Global Electronics Design Automation Tool Revenue million Forecast, by Region 2019 & 2032
- Table 2: Global Electronics Design Automation Tool Revenue million Forecast, by Application 2019 & 2032
- Table 3: Global Electronics Design Automation Tool Revenue million Forecast, by Type 2019 & 2032
- Table 4: Global Electronics Design Automation Tool Revenue million Forecast, by Region 2019 & 2032
- Table 5: Global Electronics Design Automation Tool Revenue million Forecast, by Application 2019 & 2032
- Table 6: Global Electronics Design Automation Tool Revenue million Forecast, by Type 2019 & 2032
- Table 7: Global Electronics Design Automation Tool Revenue million Forecast, by Country 2019 & 2032
- Table 8: United States Electronics Design Automation Tool Revenue (million) Forecast, by Application 2019 & 2032
- Table 9: Canada Electronics Design Automation Tool Revenue (million) Forecast, by Application 2019 & 2032
- Table 10: Mexico Electronics Design Automation Tool Revenue (million) Forecast, by Application 2019 & 2032
- Table 11: Global Electronics Design Automation Tool Revenue million Forecast, by Application 2019 & 2032
- Table 12: Global Electronics Design Automation Tool Revenue million Forecast, by Type 2019 & 2032
- Table 13: Global Electronics Design Automation Tool Revenue million Forecast, by Country 2019 & 2032
- Table 14: Brazil Electronics Design Automation Tool Revenue (million) Forecast, by Application 2019 & 2032
- Table 15: Argentina Electronics Design Automation Tool Revenue (million) Forecast, by Application 2019 & 2032
- Table 16: Rest of South America Electronics Design Automation Tool Revenue (million) Forecast, by Application 2019 & 2032
- Table 17: Global Electronics Design Automation Tool Revenue million Forecast, by Application 2019 & 2032
- Table 18: Global Electronics Design Automation Tool Revenue million Forecast, by Type 2019 & 2032
- Table 19: Global Electronics Design Automation Tool Revenue million Forecast, by Country 2019 & 2032
- Table 20: United Kingdom Electronics Design Automation Tool Revenue (million) Forecast, by Application 2019 & 2032
- Table 21: Germany Electronics Design Automation Tool Revenue (million) Forecast, by Application 2019 & 2032
- Table 22: France Electronics Design Automation Tool Revenue (million) Forecast, by Application 2019 & 2032
- Table 23: Italy Electronics Design Automation Tool Revenue (million) Forecast, by Application 2019 & 2032
- Table 24: Spain Electronics Design Automation Tool Revenue (million) Forecast, by Application 2019 & 2032
- Table 25: Russia Electronics Design Automation Tool Revenue (million) Forecast, by Application 2019 & 2032
- Table 26: Benelux Electronics Design Automation Tool Revenue (million) Forecast, by Application 2019 & 2032
- Table 27: Nordics Electronics Design Automation Tool Revenue (million) Forecast, by Application 2019 & 2032
- Table 28: Rest of Europe Electronics Design Automation Tool Revenue (million) Forecast, by Application 2019 & 2032
- Table 29: Global Electronics Design Automation Tool Revenue million Forecast, by Application 2019 & 2032
- Table 30: Global Electronics Design Automation Tool Revenue million Forecast, by Type 2019 & 2032
- Table 31: Global Electronics Design Automation Tool Revenue million Forecast, by Country 2019 & 2032
- Table 32: Turkey Electronics Design Automation Tool Revenue (million) Forecast, by Application 2019 & 2032
- Table 33: Israel Electronics Design Automation Tool Revenue (million) Forecast, by Application 2019 & 2032
- Table 34: GCC Electronics Design Automation Tool Revenue (million) Forecast, by Application 2019 & 2032
- Table 35: North Africa Electronics Design Automation Tool Revenue (million) Forecast, by Application 2019 & 2032
- Table 36: South Africa Electronics Design Automation Tool Revenue (million) Forecast, by Application 2019 & 2032
- Table 37: Rest of Middle East & Africa Electronics Design Automation Tool Revenue (million) Forecast, by Application 2019 & 2032
- Table 38: Global Electronics Design Automation Tool Revenue million Forecast, by Application 2019 & 2032
- Table 39: Global Electronics Design Automation Tool Revenue million Forecast, by Type 2019 & 2032
- Table 40: Global Electronics Design Automation Tool Revenue million Forecast, by Country 2019 & 2032
- Table 41: China Electronics Design Automation Tool Revenue (million) Forecast, by Application 2019 & 2032
- Table 42: India Electronics Design Automation Tool Revenue (million) Forecast, by Application 2019 & 2032
- Table 43: Japan Electronics Design Automation Tool Revenue (million) Forecast, by Application 2019 & 2032
- Table 44: South Korea Electronics Design Automation Tool Revenue (million) Forecast, by Application 2019 & 2032
- Table 45: ASEAN Electronics Design Automation Tool Revenue (million) Forecast, by Application 2019 & 2032
- Table 46: Oceania Electronics Design Automation Tool Revenue (million) Forecast, by Application 2019 & 2032
- Table 47: Rest of Asia Pacific Electronics Design Automation Tool Revenue (million) Forecast, by Application 2019 & 2032
Frequently Asked Questions
1. What is the projected Compound Annual Growth Rate (CAGR) of the Electronics Design Automation Tool?
The projected CAGR is approximately XXX%.
2. Which companies are prominent players in the Electronics Design Automation Tool?
Key companies in the market include Altium LLC, ANSYS, Cadence Design Systems, Mentor, Silvaco, Synopsis, Vennsa Technologies, Siemens.
3. What are the main segments of the Electronics Design Automation Tool?
The market segments include Application, Type.
4. Can you provide details about the market size?
The market size is estimated to be USD XXX million as of 2022.
5. What are some drivers contributing to market growth?
N/A
6. What are the notable trends driving market growth?
N/A
7. Are there any restraints impacting market growth?
N/A
8. Can you provide examples of recent developments in the market?
N/A
9. What pricing options are available for accessing the report?
Pricing options include single-user, multi-user, and enterprise licenses priced at USD 2900.00, USD 4350.00, and USD 5800.00 respectively.
10. Is the market size provided in terms of value or volume?
The market size is provided in terms of value, measured in million.
11. Are there any specific market keywords associated with the report?
Yes, the market keyword associated with the report is "Electronics Design Automation Tool," which aids in identifying and referencing the specific market segment covered.
12. How do I determine which pricing option suits my needs best?
The pricing options vary based on user requirements and access needs. Individual users may opt for single-user licenses, while businesses requiring broader access may choose multi-user or enterprise licenses for cost-effective access to the report.
13. Are there any additional resources or data provided in the Electronics Design Automation Tool report?
While the report offers comprehensive insights, it's advisable to review the specific contents or supplementary materials provided to ascertain if additional resources or data are available.
14. How can I stay updated on further developments or reports in the Electronics Design Automation Tool?
To stay informed about further developments, trends, and reports in the Electronics Design Automation Tool, consider subscribing to industry newsletters, following relevant companies and organizations, or regularly checking reputable industry news sources and publications.
Methodology
Step 1 - Identification of Relevant Samples Size from Population Database


Step 2 - Approaches for Defining Global Market Size (Value, Volume* & Price*)

Note*: In applicable scenarios
Step 3 - Data Sources
Primary Research
- Web Analytics
- Survey Reports
- Research Institute
- Latest Research Reports
- Opinion Leaders
Secondary Research
- Annual Reports
- White Paper
- Latest Press Release
- Industry Association
- Paid Database
- Investor Presentations

Step 4 - Data Triangulation
Involves using different sources of information in order to increase the validity of a study
These sources are likely to be stakeholders in a program - participants, other researchers, program staff, other community members, and so on.
Then we put all data in single framework & apply various statistical tools to find out the dynamic on the market.
During the analysis stage, feedback from the stakeholder groups would be compared to determine areas of agreement as well as areas of divergence


