
Key Insights
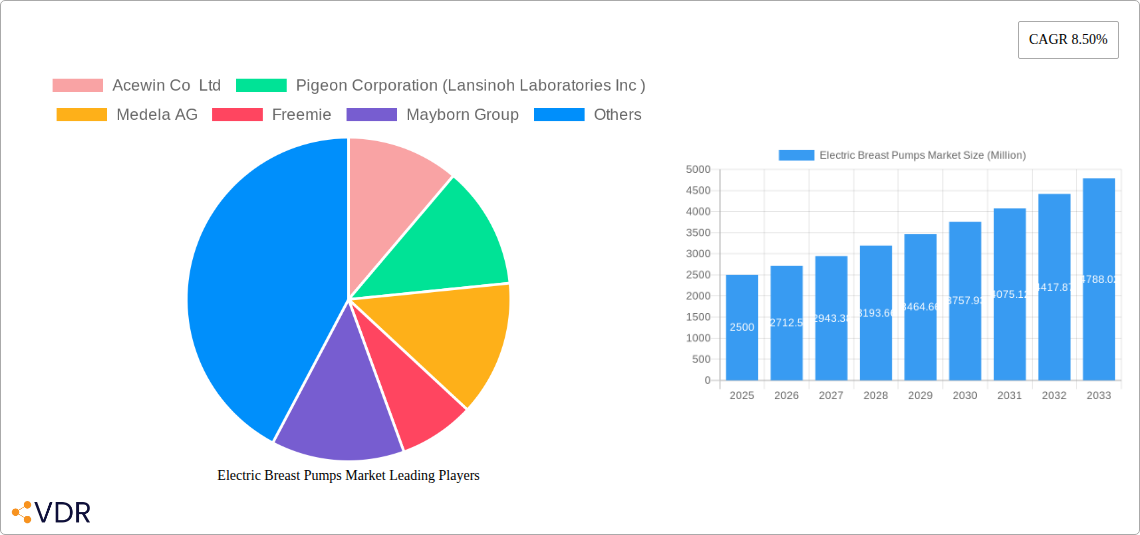
The electric breast pump market, exhibiting a robust Compound Annual Growth Rate (CAGR) of 8.50% from 2019 to 2024, is poised for continued expansion through 2033. Driven by increasing awareness of breastfeeding benefits, rising maternal employment rates leading to a demand for efficient pumping solutions, and technological advancements resulting in quieter, more comfortable, and portable devices, the market is experiencing significant growth across various segments. The preference for electric pumps over manual or battery-powered options is fueled by their convenience, speed, and effectiveness in extracting milk, particularly for mothers with demanding schedules or low milk supply. The closed-system breast pumps segment is gaining traction due to enhanced hygiene and reduced risk of contamination. Further contributing to growth are the increasing availability of hospital-grade electric pumps for rental or purchase, and the growing popularity of wearable and smart pumps that offer convenience and discreet pumping options.
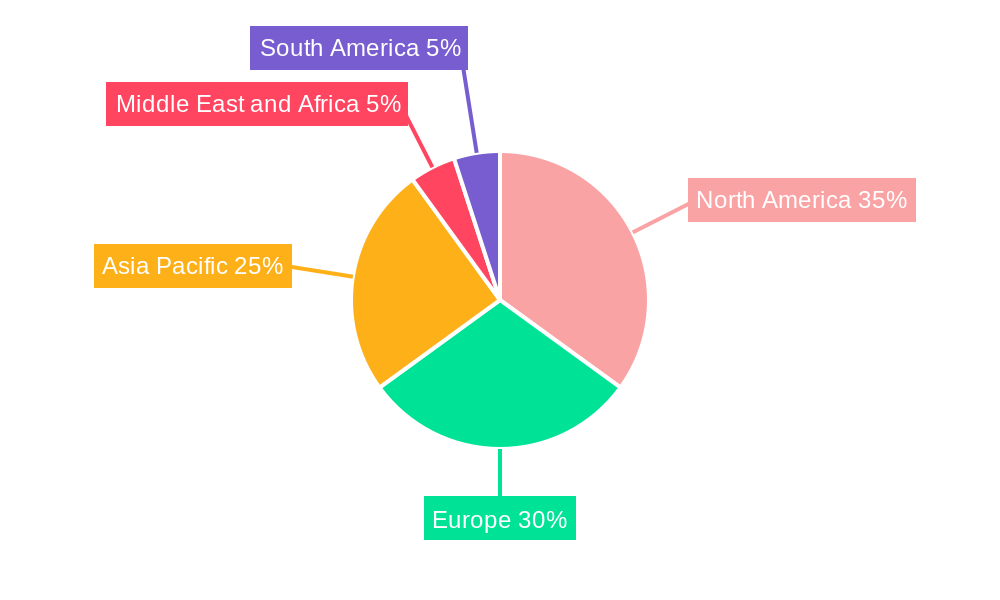
Geographically, North America and Europe currently dominate the market, driven by high healthcare expenditure and strong awareness campaigns promoting breastfeeding. However, Asia-Pacific is projected to witness the fastest growth in the coming years, fueled by rising disposable incomes, increasing urbanization, and changing lifestyle patterns within the region. Market restraints include the relatively high cost of electric breast pumps, which can be a barrier for some consumers, and concerns regarding the potential discomfort associated with prolonged pump usage. However, manufacturers are continually innovating to address these issues by offering more affordable models and incorporating ergonomic designs that enhance user comfort. The competitive landscape is marked by a mix of established players and emerging innovators who are driving innovation in pump technology, design, and features.
Electric Breast Pumps Market: A Comprehensive Report (2019-2033)
This comprehensive report provides an in-depth analysis of the global Electric Breast Pumps Market, encompassing market dynamics, growth trends, regional segmentation, product landscape, key players, and future outlook. The study period covers 2019-2033, with 2025 as the base year and forecast period extending to 2033. The report segments the market by product (Open System Breast Pump, Closed System Breast Pump), technology (Manual Breast Pump, Battery Powered Breast Pump, Electric Breast Pump), and application (Personal Use, Hospital Grade). This detailed analysis will equip industry professionals, investors, and stakeholders with the insights needed to navigate this evolving market. The market size is expected to reach xx Million units by 2033.
Electric Breast Pumps Market Market Dynamics & Structure
The electric breast pump market is characterized by a moderately concentrated landscape, with key players like Medela, Philips, and Ameda holding significant market share. Technological innovation, driven by demands for enhanced comfort, portability, and efficiency, is a key market driver. Stringent regulatory frameworks concerning safety and hygiene standards influence product development and market entry. The market faces competition from substitute products like manual pumps, though the convenience and effectiveness of electric pumps maintain their dominance. End-user demographics, predominantly mothers in developed and developing countries, are expanding, fueling market growth. Mergers and acquisitions (M&A) activity remains moderate, with a recorded xx deals in the past five years, mostly focused on enhancing product portfolios and expanding geographical reach.
- Market Concentration: Moderately concentrated, with top 5 players holding approximately xx% market share in 2025.
- Technological Innovation: Focus on silent operation, double pumping, smart features, and improved comfort.
- Regulatory Landscape: Stringent safety and hygiene regulations impact manufacturing and distribution.
- Competitive Substitutes: Manual pumps offer a low-cost alternative, but electric pumps maintain a significant advantage in efficiency and convenience.
- End-User Demographics: Growing number of working mothers and increasing awareness of breastfeeding benefits drive market expansion.
- M&A Activity: xx deals recorded between 2020-2025, predominantly focused on strategic acquisitions to enhance product lines.
Electric Breast Pumps Market Growth Trends & Insights
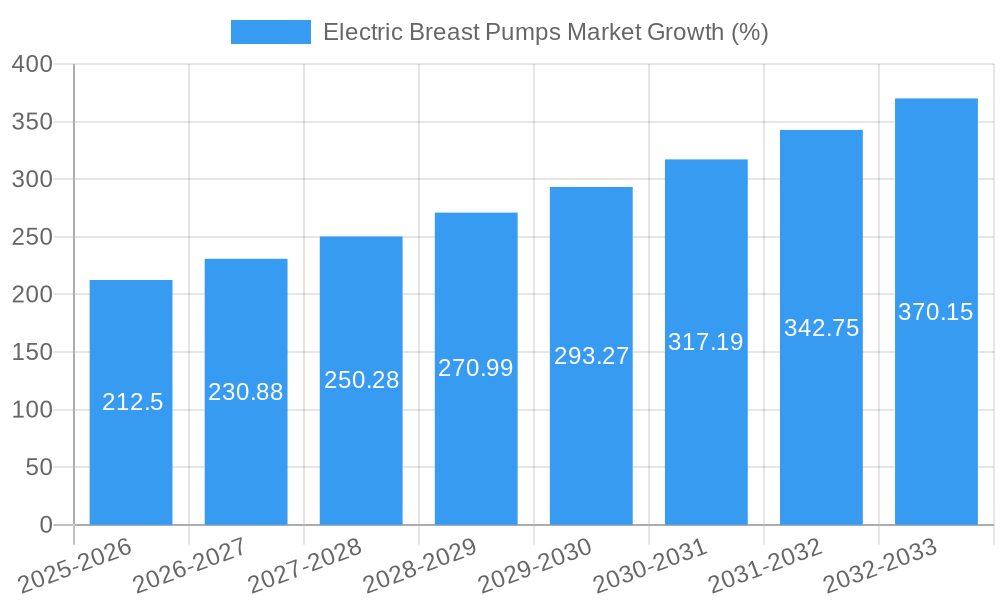
The global electric breast pump market is experiencing robust growth, fueled by rising awareness regarding the benefits of breastfeeding, increasing female participation in the workforce, and technological advancements in pump design and functionality. The market exhibited a CAGR of xx% during the historical period (2019-2024) and is projected to maintain a healthy CAGR of xx% during the forecast period (2025-2033). This growth is driven by increasing adoption of electric pumps over manual pumps, particularly among working mothers who value convenience and efficiency. The market penetration rate is currently at xx% in developed economies and is expected to significantly increase in developing countries over the forecast period. Technological disruptions, including the introduction of smart pumps with app connectivity and improved suction technology, are further driving market expansion. Consumer behavior shifts toward prioritizing convenience and effectiveness are also boosting demand for premium electric breast pumps. Specific features like rechargeable batteries and quiet operation are becoming increasingly important purchasing criteria.
Dominant Regions, Countries, or Segments in Electric Breast Pumps Market
North America and Europe currently dominate the electric breast pump market, driven by high breastfeeding rates, strong healthcare infrastructure, and high disposable incomes. However, Asia-Pacific is experiencing the fastest growth, fueled by rising awareness about breastfeeding benefits, increasing urbanization, and a growing middle class. Within the product segments, closed-system pumps hold a larger market share due to their superior hygiene features. The electric breast pump technology segment leads the market due to its convenience and efficiency. In terms of application, the personal use segment holds a significant majority, while the hospital-grade segment is characterized by stricter regulatory requirements and higher price points.
- Key Drivers (North America & Europe): High breastfeeding rates, advanced healthcare infrastructure, high disposable incomes.
- Key Drivers (Asia-Pacific): Rising awareness of breastfeeding benefits, increasing urbanization, growing middle class.
- Product Segmentation: Closed-system pumps dominate due to superior hygiene.
- Technology Segmentation: Electric breast pumps lead the market due to efficiency and convenience.
- Application Segmentation: Personal use segment is significantly larger than hospital-grade due to broader consumer adoption.
Electric Breast Pumps Market Product Landscape
The electric breast pump market offers a range of products varying in features, technology, and price points. Innovations focus on enhancing usability, comfort, and hygiene. Closed-system pumps, minimizing the risk of bacterial contamination, have gained significant traction. Technological advancements include the integration of smart features like app connectivity, adjustable suction settings, and rechargeable batteries. Unique selling propositions include quiet operation, portability, and comfortable design. Performance metrics like suction strength, ease of cleaning, and battery life are key determinants of consumer choice.
Key Drivers, Barriers & Challenges in Electric Breast Pumps Market
Key Drivers:
- Increasing awareness of breastfeeding benefits.
- Growing female participation in the workforce.
- Technological advancements offering improved convenience and performance.
- Government initiatives promoting breastfeeding.
Challenges & Restraints:
- High initial cost of electric pumps can be a barrier for some consumers.
- Concerns about the potential negative impacts on milk supply.
- Competition from cheaper manual pumps and substitute feeding methods.
- Supply chain disruptions potentially impacting availability and pricing.
Emerging Opportunities in Electric Breast Pumps Market
Emerging opportunities include expansion into untapped markets in developing countries, leveraging digital marketing strategies, and developing innovative products focusing on personalized experiences. Consumer preferences for compact, portable, and discreet designs present significant opportunities. The integration of smart technology offers potential for improved data tracking and personalized breastfeeding support. Exploring partnerships with healthcare providers and creating educational resources could further boost market penetration.
Growth Accelerators in the Electric Breast Pumps Market Industry
Technological advancements like the development of silent pumps with customizable suction strength, along with the incorporation of smart features, are driving growth. Strategic partnerships with healthcare providers and insurance companies are expanding access. Market expansion into developing countries with rising disposable incomes and increasing awareness of breastfeeding benefits presents significant opportunities for growth.
Key Players Shaping the Electric Breast Pumps Market Market
- Acewin Co Ltd
- Pigeon Corporation (Lansinoh Laboratories Inc)
- Medela AG
- Freemie
- Mayborn Group
- Bailey Medical
- Ameda AG
- Linco Baby Merchandise Works Co Ltd
- Hygeia
- Koninklijke Philips NV
- Willow Innovations Inc
- Ardo Medical AG
- Albert Hohlkorper GmbH & Co Kg
Notable Milestones in Electric Breast Pumps Market Sector
- October 2021: Medela launched the Swing Maxi, a double electric breast pump with a USB charging port and 1.5-hour battery life.
- April 2022: Ardo Medical launched the Ardo Alyssa, a hospital-grade breast pump with 250 mmHG double pumping and NICU capabilities.
In-Depth Electric Breast Pumps Market Market Outlook
The electric breast pump market is poised for sustained growth, driven by continuous technological advancements, increasing consumer awareness, and expansion into new geographical markets. Strategic partnerships, product diversification, and focusing on enhanced user experience will be crucial for success. The integration of smart features and connectivity holds significant potential to revolutionize the breastfeeding experience and further propel market expansion. The market presents attractive opportunities for both established players and emerging companies to innovate and capitalize on the growing demand.
Electric Breast Pumps Market Segmentation
-
1. Product
- 1.1. Open System Breast Pump
- 1.2. Closed System Breast Pump
-
2. Technology
- 2.1. Manual Breast Pump
- 2.2. Battery Powered Breast Pump
- 2.3. Electric Breast Pump
-
3. Application
- 3.1. Personal Use
- 3.2. Hospital Grade
Electric Breast Pumps Market Segmentation By Geography
-
1. North America
- 1.1. United States
- 1.2. Canada
- 1.3. Mexico
-
2. Europe
- 2.1. Germany
- 2.2. United Kingdom
- 2.3. France
- 2.4. Italy
- 2.5. Spain
- 2.6. Rest of Europe
-
3. Asia Pacific
- 3.1. China
- 3.2. Japan
- 3.3. India
- 3.4. Australia
- 3.5. South Korea
- 3.6. Rest of Asia Pacific
-
4. Middle East and Africa
- 4.1. GCC
- 4.2. South Africa
- 4.3. Rest of Middle East and Africa
-
5. South America
- 5.1. Brazil
- 5.2. Argentina
- 5.3. Rest of South America
Electric Breast Pumps Market REPORT HIGHLIGHTS
| Aspects | Details |
|---|---|
| Study Period | 2019-2033 |
| Base Year | 2024 |
| Estimated Year | 2025 |
| Forecast Period | 2025-2033 |
| Historical Period | 2019-2024 |
| Growth Rate | CAGR of 8.50% from 2019-2033 |
| Segmentation |
|
Table of Contents
- 1. Introduction
- 1.1. Research Scope
- 1.2. Market Segmentation
- 1.3. Research Methodology
- 1.4. Definitions and Assumptions
- 2. Executive Summary
- 2.1. Introduction
- 3. Market Dynamics
- 3.1. Introduction
- 3.2. Market Drivers
- 3.2.1. Increasing Global Women Employment Rates; Improving Healthcare Infrastructure in Emerging Economies; Government Initiatives in Support of Employed Mothers
- 3.3. Market Restrains
- 3.3.1. High Prices of Breast Pumps
- 3.4. Market Trends
- 3.4.1. The Closed System Breast Pumps Segment is Expected to Hold a Significant Market Share Over the Forecast Period
- 4. Market Factor Analysis
- 4.1. Porters Five Forces
- 4.2. Supply/Value Chain
- 4.3. PESTEL analysis
- 4.4. Market Entropy
- 4.5. Patent/Trademark Analysis
- 5. Global Electric Breast Pumps Market Analysis, Insights and Forecast, 2019-2031
- 5.1. Market Analysis, Insights and Forecast - by Product
- 5.1.1. Open System Breast Pump
- 5.1.2. Closed System Breast Pump
- 5.2. Market Analysis, Insights and Forecast - by Technology
- 5.2.1. Manual Breast Pump
- 5.2.2. Battery Powered Breast Pump
- 5.2.3. Electric Breast Pump
- 5.3. Market Analysis, Insights and Forecast - by Application
- 5.3.1. Personal Use
- 5.3.2. Hospital Grade
- 5.4. Market Analysis, Insights and Forecast - by Region
- 5.4.1. North America
- 5.4.2. Europe
- 5.4.3. Asia Pacific
- 5.4.4. Middle East and Africa
- 5.4.5. South America
- 5.1. Market Analysis, Insights and Forecast - by Product
- 6. North America Electric Breast Pumps Market Analysis, Insights and Forecast, 2019-2031
- 6.1. Market Analysis, Insights and Forecast - by Product
- 6.1.1. Open System Breast Pump
- 6.1.2. Closed System Breast Pump
- 6.2. Market Analysis, Insights and Forecast - by Technology
- 6.2.1. Manual Breast Pump
- 6.2.2. Battery Powered Breast Pump
- 6.2.3. Electric Breast Pump
- 6.3. Market Analysis, Insights and Forecast - by Application
- 6.3.1. Personal Use
- 6.3.2. Hospital Grade
- 6.1. Market Analysis, Insights and Forecast - by Product
- 7. Europe Electric Breast Pumps Market Analysis, Insights and Forecast, 2019-2031
- 7.1. Market Analysis, Insights and Forecast - by Product
- 7.1.1. Open System Breast Pump
- 7.1.2. Closed System Breast Pump
- 7.2. Market Analysis, Insights and Forecast - by Technology
- 7.2.1. Manual Breast Pump
- 7.2.2. Battery Powered Breast Pump
- 7.2.3. Electric Breast Pump
- 7.3. Market Analysis, Insights and Forecast - by Application
- 7.3.1. Personal Use
- 7.3.2. Hospital Grade
- 7.1. Market Analysis, Insights and Forecast - by Product
- 8. Asia Pacific Electric Breast Pumps Market Analysis, Insights and Forecast, 2019-2031
- 8.1. Market Analysis, Insights and Forecast - by Product
- 8.1.1. Open System Breast Pump
- 8.1.2. Closed System Breast Pump
- 8.2. Market Analysis, Insights and Forecast - by Technology
- 8.2.1. Manual Breast Pump
- 8.2.2. Battery Powered Breast Pump
- 8.2.3. Electric Breast Pump
- 8.3. Market Analysis, Insights and Forecast - by Application
- 8.3.1. Personal Use
- 8.3.2. Hospital Grade
- 8.1. Market Analysis, Insights and Forecast - by Product
- 9. Middle East and Africa Electric Breast Pumps Market Analysis, Insights and Forecast, 2019-2031
- 9.1. Market Analysis, Insights and Forecast - by Product
- 9.1.1. Open System Breast Pump
- 9.1.2. Closed System Breast Pump
- 9.2. Market Analysis, Insights and Forecast - by Technology
- 9.2.1. Manual Breast Pump
- 9.2.2. Battery Powered Breast Pump
- 9.2.3. Electric Breast Pump
- 9.3. Market Analysis, Insights and Forecast - by Application
- 9.3.1. Personal Use
- 9.3.2. Hospital Grade
- 9.1. Market Analysis, Insights and Forecast - by Product
- 10. South America Electric Breast Pumps Market Analysis, Insights and Forecast, 2019-2031
- 10.1. Market Analysis, Insights and Forecast - by Product
- 10.1.1. Open System Breast Pump
- 10.1.2. Closed System Breast Pump
- 10.2. Market Analysis, Insights and Forecast - by Technology
- 10.2.1. Manual Breast Pump
- 10.2.2. Battery Powered Breast Pump
- 10.2.3. Electric Breast Pump
- 10.3. Market Analysis, Insights and Forecast - by Application
- 10.3.1. Personal Use
- 10.3.2. Hospital Grade
- 10.1. Market Analysis, Insights and Forecast - by Product
- 11. North America Electric Breast Pumps Market Analysis, Insights and Forecast, 2019-2031
- 11.1. Market Analysis, Insights and Forecast - By Country/Sub-region
- 11.1.1 United States
- 11.1.2 Canada
- 11.1.3 Mexico
- 12. Europe Electric Breast Pumps Market Analysis, Insights and Forecast, 2019-2031
- 12.1. Market Analysis, Insights and Forecast - By Country/Sub-region
- 12.1.1 Germany
- 12.1.2 United Kingdom
- 12.1.3 France
- 12.1.4 Italy
- 12.1.5 Spain
- 12.1.6 Rest of Europe
- 13. Asia Pacific Electric Breast Pumps Market Analysis, Insights and Forecast, 2019-2031
- 13.1. Market Analysis, Insights and Forecast - By Country/Sub-region
- 13.1.1 China
- 13.1.2 Japan
- 13.1.3 India
- 13.1.4 Australia
- 13.1.5 South Korea
- 13.1.6 Rest of Asia Pacific
- 14. Middle East and Africa Electric Breast Pumps Market Analysis, Insights and Forecast, 2019-2031
- 14.1. Market Analysis, Insights and Forecast - By Country/Sub-region
- 14.1.1 GCC
- 14.1.2 South Africa
- 14.1.3 Rest of Middle East and Africa
- 15. South America Electric Breast Pumps Market Analysis, Insights and Forecast, 2019-2031
- 15.1. Market Analysis, Insights and Forecast - By Country/Sub-region
- 15.1.1 Brazil
- 15.1.2 Argentina
- 15.1.3 Rest of South America
- 16. Competitive Analysis
- 16.1. Global Market Share Analysis 2024
- 16.2. Company Profiles
- 16.2.1 Acewin Co Ltd
- 16.2.1.1. Overview
- 16.2.1.2. Products
- 16.2.1.3. SWOT Analysis
- 16.2.1.4. Recent Developments
- 16.2.1.5. Financials (Based on Availability)
- 16.2.2 Pigeon Corporation (Lansinoh Laboratories Inc )
- 16.2.2.1. Overview
- 16.2.2.2. Products
- 16.2.2.3. SWOT Analysis
- 16.2.2.4. Recent Developments
- 16.2.2.5. Financials (Based on Availability)
- 16.2.3 Medela AG
- 16.2.3.1. Overview
- 16.2.3.2. Products
- 16.2.3.3. SWOT Analysis
- 16.2.3.4. Recent Developments
- 16.2.3.5. Financials (Based on Availability)
- 16.2.4 Freemie
- 16.2.4.1. Overview
- 16.2.4.2. Products
- 16.2.4.3. SWOT Analysis
- 16.2.4.4. Recent Developments
- 16.2.4.5. Financials (Based on Availability)
- 16.2.5 Mayborn Group
- 16.2.5.1. Overview
- 16.2.5.2. Products
- 16.2.5.3. SWOT Analysis
- 16.2.5.4. Recent Developments
- 16.2.5.5. Financials (Based on Availability)
- 16.2.6 Bailey Medical
- 16.2.6.1. Overview
- 16.2.6.2. Products
- 16.2.6.3. SWOT Analysis
- 16.2.6.4. Recent Developments
- 16.2.6.5. Financials (Based on Availability)
- 16.2.7 Ameda AG
- 16.2.7.1. Overview
- 16.2.7.2. Products
- 16.2.7.3. SWOT Analysis
- 16.2.7.4. Recent Developments
- 16.2.7.5. Financials (Based on Availability)
- 16.2.8 Linco Baby Merchandise Works Co Ltd
- 16.2.8.1. Overview
- 16.2.8.2. Products
- 16.2.8.3. SWOT Analysis
- 16.2.8.4. Recent Developments
- 16.2.8.5. Financials (Based on Availability)
- 16.2.9 Hygeia
- 16.2.9.1. Overview
- 16.2.9.2. Products
- 16.2.9.3. SWOT Analysis
- 16.2.9.4. Recent Developments
- 16.2.9.5. Financials (Based on Availability)
- 16.2.10 Koninklijke Philips NV
- 16.2.10.1. Overview
- 16.2.10.2. Products
- 16.2.10.3. SWOT Analysis
- 16.2.10.4. Recent Developments
- 16.2.10.5. Financials (Based on Availability)
- 16.2.11 Willow Innovations Inc
- 16.2.11.1. Overview
- 16.2.11.2. Products
- 16.2.11.3. SWOT Analysis
- 16.2.11.4. Recent Developments
- 16.2.11.5. Financials (Based on Availability)
- 16.2.12 Ardo Medical AG
- 16.2.12.1. Overview
- 16.2.12.2. Products
- 16.2.12.3. SWOT Analysis
- 16.2.12.4. Recent Developments
- 16.2.12.5. Financials (Based on Availability)
- 16.2.13 Albert Hohlkorper GmbH & Co Kg
- 16.2.13.1. Overview
- 16.2.13.2. Products
- 16.2.13.3. SWOT Analysis
- 16.2.13.4. Recent Developments
- 16.2.13.5. Financials (Based on Availability)
- 16.2.1 Acewin Co Ltd
List of Figures
- Figure 1: Global Electric Breast Pumps Market Revenue Breakdown (Million, %) by Region 2024 & 2032
- Figure 2: Global Electric Breast Pumps Market Volume Breakdown (K Unit, %) by Region 2024 & 2032
- Figure 3: North America Electric Breast Pumps Market Revenue (Million), by Country 2024 & 2032
- Figure 4: North America Electric Breast Pumps Market Volume (K Unit), by Country 2024 & 2032
- Figure 5: North America Electric Breast Pumps Market Revenue Share (%), by Country 2024 & 2032
- Figure 6: North America Electric Breast Pumps Market Volume Share (%), by Country 2024 & 2032
- Figure 7: Europe Electric Breast Pumps Market Revenue (Million), by Country 2024 & 2032
- Figure 8: Europe Electric Breast Pumps Market Volume (K Unit), by Country 2024 & 2032
- Figure 9: Europe Electric Breast Pumps Market Revenue Share (%), by Country 2024 & 2032
- Figure 10: Europe Electric Breast Pumps Market Volume Share (%), by Country 2024 & 2032
- Figure 11: Asia Pacific Electric Breast Pumps Market Revenue (Million), by Country 2024 & 2032
- Figure 12: Asia Pacific Electric Breast Pumps Market Volume (K Unit), by Country 2024 & 2032
- Figure 13: Asia Pacific Electric Breast Pumps Market Revenue Share (%), by Country 2024 & 2032
- Figure 14: Asia Pacific Electric Breast Pumps Market Volume Share (%), by Country 2024 & 2032
- Figure 15: Middle East and Africa Electric Breast Pumps Market Revenue (Million), by Country 2024 & 2032
- Figure 16: Middle East and Africa Electric Breast Pumps Market Volume (K Unit), by Country 2024 & 2032
- Figure 17: Middle East and Africa Electric Breast Pumps Market Revenue Share (%), by Country 2024 & 2032
- Figure 18: Middle East and Africa Electric Breast Pumps Market Volume Share (%), by Country 2024 & 2032
- Figure 19: South America Electric Breast Pumps Market Revenue (Million), by Country 2024 & 2032
- Figure 20: South America Electric Breast Pumps Market Volume (K Unit), by Country 2024 & 2032
- Figure 21: South America Electric Breast Pumps Market Revenue Share (%), by Country 2024 & 2032
- Figure 22: South America Electric Breast Pumps Market Volume Share (%), by Country 2024 & 2032
- Figure 23: North America Electric Breast Pumps Market Revenue (Million), by Product 2024 & 2032
- Figure 24: North America Electric Breast Pumps Market Volume (K Unit), by Product 2024 & 2032
- Figure 25: North America Electric Breast Pumps Market Revenue Share (%), by Product 2024 & 2032
- Figure 26: North America Electric Breast Pumps Market Volume Share (%), by Product 2024 & 2032
- Figure 27: North America Electric Breast Pumps Market Revenue (Million), by Technology 2024 & 2032
- Figure 28: North America Electric Breast Pumps Market Volume (K Unit), by Technology 2024 & 2032
- Figure 29: North America Electric Breast Pumps Market Revenue Share (%), by Technology 2024 & 2032
- Figure 30: North America Electric Breast Pumps Market Volume Share (%), by Technology 2024 & 2032
- Figure 31: North America Electric Breast Pumps Market Revenue (Million), by Application 2024 & 2032
- Figure 32: North America Electric Breast Pumps Market Volume (K Unit), by Application 2024 & 2032
- Figure 33: North America Electric Breast Pumps Market Revenue Share (%), by Application 2024 & 2032
- Figure 34: North America Electric Breast Pumps Market Volume Share (%), by Application 2024 & 2032
- Figure 35: North America Electric Breast Pumps Market Revenue (Million), by Country 2024 & 2032
- Figure 36: North America Electric Breast Pumps Market Volume (K Unit), by Country 2024 & 2032
- Figure 37: North America Electric Breast Pumps Market Revenue Share (%), by Country 2024 & 2032
- Figure 38: North America Electric Breast Pumps Market Volume Share (%), by Country 2024 & 2032
- Figure 39: Europe Electric Breast Pumps Market Revenue (Million), by Product 2024 & 2032
- Figure 40: Europe Electric Breast Pumps Market Volume (K Unit), by Product 2024 & 2032
- Figure 41: Europe Electric Breast Pumps Market Revenue Share (%), by Product 2024 & 2032
- Figure 42: Europe Electric Breast Pumps Market Volume Share (%), by Product 2024 & 2032
- Figure 43: Europe Electric Breast Pumps Market Revenue (Million), by Technology 2024 & 2032
- Figure 44: Europe Electric Breast Pumps Market Volume (K Unit), by Technology 2024 & 2032
- Figure 45: Europe Electric Breast Pumps Market Revenue Share (%), by Technology 2024 & 2032
- Figure 46: Europe Electric Breast Pumps Market Volume Share (%), by Technology 2024 & 2032
- Figure 47: Europe Electric Breast Pumps Market Revenue (Million), by Application 2024 & 2032
- Figure 48: Europe Electric Breast Pumps Market Volume (K Unit), by Application 2024 & 2032
- Figure 49: Europe Electric Breast Pumps Market Revenue Share (%), by Application 2024 & 2032
- Figure 50: Europe Electric Breast Pumps Market Volume Share (%), by Application 2024 & 2032
- Figure 51: Europe Electric Breast Pumps Market Revenue (Million), by Country 2024 & 2032
- Figure 52: Europe Electric Breast Pumps Market Volume (K Unit), by Country 2024 & 2032
- Figure 53: Europe Electric Breast Pumps Market Revenue Share (%), by Country 2024 & 2032
- Figure 54: Europe Electric Breast Pumps Market Volume Share (%), by Country 2024 & 2032
- Figure 55: Asia Pacific Electric Breast Pumps Market Revenue (Million), by Product 2024 & 2032
- Figure 56: Asia Pacific Electric Breast Pumps Market Volume (K Unit), by Product 2024 & 2032
- Figure 57: Asia Pacific Electric Breast Pumps Market Revenue Share (%), by Product 2024 & 2032
- Figure 58: Asia Pacific Electric Breast Pumps Market Volume Share (%), by Product 2024 & 2032
- Figure 59: Asia Pacific Electric Breast Pumps Market Revenue (Million), by Technology 2024 & 2032
- Figure 60: Asia Pacific Electric Breast Pumps Market Volume (K Unit), by Technology 2024 & 2032
- Figure 61: Asia Pacific Electric Breast Pumps Market Revenue Share (%), by Technology 2024 & 2032
- Figure 62: Asia Pacific Electric Breast Pumps Market Volume Share (%), by Technology 2024 & 2032
- Figure 63: Asia Pacific Electric Breast Pumps Market Revenue (Million), by Application 2024 & 2032
- Figure 64: Asia Pacific Electric Breast Pumps Market Volume (K Unit), by Application 2024 & 2032
- Figure 65: Asia Pacific Electric Breast Pumps Market Revenue Share (%), by Application 2024 & 2032
- Figure 66: Asia Pacific Electric Breast Pumps Market Volume Share (%), by Application 2024 & 2032
- Figure 67: Asia Pacific Electric Breast Pumps Market Revenue (Million), by Country 2024 & 2032
- Figure 68: Asia Pacific Electric Breast Pumps Market Volume (K Unit), by Country 2024 & 2032
- Figure 69: Asia Pacific Electric Breast Pumps Market Revenue Share (%), by Country 2024 & 2032
- Figure 70: Asia Pacific Electric Breast Pumps Market Volume Share (%), by Country 2024 & 2032
- Figure 71: Middle East and Africa Electric Breast Pumps Market Revenue (Million), by Product 2024 & 2032
- Figure 72: Middle East and Africa Electric Breast Pumps Market Volume (K Unit), by Product 2024 & 2032
- Figure 73: Middle East and Africa Electric Breast Pumps Market Revenue Share (%), by Product 2024 & 2032
- Figure 74: Middle East and Africa Electric Breast Pumps Market Volume Share (%), by Product 2024 & 2032
- Figure 75: Middle East and Africa Electric Breast Pumps Market Revenue (Million), by Technology 2024 & 2032
- Figure 76: Middle East and Africa Electric Breast Pumps Market Volume (K Unit), by Technology 2024 & 2032
- Figure 77: Middle East and Africa Electric Breast Pumps Market Revenue Share (%), by Technology 2024 & 2032
- Figure 78: Middle East and Africa Electric Breast Pumps Market Volume Share (%), by Technology 2024 & 2032
- Figure 79: Middle East and Africa Electric Breast Pumps Market Revenue (Million), by Application 2024 & 2032
- Figure 80: Middle East and Africa Electric Breast Pumps Market Volume (K Unit), by Application 2024 & 2032
- Figure 81: Middle East and Africa Electric Breast Pumps Market Revenue Share (%), by Application 2024 & 2032
- Figure 82: Middle East and Africa Electric Breast Pumps Market Volume Share (%), by Application 2024 & 2032
- Figure 83: Middle East and Africa Electric Breast Pumps Market Revenue (Million), by Country 2024 & 2032
- Figure 84: Middle East and Africa Electric Breast Pumps Market Volume (K Unit), by Country 2024 & 2032
- Figure 85: Middle East and Africa Electric Breast Pumps Market Revenue Share (%), by Country 2024 & 2032
- Figure 86: Middle East and Africa Electric Breast Pumps Market Volume Share (%), by Country 2024 & 2032
- Figure 87: South America Electric Breast Pumps Market Revenue (Million), by Product 2024 & 2032
- Figure 88: South America Electric Breast Pumps Market Volume (K Unit), by Product 2024 & 2032
- Figure 89: South America Electric Breast Pumps Market Revenue Share (%), by Product 2024 & 2032
- Figure 90: South America Electric Breast Pumps Market Volume Share (%), by Product 2024 & 2032
- Figure 91: South America Electric Breast Pumps Market Revenue (Million), by Technology 2024 & 2032
- Figure 92: South America Electric Breast Pumps Market Volume (K Unit), by Technology 2024 & 2032
- Figure 93: South America Electric Breast Pumps Market Revenue Share (%), by Technology 2024 & 2032
- Figure 94: South America Electric Breast Pumps Market Volume Share (%), by Technology 2024 & 2032
- Figure 95: South America Electric Breast Pumps Market Revenue (Million), by Application 2024 & 2032
- Figure 96: South America Electric Breast Pumps Market Volume (K Unit), by Application 2024 & 2032
- Figure 97: South America Electric Breast Pumps Market Revenue Share (%), by Application 2024 & 2032
- Figure 98: South America Electric Breast Pumps Market Volume Share (%), by Application 2024 & 2032
- Figure 99: South America Electric Breast Pumps Market Revenue (Million), by Country 2024 & 2032
- Figure 100: South America Electric Breast Pumps Market Volume (K Unit), by Country 2024 & 2032
- Figure 101: South America Electric Breast Pumps Market Revenue Share (%), by Country 2024 & 2032
- Figure 102: South America Electric Breast Pumps Market Volume Share (%), by Country 2024 & 2032
List of Tables
- Table 1: Global Electric Breast Pumps Market Revenue Million Forecast, by Region 2019 & 2032
- Table 2: Global Electric Breast Pumps Market Volume K Unit Forecast, by Region 2019 & 2032
- Table 3: Global Electric Breast Pumps Market Revenue Million Forecast, by Product 2019 & 2032
- Table 4: Global Electric Breast Pumps Market Volume K Unit Forecast, by Product 2019 & 2032
- Table 5: Global Electric Breast Pumps Market Revenue Million Forecast, by Technology 2019 & 2032
- Table 6: Global Electric Breast Pumps Market Volume K Unit Forecast, by Technology 2019 & 2032
- Table 7: Global Electric Breast Pumps Market Revenue Million Forecast, by Application 2019 & 2032
- Table 8: Global Electric Breast Pumps Market Volume K Unit Forecast, by Application 2019 & 2032
- Table 9: Global Electric Breast Pumps Market Revenue Million Forecast, by Region 2019 & 2032
- Table 10: Global Electric Breast Pumps Market Volume K Unit Forecast, by Region 2019 & 2032
- Table 11: Global Electric Breast Pumps Market Revenue Million Forecast, by Country 2019 & 2032
- Table 12: Global Electric Breast Pumps Market Volume K Unit Forecast, by Country 2019 & 2032
- Table 13: United States Electric Breast Pumps Market Revenue (Million) Forecast, by Application 2019 & 2032
- Table 14: United States Electric Breast Pumps Market Volume (K Unit) Forecast, by Application 2019 & 2032
- Table 15: Canada Electric Breast Pumps Market Revenue (Million) Forecast, by Application 2019 & 2032
- Table 16: Canada Electric Breast Pumps Market Volume (K Unit) Forecast, by Application 2019 & 2032
- Table 17: Mexico Electric Breast Pumps Market Revenue (Million) Forecast, by Application 2019 & 2032
- Table 18: Mexico Electric Breast Pumps Market Volume (K Unit) Forecast, by Application 2019 & 2032
- Table 19: Global Electric Breast Pumps Market Revenue Million Forecast, by Country 2019 & 2032
- Table 20: Global Electric Breast Pumps Market Volume K Unit Forecast, by Country 2019 & 2032
- Table 21: Germany Electric Breast Pumps Market Revenue (Million) Forecast, by Application 2019 & 2032
- Table 22: Germany Electric Breast Pumps Market Volume (K Unit) Forecast, by Application 2019 & 2032
- Table 23: United Kingdom Electric Breast Pumps Market Revenue (Million) Forecast, by Application 2019 & 2032
- Table 24: United Kingdom Electric Breast Pumps Market Volume (K Unit) Forecast, by Application 2019 & 2032
- Table 25: France Electric Breast Pumps Market Revenue (Million) Forecast, by Application 2019 & 2032
- Table 26: France Electric Breast Pumps Market Volume (K Unit) Forecast, by Application 2019 & 2032
- Table 27: Italy Electric Breast Pumps Market Revenue (Million) Forecast, by Application 2019 & 2032
- Table 28: Italy Electric Breast Pumps Market Volume (K Unit) Forecast, by Application 2019 & 2032
- Table 29: Spain Electric Breast Pumps Market Revenue (Million) Forecast, by Application 2019 & 2032
- Table 30: Spain Electric Breast Pumps Market Volume (K Unit) Forecast, by Application 2019 & 2032
- Table 31: Rest of Europe Electric Breast Pumps Market Revenue (Million) Forecast, by Application 2019 & 2032
- Table 32: Rest of Europe Electric Breast Pumps Market Volume (K Unit) Forecast, by Application 2019 & 2032
- Table 33: Global Electric Breast Pumps Market Revenue Million Forecast, by Country 2019 & 2032
- Table 34: Global Electric Breast Pumps Market Volume K Unit Forecast, by Country 2019 & 2032
- Table 35: China Electric Breast Pumps Market Revenue (Million) Forecast, by Application 2019 & 2032
- Table 36: China Electric Breast Pumps Market Volume (K Unit) Forecast, by Application 2019 & 2032
- Table 37: Japan Electric Breast Pumps Market Revenue (Million) Forecast, by Application 2019 & 2032
- Table 38: Japan Electric Breast Pumps Market Volume (K Unit) Forecast, by Application 2019 & 2032
- Table 39: India Electric Breast Pumps Market Revenue (Million) Forecast, by Application 2019 & 2032
- Table 40: India Electric Breast Pumps Market Volume (K Unit) Forecast, by Application 2019 & 2032
- Table 41: Australia Electric Breast Pumps Market Revenue (Million) Forecast, by Application 2019 & 2032
- Table 42: Australia Electric Breast Pumps Market Volume (K Unit) Forecast, by Application 2019 & 2032
- Table 43: South Korea Electric Breast Pumps Market Revenue (Million) Forecast, by Application 2019 & 2032
- Table 44: South Korea Electric Breast Pumps Market Volume (K Unit) Forecast, by Application 2019 & 2032
- Table 45: Rest of Asia Pacific Electric Breast Pumps Market Revenue (Million) Forecast, by Application 2019 & 2032
- Table 46: Rest of Asia Pacific Electric Breast Pumps Market Volume (K Unit) Forecast, by Application 2019 & 2032
- Table 47: Global Electric Breast Pumps Market Revenue Million Forecast, by Country 2019 & 2032
- Table 48: Global Electric Breast Pumps Market Volume K Unit Forecast, by Country 2019 & 2032
- Table 49: GCC Electric Breast Pumps Market Revenue (Million) Forecast, by Application 2019 & 2032
- Table 50: GCC Electric Breast Pumps Market Volume (K Unit) Forecast, by Application 2019 & 2032
- Table 51: South Africa Electric Breast Pumps Market Revenue (Million) Forecast, by Application 2019 & 2032
- Table 52: South Africa Electric Breast Pumps Market Volume (K Unit) Forecast, by Application 2019 & 2032
- Table 53: Rest of Middle East and Africa Electric Breast Pumps Market Revenue (Million) Forecast, by Application 2019 & 2032
- Table 54: Rest of Middle East and Africa Electric Breast Pumps Market Volume (K Unit) Forecast, by Application 2019 & 2032
- Table 55: Global Electric Breast Pumps Market Revenue Million Forecast, by Country 2019 & 2032
- Table 56: Global Electric Breast Pumps Market Volume K Unit Forecast, by Country 2019 & 2032
- Table 57: Brazil Electric Breast Pumps Market Revenue (Million) Forecast, by Application 2019 & 2032
- Table 58: Brazil Electric Breast Pumps Market Volume (K Unit) Forecast, by Application 2019 & 2032
- Table 59: Argentina Electric Breast Pumps Market Revenue (Million) Forecast, by Application 2019 & 2032
- Table 60: Argentina Electric Breast Pumps Market Volume (K Unit) Forecast, by Application 2019 & 2032
- Table 61: Rest of South America Electric Breast Pumps Market Revenue (Million) Forecast, by Application 2019 & 2032
- Table 62: Rest of South America Electric Breast Pumps Market Volume (K Unit) Forecast, by Application 2019 & 2032
- Table 63: Global Electric Breast Pumps Market Revenue Million Forecast, by Product 2019 & 2032
- Table 64: Global Electric Breast Pumps Market Volume K Unit Forecast, by Product 2019 & 2032
- Table 65: Global Electric Breast Pumps Market Revenue Million Forecast, by Technology 2019 & 2032
- Table 66: Global Electric Breast Pumps Market Volume K Unit Forecast, by Technology 2019 & 2032
- Table 67: Global Electric Breast Pumps Market Revenue Million Forecast, by Application 2019 & 2032
- Table 68: Global Electric Breast Pumps Market Volume K Unit Forecast, by Application 2019 & 2032
- Table 69: Global Electric Breast Pumps Market Revenue Million Forecast, by Country 2019 & 2032
- Table 70: Global Electric Breast Pumps Market Volume K Unit Forecast, by Country 2019 & 2032
- Table 71: United States Electric Breast Pumps Market Revenue (Million) Forecast, by Application 2019 & 2032
- Table 72: United States Electric Breast Pumps Market Volume (K Unit) Forecast, by Application 2019 & 2032
- Table 73: Canada Electric Breast Pumps Market Revenue (Million) Forecast, by Application 2019 & 2032
- Table 74: Canada Electric Breast Pumps Market Volume (K Unit) Forecast, by Application 2019 & 2032
- Table 75: Mexico Electric Breast Pumps Market Revenue (Million) Forecast, by Application 2019 & 2032
- Table 76: Mexico Electric Breast Pumps Market Volume (K Unit) Forecast, by Application 2019 & 2032
- Table 77: Global Electric Breast Pumps Market Revenue Million Forecast, by Product 2019 & 2032
- Table 78: Global Electric Breast Pumps Market Volume K Unit Forecast, by Product 2019 & 2032
- Table 79: Global Electric Breast Pumps Market Revenue Million Forecast, by Technology 2019 & 2032
- Table 80: Global Electric Breast Pumps Market Volume K Unit Forecast, by Technology 2019 & 2032
- Table 81: Global Electric Breast Pumps Market Revenue Million Forecast, by Application 2019 & 2032
- Table 82: Global Electric Breast Pumps Market Volume K Unit Forecast, by Application 2019 & 2032
- Table 83: Global Electric Breast Pumps Market Revenue Million Forecast, by Country 2019 & 2032
- Table 84: Global Electric Breast Pumps Market Volume K Unit Forecast, by Country 2019 & 2032
- Table 85: Germany Electric Breast Pumps Market Revenue (Million) Forecast, by Application 2019 & 2032
- Table 86: Germany Electric Breast Pumps Market Volume (K Unit) Forecast, by Application 2019 & 2032
- Table 87: United Kingdom Electric Breast Pumps Market Revenue (Million) Forecast, by Application 2019 & 2032
- Table 88: United Kingdom Electric Breast Pumps Market Volume (K Unit) Forecast, by Application 2019 & 2032
- Table 89: France Electric Breast Pumps Market Revenue (Million) Forecast, by Application 2019 & 2032
- Table 90: France Electric Breast Pumps Market Volume (K Unit) Forecast, by Application 2019 & 2032
- Table 91: Italy Electric Breast Pumps Market Revenue (Million) Forecast, by Application 2019 & 2032
- Table 92: Italy Electric Breast Pumps Market Volume (K Unit) Forecast, by Application 2019 & 2032
- Table 93: Spain Electric Breast Pumps Market Revenue (Million) Forecast, by Application 2019 & 2032
- Table 94: Spain Electric Breast Pumps Market Volume (K Unit) Forecast, by Application 2019 & 2032
- Table 95: Rest of Europe Electric Breast Pumps Market Revenue (Million) Forecast, by Application 2019 & 2032
- Table 96: Rest of Europe Electric Breast Pumps Market Volume (K Unit) Forecast, by Application 2019 & 2032
- Table 97: Global Electric Breast Pumps Market Revenue Million Forecast, by Product 2019 & 2032
- Table 98: Global Electric Breast Pumps Market Volume K Unit Forecast, by Product 2019 & 2032
- Table 99: Global Electric Breast Pumps Market Revenue Million Forecast, by Technology 2019 & 2032
- Table 100: Global Electric Breast Pumps Market Volume K Unit Forecast, by Technology 2019 & 2032
- Table 101: Global Electric Breast Pumps Market Revenue Million Forecast, by Application 2019 & 2032
- Table 102: Global Electric Breast Pumps Market Volume K Unit Forecast, by Application 2019 & 2032
- Table 103: Global Electric Breast Pumps Market Revenue Million Forecast, by Country 2019 & 2032
- Table 104: Global Electric Breast Pumps Market Volume K Unit Forecast, by Country 2019 & 2032
- Table 105: China Electric Breast Pumps Market Revenue (Million) Forecast, by Application 2019 & 2032
- Table 106: China Electric Breast Pumps Market Volume (K Unit) Forecast, by Application 2019 & 2032
- Table 107: Japan Electric Breast Pumps Market Revenue (Million) Forecast, by Application 2019 & 2032
- Table 108: Japan Electric Breast Pumps Market Volume (K Unit) Forecast, by Application 2019 & 2032
- Table 109: India Electric Breast Pumps Market Revenue (Million) Forecast, by Application 2019 & 2032
- Table 110: India Electric Breast Pumps Market Volume (K Unit) Forecast, by Application 2019 & 2032
- Table 111: Australia Electric Breast Pumps Market Revenue (Million) Forecast, by Application 2019 & 2032
- Table 112: Australia Electric Breast Pumps Market Volume (K Unit) Forecast, by Application 2019 & 2032
- Table 113: South Korea Electric Breast Pumps Market Revenue (Million) Forecast, by Application 2019 & 2032
- Table 114: South Korea Electric Breast Pumps Market Volume (K Unit) Forecast, by Application 2019 & 2032
- Table 115: Rest of Asia Pacific Electric Breast Pumps Market Revenue (Million) Forecast, by Application 2019 & 2032
- Table 116: Rest of Asia Pacific Electric Breast Pumps Market Volume (K Unit) Forecast, by Application 2019 & 2032
- Table 117: Global Electric Breast Pumps Market Revenue Million Forecast, by Product 2019 & 2032
- Table 118: Global Electric Breast Pumps Market Volume K Unit Forecast, by Product 2019 & 2032
- Table 119: Global Electric Breast Pumps Market Revenue Million Forecast, by Technology 2019 & 2032
- Table 120: Global Electric Breast Pumps Market Volume K Unit Forecast, by Technology 2019 & 2032
- Table 121: Global Electric Breast Pumps Market Revenue Million Forecast, by Application 2019 & 2032
- Table 122: Global Electric Breast Pumps Market Volume K Unit Forecast, by Application 2019 & 2032
- Table 123: Global Electric Breast Pumps Market Revenue Million Forecast, by Country 2019 & 2032
- Table 124: Global Electric Breast Pumps Market Volume K Unit Forecast, by Country 2019 & 2032
- Table 125: GCC Electric Breast Pumps Market Revenue (Million) Forecast, by Application 2019 & 2032
- Table 126: GCC Electric Breast Pumps Market Volume (K Unit) Forecast, by Application 2019 & 2032
- Table 127: South Africa Electric Breast Pumps Market Revenue (Million) Forecast, by Application 2019 & 2032
- Table 128: South Africa Electric Breast Pumps Market Volume (K Unit) Forecast, by Application 2019 & 2032
- Table 129: Rest of Middle East and Africa Electric Breast Pumps Market Revenue (Million) Forecast, by Application 2019 & 2032
- Table 130: Rest of Middle East and Africa Electric Breast Pumps Market Volume (K Unit) Forecast, by Application 2019 & 2032
- Table 131: Global Electric Breast Pumps Market Revenue Million Forecast, by Product 2019 & 2032
- Table 132: Global Electric Breast Pumps Market Volume K Unit Forecast, by Product 2019 & 2032
- Table 133: Global Electric Breast Pumps Market Revenue Million Forecast, by Technology 2019 & 2032
- Table 134: Global Electric Breast Pumps Market Volume K Unit Forecast, by Technology 2019 & 2032
- Table 135: Global Electric Breast Pumps Market Revenue Million Forecast, by Application 2019 & 2032
- Table 136: Global Electric Breast Pumps Market Volume K Unit Forecast, by Application 2019 & 2032
- Table 137: Global Electric Breast Pumps Market Revenue Million Forecast, by Country 2019 & 2032
- Table 138: Global Electric Breast Pumps Market Volume K Unit Forecast, by Country 2019 & 2032
- Table 139: Brazil Electric Breast Pumps Market Revenue (Million) Forecast, by Application 2019 & 2032
- Table 140: Brazil Electric Breast Pumps Market Volume (K Unit) Forecast, by Application 2019 & 2032
- Table 141: Argentina Electric Breast Pumps Market Revenue (Million) Forecast, by Application 2019 & 2032
- Table 142: Argentina Electric Breast Pumps Market Volume (K Unit) Forecast, by Application 2019 & 2032
- Table 143: Rest of South America Electric Breast Pumps Market Revenue (Million) Forecast, by Application 2019 & 2032
- Table 144: Rest of South America Electric Breast Pumps Market Volume (K Unit) Forecast, by Application 2019 & 2032
Frequently Asked Questions
1. What is the projected Compound Annual Growth Rate (CAGR) of the Electric Breast Pumps Market?
The projected CAGR is approximately 8.50%.
2. Which companies are prominent players in the Electric Breast Pumps Market?
Key companies in the market include Acewin Co Ltd, Pigeon Corporation (Lansinoh Laboratories Inc ), Medela AG, Freemie, Mayborn Group, Bailey Medical, Ameda AG, Linco Baby Merchandise Works Co Ltd, Hygeia, Koninklijke Philips NV, Willow Innovations Inc, Ardo Medical AG, Albert Hohlkorper GmbH & Co Kg.
3. What are the main segments of the Electric Breast Pumps Market?
The market segments include Product, Technology, Application.
4. Can you provide details about the market size?
The market size is estimated to be USD XX Million as of 2022.
5. What are some drivers contributing to market growth?
Increasing Global Women Employment Rates; Improving Healthcare Infrastructure in Emerging Economies; Government Initiatives in Support of Employed Mothers.
6. What are the notable trends driving market growth?
The Closed System Breast Pumps Segment is Expected to Hold a Significant Market Share Over the Forecast Period.
7. Are there any restraints impacting market growth?
High Prices of Breast Pumps.
8. Can you provide examples of recent developments in the market?
In April 2022, Ardo Medical, Inc., announced the launch of the Ardo Alyssa breast pump with 250 mmHG double pumping. It is a hospital-grade breast pump with NICU capabilities.
9. What pricing options are available for accessing the report?
Pricing options include single-user, multi-user, and enterprise licenses priced at USD 4750, USD 5250, and USD 8750 respectively.
10. Is the market size provided in terms of value or volume?
The market size is provided in terms of value, measured in Million and volume, measured in K Unit.
11. Are there any specific market keywords associated with the report?
Yes, the market keyword associated with the report is "Electric Breast Pumps Market," which aids in identifying and referencing the specific market segment covered.
12. How do I determine which pricing option suits my needs best?
The pricing options vary based on user requirements and access needs. Individual users may opt for single-user licenses, while businesses requiring broader access may choose multi-user or enterprise licenses for cost-effective access to the report.
13. Are there any additional resources or data provided in the Electric Breast Pumps Market report?
While the report offers comprehensive insights, it's advisable to review the specific contents or supplementary materials provided to ascertain if additional resources or data are available.
14. How can I stay updated on further developments or reports in the Electric Breast Pumps Market?
To stay informed about further developments, trends, and reports in the Electric Breast Pumps Market, consider subscribing to industry newsletters, following relevant companies and organizations, or regularly checking reputable industry news sources and publications.
Methodology
Step 1 - Identification of Relevant Samples Size from Population Database


Step 2 - Approaches for Defining Global Market Size (Value, Volume* & Price*)

Note*: In applicable scenarios
Step 3 - Data Sources
Primary Research
- Web Analytics
- Survey Reports
- Research Institute
- Latest Research Reports
- Opinion Leaders
Secondary Research
- Annual Reports
- White Paper
- Latest Press Release
- Industry Association
- Paid Database
- Investor Presentations

Step 4 - Data Triangulation
Involves using different sources of information in order to increase the validity of a study
These sources are likely to be stakeholders in a program - participants, other researchers, program staff, other community members, and so on.
Then we put all data in single framework & apply various statistical tools to find out the dynamic on the market.
During the analysis stage, feedback from the stakeholder groups would be compared to determine areas of agreement as well as areas of divergence


