
Key Insights
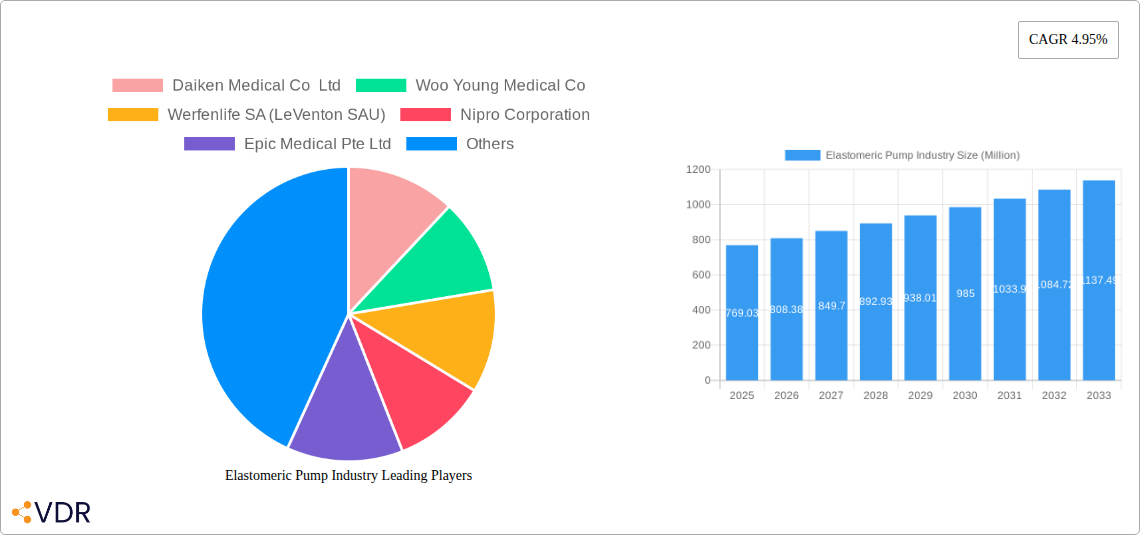
The elastomeric pump market, valued at $769.03 million in 2025, is projected to experience robust growth, driven by a rising geriatric population requiring frequent medication administration and an increasing prevalence of chronic diseases necessitating consistent drug delivery. Hospitals and ambulatory surgical centers are major end-users, favoring elastomeric pumps for their portability, ease of use, and cost-effectiveness compared to electronic infusion pumps, particularly in outpatient settings and home healthcare. The market segmentation reveals a strong preference for continuous rate elastomeric infusion pumps, largely due to their simplicity and suitability for routine medication delivery. Pain management and chemotherapy applications dominate the market share, reflecting the high volume of patients requiring these therapies. However, the market also faces challenges; stringent regulatory requirements for medical devices and potential price sensitivity in emerging markets pose restraints to growth. The industry is likely to witness innovation in pump design, focusing on improved drug delivery precision, enhanced safety features, and wireless monitoring capabilities. Competition among established players like Baxter International Inc, B. Braun Melsungen AG, and Smiths Medical Inc, alongside emerging players, will drive further innovation and market expansion.
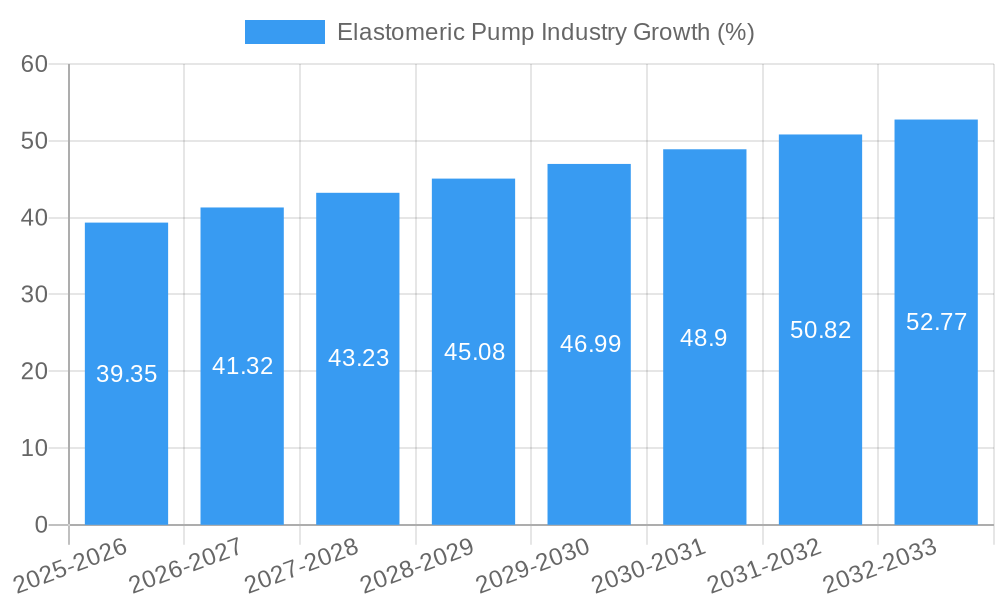
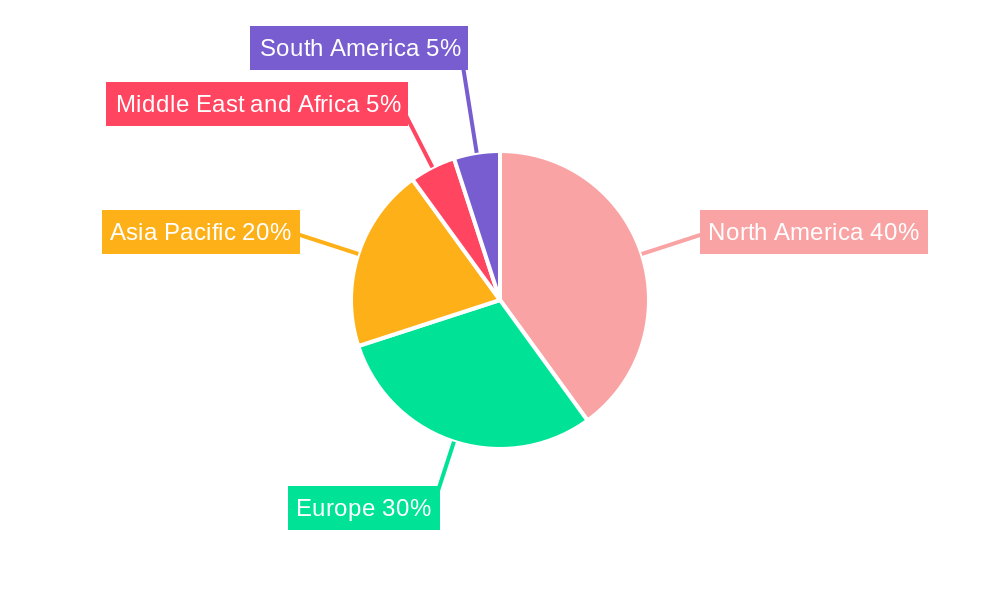
The projected CAGR of 4.95% suggests a steady, albeit not explosive, growth trajectory over the forecast period (2025-2033). This moderate growth rate aligns with the overall healthcare market trends, reflecting the gradual but consistent adoption of elastomeric pumps across various healthcare settings. Geographic expansion, particularly in Asia Pacific and the Middle East & Africa regions, represents a key growth opportunity, fueled by increasing healthcare spending and improved healthcare infrastructure in these regions. Further market penetration within existing segments, along with exploration of new applications (e.g., specialized drug delivery outside of chemotherapy and pain management), are likely to fuel market expansion. The consistent demand from established markets in North America and Europe, coupled with emerging market opportunities, positions the elastomeric pump market for sustained growth in the coming years.
Elastomeric Pump Industry Market Report: 2019-2033
This comprehensive report provides a detailed analysis of the Elastomeric Pump industry, encompassing market dynamics, growth trends, regional segmentation, product landscape, key players, and future outlook. The study covers the period from 2019 to 2033, with 2025 as the base year. This in-depth analysis is crucial for industry professionals, investors, and strategic decision-makers seeking to navigate this evolving market. The report segments the market by end-user (Hospitals, Ambulatory Surgical Centers, Others), product type (Continuous Rate Elastomeric Infusion Pumps, Variable Rate Elastomeric Infusion Pumps), and application (Pain Management, Chemotherapy, Chelation Therapy, Others).
Elastomeric Pump Industry Market Dynamics & Structure
The global elastomeric pump market exhibits a moderately consolidated structure, with several key players vying for market share. Technological innovation, particularly in areas like improved drug delivery precision and enhanced safety features, is a significant growth driver. Stringent regulatory frameworks, particularly concerning medical device approvals, present both challenges and opportunities. Competition from alternative drug delivery methods and the increasing focus on cost-effectiveness pose some constraints. The market also witnesses ongoing mergers and acquisitions (M&A) activity, as companies strive to expand their product portfolios and geographic reach.
- Market Concentration: Moderately consolidated, with a top 5 market share of approximately XX%.
- Technological Innovation: Focus on miniaturization, wireless connectivity, and improved drug delivery precision.
- Regulatory Landscape: Stringent approval processes in key markets like the US and EU.
- Competitive Substitutes: Syringe pumps, intravenous infusion pumps.
- M&A Activity: An average of XX M&A deals per year during the historical period. (e.g., XX% increase in deal volume between 2022 and 2024).
- End-User Demographics: Shift towards outpatient care is driving demand for portable elastomeric pumps.
Elastomeric Pump Industry Growth Trends & Insights
The elastomeric pump market experienced robust growth during the historical period (2019-2024), driven by factors such as the increasing prevalence of chronic diseases requiring long-term drug administration, advancements in pump technology, and the rising adoption of ambulatory care settings. The market size is projected to reach XX Million units by 2025, exhibiting a CAGR of XX% during the forecast period (2025-2033). This growth is further fueled by the increasing preference for patient-controlled analgesia and the growing adoption of chemotherapy treatments. Technological disruptions, such as the integration of smart features and wireless monitoring capabilities, are expected to enhance market penetration and drive adoption rates. Furthermore, shifting consumer preferences towards convenient and user-friendly drug delivery systems contribute to the overall market expansion. The market is further segmented by types of continuous rate elastomeric infusion pumps and variable rate elastomeric infusion pumps with a forecast on their expected market shares.
Dominant Regions, Countries, or Segments in Elastomeric Pump Industry
North America currently holds the largest market share in the elastomeric pump industry, driven by factors such as high healthcare expenditure, advanced healthcare infrastructure, and a large patient population requiring long-term drug therapy. Europe follows closely, with significant growth potential in emerging economies like Asia-Pacific, where increasing healthcare awareness and expanding healthcare infrastructure are key drivers.
- Leading Region: North America (XX% market share in 2025)
- Key Country: United States (XX% of North America market)
- Dominant End-User Segment: Hospitals (XX% market share)
- Leading Product Type: Continuous Rate Elastomeric Infusion Pumps (XX% market share)
- Primary Application: Pain Management (XX% market share)
- Growth Drivers: Rising prevalence of chronic diseases, increasing healthcare expenditure, technological advancements, and favorable regulatory environment.
Elastomeric Pump Industry Product Landscape
Elastomeric pumps are evolving from basic, single-use devices to sophisticated systems incorporating advanced features like programmable infusion rates, drug delivery alarms, and wireless connectivity for remote monitoring. These improvements enhance patient safety and convenience, improving treatment adherence and reducing the risk of medication errors. Recent innovations focus on miniaturization, improved drug compatibility, and the integration of smart technologies to provide real-time data on infusion progress. The market is witnessing a surge in demand for pumps designed for specific applications, such as chemotherapy and pain management.
Key Drivers, Barriers & Challenges in Elastomeric Pump Industry
Key Drivers:
- Increasing prevalence of chronic diseases requiring continuous medication.
- Growing demand for convenient and portable drug delivery systems.
- Technological advancements resulting in improved accuracy and safety.
- Rising healthcare expenditure and improved healthcare infrastructure in developing countries.
Challenges & Restraints:
- Stringent regulatory approvals and compliance requirements.
- High initial investment costs associated with the adoption of advanced technologies.
- Competition from alternative drug delivery methods, such as intravenous infusion pumps.
- Potential supply chain disruptions impacting production and availability.
Emerging Opportunities in Elastomeric Pump Industry
- Untapped markets in developing economies with growing healthcare needs.
- Development of specialized pumps for niche applications (e.g., ophthalmic drug delivery).
- Integration of smart technologies and remote monitoring capabilities.
- Focus on personalized medicine and drug delivery solutions tailored to individual patient needs.
Growth Accelerators in the Elastomeric Pump Industry
Technological breakthroughs, specifically in areas like advanced materials and smart infusion technology, are significantly boosting market growth. Strategic partnerships between manufacturers and healthcare providers will further propel market expansion. Expansion into untapped regional markets, particularly in developing economies, promises substantial growth opportunities. These combined factors, coupled with the growing demand for improved patient care and efficient drug delivery, create a favorable environment for significant market growth in the coming years.
Key Players Shaping the Elastomeric Pump Industry Market
- Daiken Medical Co Ltd
- Woo Young Medical Co
- Werfenlife SA (LeVenton SAU)
- Nipro Corporation
- Epic Medical Pte Ltd
- Ambu A/s
- Smiths Medical Inc (Smiths Group)
- B Braun Melsungen AG
- Baxter International Inc
- Avanos Medical Inc
Notable Milestones in Elastomeric Pump Industry Sector
- March 2022: Shanghai MicroPort Lifesciences Co., Ltd. receives NMPA approval for its AutoEx Chemotherapy Infusion Pump.
- February 2021: Mindray Medical launches BeneFusion e series infusion systems.
In-Depth Elastomeric Pump Industry Market Outlook
The elastomeric pump market is poised for continued expansion, driven by technological advancements, strategic partnerships, and increasing healthcare expenditure globally. Opportunities exist in developing specialized pumps for niche applications and leveraging smart technologies to enhance patient care. Companies focusing on innovation, regulatory compliance, and market expansion strategies will be best positioned to capitalize on the significant growth potential in the years to come. The market is expected to see a significant increase in the adoption of variable-rate elastomeric infusion pumps due to their increased precision and flexibility.
Elastomeric Pump Industry Segmentation
-
1. Product Type
- 1.1. Continuous Rate Elastomeric Infusion Pumps
- 1.2. Variable Rate Elastomeric Infusion Pumps
-
2. Application
- 2.1. Pain Management
- 2.2. Chemotherapy
- 2.3. Chelation Therapy
- 2.4. Others
-
3. End User
- 3.1. Hospitals
- 3.2. Ambulatory Surgical Centers
- 3.3. Others
Elastomeric Pump Industry Segmentation By Geography
-
1. North America
- 1.1. United States
- 1.2. Canada
- 1.3. Mexico
-
2. Europe
- 2.1. Germany
- 2.2. United Kingdom
- 2.3. France
- 2.4. Italy
- 2.5. Spain
- 2.6. Rest of Europe
-
3. Asia Pacific
- 3.1. China
- 3.2. Japan
- 3.3. India
- 3.4. Australia
- 3.5. South Korea
- 3.6. Rest of Asia Pacific
-
4. Middle East and Africa
- 4.1. GCC
- 4.2. South Africa
- 4.3. Rest of Middle Eastst and Africa
-
5. South America
- 5.1. Brazil
- 5.2. Argentina
- 5.3. Rest of South America
Elastomeric Pump Industry REPORT HIGHLIGHTS
| Aspects | Details |
|---|---|
| Study Period | 2019-2033 |
| Base Year | 2024 |
| Estimated Year | 2025 |
| Forecast Period | 2025-2033 |
| Historical Period | 2019-2024 |
| Growth Rate | CAGR of 4.95% from 2019-2033 |
| Segmentation |
|
Table of Contents
- 1. Introduction
- 1.1. Research Scope
- 1.2. Market Segmentation
- 1.3. Research Methodology
- 1.4. Definitions and Assumptions
- 2. Executive Summary
- 2.1. Introduction
- 3. Market Dynamics
- 3.1. Introduction
- 3.2. Market Drivers
- 3.2.1. Advancements in Device Technologies and Advantages of the Elastomeric Pumps; Growing Burden of Chronic Diseases
- 3.3. Market Restrains
- 3.3.1. Safety Issues and Disadvantages Associated with the Pumps; High Cost in Long-Term Use and Strict Regulations
- 3.4. Market Trends
- 3.4.1. Chemotherapy Segment Expects to Register a High CAGR During the Forecast Period
- 4. Market Factor Analysis
- 4.1. Porters Five Forces
- 4.2. Supply/Value Chain
- 4.3. PESTEL analysis
- 4.4. Market Entropy
- 4.5. Patent/Trademark Analysis
- 5. Global Elastomeric Pump Industry Analysis, Insights and Forecast, 2019-2031
- 5.1. Market Analysis, Insights and Forecast - by Product Type
- 5.1.1. Continuous Rate Elastomeric Infusion Pumps
- 5.1.2. Variable Rate Elastomeric Infusion Pumps
- 5.2. Market Analysis, Insights and Forecast - by Application
- 5.2.1. Pain Management
- 5.2.2. Chemotherapy
- 5.2.3. Chelation Therapy
- 5.2.4. Others
- 5.3. Market Analysis, Insights and Forecast - by End User
- 5.3.1. Hospitals
- 5.3.2. Ambulatory Surgical Centers
- 5.3.3. Others
- 5.4. Market Analysis, Insights and Forecast - by Region
- 5.4.1. North America
- 5.4.2. Europe
- 5.4.3. Asia Pacific
- 5.4.4. Middle East and Africa
- 5.4.5. South America
- 5.1. Market Analysis, Insights and Forecast - by Product Type
- 6. North America Elastomeric Pump Industry Analysis, Insights and Forecast, 2019-2031
- 6.1. Market Analysis, Insights and Forecast - by Product Type
- 6.1.1. Continuous Rate Elastomeric Infusion Pumps
- 6.1.2. Variable Rate Elastomeric Infusion Pumps
- 6.2. Market Analysis, Insights and Forecast - by Application
- 6.2.1. Pain Management
- 6.2.2. Chemotherapy
- 6.2.3. Chelation Therapy
- 6.2.4. Others
- 6.3. Market Analysis, Insights and Forecast - by End User
- 6.3.1. Hospitals
- 6.3.2. Ambulatory Surgical Centers
- 6.3.3. Others
- 6.1. Market Analysis, Insights and Forecast - by Product Type
- 7. Europe Elastomeric Pump Industry Analysis, Insights and Forecast, 2019-2031
- 7.1. Market Analysis, Insights and Forecast - by Product Type
- 7.1.1. Continuous Rate Elastomeric Infusion Pumps
- 7.1.2. Variable Rate Elastomeric Infusion Pumps
- 7.2. Market Analysis, Insights and Forecast - by Application
- 7.2.1. Pain Management
- 7.2.2. Chemotherapy
- 7.2.3. Chelation Therapy
- 7.2.4. Others
- 7.3. Market Analysis, Insights and Forecast - by End User
- 7.3.1. Hospitals
- 7.3.2. Ambulatory Surgical Centers
- 7.3.3. Others
- 7.1. Market Analysis, Insights and Forecast - by Product Type
- 8. Asia Pacific Elastomeric Pump Industry Analysis, Insights and Forecast, 2019-2031
- 8.1. Market Analysis, Insights and Forecast - by Product Type
- 8.1.1. Continuous Rate Elastomeric Infusion Pumps
- 8.1.2. Variable Rate Elastomeric Infusion Pumps
- 8.2. Market Analysis, Insights and Forecast - by Application
- 8.2.1. Pain Management
- 8.2.2. Chemotherapy
- 8.2.3. Chelation Therapy
- 8.2.4. Others
- 8.3. Market Analysis, Insights and Forecast - by End User
- 8.3.1. Hospitals
- 8.3.2. Ambulatory Surgical Centers
- 8.3.3. Others
- 8.1. Market Analysis, Insights and Forecast - by Product Type
- 9. Middle East and Africa Elastomeric Pump Industry Analysis, Insights and Forecast, 2019-2031
- 9.1. Market Analysis, Insights and Forecast - by Product Type
- 9.1.1. Continuous Rate Elastomeric Infusion Pumps
- 9.1.2. Variable Rate Elastomeric Infusion Pumps
- 9.2. Market Analysis, Insights and Forecast - by Application
- 9.2.1. Pain Management
- 9.2.2. Chemotherapy
- 9.2.3. Chelation Therapy
- 9.2.4. Others
- 9.3. Market Analysis, Insights and Forecast - by End User
- 9.3.1. Hospitals
- 9.3.2. Ambulatory Surgical Centers
- 9.3.3. Others
- 9.1. Market Analysis, Insights and Forecast - by Product Type
- 10. South America Elastomeric Pump Industry Analysis, Insights and Forecast, 2019-2031
- 10.1. Market Analysis, Insights and Forecast - by Product Type
- 10.1.1. Continuous Rate Elastomeric Infusion Pumps
- 10.1.2. Variable Rate Elastomeric Infusion Pumps
- 10.2. Market Analysis, Insights and Forecast - by Application
- 10.2.1. Pain Management
- 10.2.2. Chemotherapy
- 10.2.3. Chelation Therapy
- 10.2.4. Others
- 10.3. Market Analysis, Insights and Forecast - by End User
- 10.3.1. Hospitals
- 10.3.2. Ambulatory Surgical Centers
- 10.3.3. Others
- 10.1. Market Analysis, Insights and Forecast - by Product Type
- 11. North America Elastomeric Pump Industry Analysis, Insights and Forecast, 2019-2031
- 11.1. Market Analysis, Insights and Forecast - By Country/Sub-region
- 11.1.1 United States
- 11.1.2 Canada
- 11.1.3 Mexico
- 12. Europe Elastomeric Pump Industry Analysis, Insights and Forecast, 2019-2031
- 12.1. Market Analysis, Insights and Forecast - By Country/Sub-region
- 12.1.1 Germany
- 12.1.2 United Kingdom
- 12.1.3 France
- 12.1.4 Italy
- 12.1.5 Spain
- 12.1.6 Rest of Europe
- 13. Asia Pacific Elastomeric Pump Industry Analysis, Insights and Forecast, 2019-2031
- 13.1. Market Analysis, Insights and Forecast - By Country/Sub-region
- 13.1.1 China
- 13.1.2 Japan
- 13.1.3 India
- 13.1.4 Australia
- 13.1.5 South Korea
- 13.1.6 Rest of Asia Pacific
- 14. Middle East and Africa Elastomeric Pump Industry Analysis, Insights and Forecast, 2019-2031
- 14.1. Market Analysis, Insights and Forecast - By Country/Sub-region
- 14.1.1 GCC
- 14.1.2 South Africa
- 14.1.3 Rest of Middle Eastst and Africa
- 15. South America Elastomeric Pump Industry Analysis, Insights and Forecast, 2019-2031
- 15.1. Market Analysis, Insights and Forecast - By Country/Sub-region
- 15.1.1 Brazil
- 15.1.2 Argentina
- 15.1.3 Rest of South America
- 16. Competitive Analysis
- 16.1. Global Market Share Analysis 2024
- 16.2. Company Profiles
- 16.2.1 Daiken Medical Co Ltd
- 16.2.1.1. Overview
- 16.2.1.2. Products
- 16.2.1.3. SWOT Analysis
- 16.2.1.4. Recent Developments
- 16.2.1.5. Financials (Based on Availability)
- 16.2.2 Woo Young Medical Co
- 16.2.2.1. Overview
- 16.2.2.2. Products
- 16.2.2.3. SWOT Analysis
- 16.2.2.4. Recent Developments
- 16.2.2.5. Financials (Based on Availability)
- 16.2.3 Werfenlife SA (LeVenton SAU)
- 16.2.3.1. Overview
- 16.2.3.2. Products
- 16.2.3.3. SWOT Analysis
- 16.2.3.4. Recent Developments
- 16.2.3.5. Financials (Based on Availability)
- 16.2.4 Nipro Corporation
- 16.2.4.1. Overview
- 16.2.4.2. Products
- 16.2.4.3. SWOT Analysis
- 16.2.4.4. Recent Developments
- 16.2.4.5. Financials (Based on Availability)
- 16.2.5 Epic Medical Pte Ltd
- 16.2.5.1. Overview
- 16.2.5.2. Products
- 16.2.5.3. SWOT Analysis
- 16.2.5.4. Recent Developments
- 16.2.5.5. Financials (Based on Availability)
- 16.2.6 Ambu A/s
- 16.2.6.1. Overview
- 16.2.6.2. Products
- 16.2.6.3. SWOT Analysis
- 16.2.6.4. Recent Developments
- 16.2.6.5. Financials (Based on Availability)
- 16.2.7 Smiths Medical Inc (Smiths Group)
- 16.2.7.1. Overview
- 16.2.7.2. Products
- 16.2.7.3. SWOT Analysis
- 16.2.7.4. Recent Developments
- 16.2.7.5. Financials (Based on Availability)
- 16.2.8 B Braun Melsungen AG
- 16.2.8.1. Overview
- 16.2.8.2. Products
- 16.2.8.3. SWOT Analysis
- 16.2.8.4. Recent Developments
- 16.2.8.5. Financials (Based on Availability)
- 16.2.9 Baxter International Inc
- 16.2.9.1. Overview
- 16.2.9.2. Products
- 16.2.9.3. SWOT Analysis
- 16.2.9.4. Recent Developments
- 16.2.9.5. Financials (Based on Availability)
- 16.2.10 Avanos Medical Inc
- 16.2.10.1. Overview
- 16.2.10.2. Products
- 16.2.10.3. SWOT Analysis
- 16.2.10.4. Recent Developments
- 16.2.10.5. Financials (Based on Availability)
- 16.2.1 Daiken Medical Co Ltd
List of Figures
- Figure 1: Global Elastomeric Pump Industry Revenue Breakdown (Million, %) by Region 2024 & 2032
- Figure 2: Global Elastomeric Pump Industry Volume Breakdown (K Unit, %) by Region 2024 & 2032
- Figure 3: North America Elastomeric Pump Industry Revenue (Million), by Country 2024 & 2032
- Figure 4: North America Elastomeric Pump Industry Volume (K Unit), by Country 2024 & 2032
- Figure 5: North America Elastomeric Pump Industry Revenue Share (%), by Country 2024 & 2032
- Figure 6: North America Elastomeric Pump Industry Volume Share (%), by Country 2024 & 2032
- Figure 7: Europe Elastomeric Pump Industry Revenue (Million), by Country 2024 & 2032
- Figure 8: Europe Elastomeric Pump Industry Volume (K Unit), by Country 2024 & 2032
- Figure 9: Europe Elastomeric Pump Industry Revenue Share (%), by Country 2024 & 2032
- Figure 10: Europe Elastomeric Pump Industry Volume Share (%), by Country 2024 & 2032
- Figure 11: Asia Pacific Elastomeric Pump Industry Revenue (Million), by Country 2024 & 2032
- Figure 12: Asia Pacific Elastomeric Pump Industry Volume (K Unit), by Country 2024 & 2032
- Figure 13: Asia Pacific Elastomeric Pump Industry Revenue Share (%), by Country 2024 & 2032
- Figure 14: Asia Pacific Elastomeric Pump Industry Volume Share (%), by Country 2024 & 2032
- Figure 15: Middle East and Africa Elastomeric Pump Industry Revenue (Million), by Country 2024 & 2032
- Figure 16: Middle East and Africa Elastomeric Pump Industry Volume (K Unit), by Country 2024 & 2032
- Figure 17: Middle East and Africa Elastomeric Pump Industry Revenue Share (%), by Country 2024 & 2032
- Figure 18: Middle East and Africa Elastomeric Pump Industry Volume Share (%), by Country 2024 & 2032
- Figure 19: South America Elastomeric Pump Industry Revenue (Million), by Country 2024 & 2032
- Figure 20: South America Elastomeric Pump Industry Volume (K Unit), by Country 2024 & 2032
- Figure 21: South America Elastomeric Pump Industry Revenue Share (%), by Country 2024 & 2032
- Figure 22: South America Elastomeric Pump Industry Volume Share (%), by Country 2024 & 2032
- Figure 23: North America Elastomeric Pump Industry Revenue (Million), by Product Type 2024 & 2032
- Figure 24: North America Elastomeric Pump Industry Volume (K Unit), by Product Type 2024 & 2032
- Figure 25: North America Elastomeric Pump Industry Revenue Share (%), by Product Type 2024 & 2032
- Figure 26: North America Elastomeric Pump Industry Volume Share (%), by Product Type 2024 & 2032
- Figure 27: North America Elastomeric Pump Industry Revenue (Million), by Application 2024 & 2032
- Figure 28: North America Elastomeric Pump Industry Volume (K Unit), by Application 2024 & 2032
- Figure 29: North America Elastomeric Pump Industry Revenue Share (%), by Application 2024 & 2032
- Figure 30: North America Elastomeric Pump Industry Volume Share (%), by Application 2024 & 2032
- Figure 31: North America Elastomeric Pump Industry Revenue (Million), by End User 2024 & 2032
- Figure 32: North America Elastomeric Pump Industry Volume (K Unit), by End User 2024 & 2032
- Figure 33: North America Elastomeric Pump Industry Revenue Share (%), by End User 2024 & 2032
- Figure 34: North America Elastomeric Pump Industry Volume Share (%), by End User 2024 & 2032
- Figure 35: North America Elastomeric Pump Industry Revenue (Million), by Country 2024 & 2032
- Figure 36: North America Elastomeric Pump Industry Volume (K Unit), by Country 2024 & 2032
- Figure 37: North America Elastomeric Pump Industry Revenue Share (%), by Country 2024 & 2032
- Figure 38: North America Elastomeric Pump Industry Volume Share (%), by Country 2024 & 2032
- Figure 39: Europe Elastomeric Pump Industry Revenue (Million), by Product Type 2024 & 2032
- Figure 40: Europe Elastomeric Pump Industry Volume (K Unit), by Product Type 2024 & 2032
- Figure 41: Europe Elastomeric Pump Industry Revenue Share (%), by Product Type 2024 & 2032
- Figure 42: Europe Elastomeric Pump Industry Volume Share (%), by Product Type 2024 & 2032
- Figure 43: Europe Elastomeric Pump Industry Revenue (Million), by Application 2024 & 2032
- Figure 44: Europe Elastomeric Pump Industry Volume (K Unit), by Application 2024 & 2032
- Figure 45: Europe Elastomeric Pump Industry Revenue Share (%), by Application 2024 & 2032
- Figure 46: Europe Elastomeric Pump Industry Volume Share (%), by Application 2024 & 2032
- Figure 47: Europe Elastomeric Pump Industry Revenue (Million), by End User 2024 & 2032
- Figure 48: Europe Elastomeric Pump Industry Volume (K Unit), by End User 2024 & 2032
- Figure 49: Europe Elastomeric Pump Industry Revenue Share (%), by End User 2024 & 2032
- Figure 50: Europe Elastomeric Pump Industry Volume Share (%), by End User 2024 & 2032
- Figure 51: Europe Elastomeric Pump Industry Revenue (Million), by Country 2024 & 2032
- Figure 52: Europe Elastomeric Pump Industry Volume (K Unit), by Country 2024 & 2032
- Figure 53: Europe Elastomeric Pump Industry Revenue Share (%), by Country 2024 & 2032
- Figure 54: Europe Elastomeric Pump Industry Volume Share (%), by Country 2024 & 2032
- Figure 55: Asia Pacific Elastomeric Pump Industry Revenue (Million), by Product Type 2024 & 2032
- Figure 56: Asia Pacific Elastomeric Pump Industry Volume (K Unit), by Product Type 2024 & 2032
- Figure 57: Asia Pacific Elastomeric Pump Industry Revenue Share (%), by Product Type 2024 & 2032
- Figure 58: Asia Pacific Elastomeric Pump Industry Volume Share (%), by Product Type 2024 & 2032
- Figure 59: Asia Pacific Elastomeric Pump Industry Revenue (Million), by Application 2024 & 2032
- Figure 60: Asia Pacific Elastomeric Pump Industry Volume (K Unit), by Application 2024 & 2032
- Figure 61: Asia Pacific Elastomeric Pump Industry Revenue Share (%), by Application 2024 & 2032
- Figure 62: Asia Pacific Elastomeric Pump Industry Volume Share (%), by Application 2024 & 2032
- Figure 63: Asia Pacific Elastomeric Pump Industry Revenue (Million), by End User 2024 & 2032
- Figure 64: Asia Pacific Elastomeric Pump Industry Volume (K Unit), by End User 2024 & 2032
- Figure 65: Asia Pacific Elastomeric Pump Industry Revenue Share (%), by End User 2024 & 2032
- Figure 66: Asia Pacific Elastomeric Pump Industry Volume Share (%), by End User 2024 & 2032
- Figure 67: Asia Pacific Elastomeric Pump Industry Revenue (Million), by Country 2024 & 2032
- Figure 68: Asia Pacific Elastomeric Pump Industry Volume (K Unit), by Country 2024 & 2032
- Figure 69: Asia Pacific Elastomeric Pump Industry Revenue Share (%), by Country 2024 & 2032
- Figure 70: Asia Pacific Elastomeric Pump Industry Volume Share (%), by Country 2024 & 2032
- Figure 71: Middle East and Africa Elastomeric Pump Industry Revenue (Million), by Product Type 2024 & 2032
- Figure 72: Middle East and Africa Elastomeric Pump Industry Volume (K Unit), by Product Type 2024 & 2032
- Figure 73: Middle East and Africa Elastomeric Pump Industry Revenue Share (%), by Product Type 2024 & 2032
- Figure 74: Middle East and Africa Elastomeric Pump Industry Volume Share (%), by Product Type 2024 & 2032
- Figure 75: Middle East and Africa Elastomeric Pump Industry Revenue (Million), by Application 2024 & 2032
- Figure 76: Middle East and Africa Elastomeric Pump Industry Volume (K Unit), by Application 2024 & 2032
- Figure 77: Middle East and Africa Elastomeric Pump Industry Revenue Share (%), by Application 2024 & 2032
- Figure 78: Middle East and Africa Elastomeric Pump Industry Volume Share (%), by Application 2024 & 2032
- Figure 79: Middle East and Africa Elastomeric Pump Industry Revenue (Million), by End User 2024 & 2032
- Figure 80: Middle East and Africa Elastomeric Pump Industry Volume (K Unit), by End User 2024 & 2032
- Figure 81: Middle East and Africa Elastomeric Pump Industry Revenue Share (%), by End User 2024 & 2032
- Figure 82: Middle East and Africa Elastomeric Pump Industry Volume Share (%), by End User 2024 & 2032
- Figure 83: Middle East and Africa Elastomeric Pump Industry Revenue (Million), by Country 2024 & 2032
- Figure 84: Middle East and Africa Elastomeric Pump Industry Volume (K Unit), by Country 2024 & 2032
- Figure 85: Middle East and Africa Elastomeric Pump Industry Revenue Share (%), by Country 2024 & 2032
- Figure 86: Middle East and Africa Elastomeric Pump Industry Volume Share (%), by Country 2024 & 2032
- Figure 87: South America Elastomeric Pump Industry Revenue (Million), by Product Type 2024 & 2032
- Figure 88: South America Elastomeric Pump Industry Volume (K Unit), by Product Type 2024 & 2032
- Figure 89: South America Elastomeric Pump Industry Revenue Share (%), by Product Type 2024 & 2032
- Figure 90: South America Elastomeric Pump Industry Volume Share (%), by Product Type 2024 & 2032
- Figure 91: South America Elastomeric Pump Industry Revenue (Million), by Application 2024 & 2032
- Figure 92: South America Elastomeric Pump Industry Volume (K Unit), by Application 2024 & 2032
- Figure 93: South America Elastomeric Pump Industry Revenue Share (%), by Application 2024 & 2032
- Figure 94: South America Elastomeric Pump Industry Volume Share (%), by Application 2024 & 2032
- Figure 95: South America Elastomeric Pump Industry Revenue (Million), by End User 2024 & 2032
- Figure 96: South America Elastomeric Pump Industry Volume (K Unit), by End User 2024 & 2032
- Figure 97: South America Elastomeric Pump Industry Revenue Share (%), by End User 2024 & 2032
- Figure 98: South America Elastomeric Pump Industry Volume Share (%), by End User 2024 & 2032
- Figure 99: South America Elastomeric Pump Industry Revenue (Million), by Country 2024 & 2032
- Figure 100: South America Elastomeric Pump Industry Volume (K Unit), by Country 2024 & 2032
- Figure 101: South America Elastomeric Pump Industry Revenue Share (%), by Country 2024 & 2032
- Figure 102: South America Elastomeric Pump Industry Volume Share (%), by Country 2024 & 2032
List of Tables
- Table 1: Global Elastomeric Pump Industry Revenue Million Forecast, by Region 2019 & 2032
- Table 2: Global Elastomeric Pump Industry Volume K Unit Forecast, by Region 2019 & 2032
- Table 3: Global Elastomeric Pump Industry Revenue Million Forecast, by Product Type 2019 & 2032
- Table 4: Global Elastomeric Pump Industry Volume K Unit Forecast, by Product Type 2019 & 2032
- Table 5: Global Elastomeric Pump Industry Revenue Million Forecast, by Application 2019 & 2032
- Table 6: Global Elastomeric Pump Industry Volume K Unit Forecast, by Application 2019 & 2032
- Table 7: Global Elastomeric Pump Industry Revenue Million Forecast, by End User 2019 & 2032
- Table 8: Global Elastomeric Pump Industry Volume K Unit Forecast, by End User 2019 & 2032
- Table 9: Global Elastomeric Pump Industry Revenue Million Forecast, by Region 2019 & 2032
- Table 10: Global Elastomeric Pump Industry Volume K Unit Forecast, by Region 2019 & 2032
- Table 11: Global Elastomeric Pump Industry Revenue Million Forecast, by Country 2019 & 2032
- Table 12: Global Elastomeric Pump Industry Volume K Unit Forecast, by Country 2019 & 2032
- Table 13: United States Elastomeric Pump Industry Revenue (Million) Forecast, by Application 2019 & 2032
- Table 14: United States Elastomeric Pump Industry Volume (K Unit) Forecast, by Application 2019 & 2032
- Table 15: Canada Elastomeric Pump Industry Revenue (Million) Forecast, by Application 2019 & 2032
- Table 16: Canada Elastomeric Pump Industry Volume (K Unit) Forecast, by Application 2019 & 2032
- Table 17: Mexico Elastomeric Pump Industry Revenue (Million) Forecast, by Application 2019 & 2032
- Table 18: Mexico Elastomeric Pump Industry Volume (K Unit) Forecast, by Application 2019 & 2032
- Table 19: Global Elastomeric Pump Industry Revenue Million Forecast, by Country 2019 & 2032
- Table 20: Global Elastomeric Pump Industry Volume K Unit Forecast, by Country 2019 & 2032
- Table 21: Germany Elastomeric Pump Industry Revenue (Million) Forecast, by Application 2019 & 2032
- Table 22: Germany Elastomeric Pump Industry Volume (K Unit) Forecast, by Application 2019 & 2032
- Table 23: United Kingdom Elastomeric Pump Industry Revenue (Million) Forecast, by Application 2019 & 2032
- Table 24: United Kingdom Elastomeric Pump Industry Volume (K Unit) Forecast, by Application 2019 & 2032
- Table 25: France Elastomeric Pump Industry Revenue (Million) Forecast, by Application 2019 & 2032
- Table 26: France Elastomeric Pump Industry Volume (K Unit) Forecast, by Application 2019 & 2032
- Table 27: Italy Elastomeric Pump Industry Revenue (Million) Forecast, by Application 2019 & 2032
- Table 28: Italy Elastomeric Pump Industry Volume (K Unit) Forecast, by Application 2019 & 2032
- Table 29: Spain Elastomeric Pump Industry Revenue (Million) Forecast, by Application 2019 & 2032
- Table 30: Spain Elastomeric Pump Industry Volume (K Unit) Forecast, by Application 2019 & 2032
- Table 31: Rest of Europe Elastomeric Pump Industry Revenue (Million) Forecast, by Application 2019 & 2032
- Table 32: Rest of Europe Elastomeric Pump Industry Volume (K Unit) Forecast, by Application 2019 & 2032
- Table 33: Global Elastomeric Pump Industry Revenue Million Forecast, by Country 2019 & 2032
- Table 34: Global Elastomeric Pump Industry Volume K Unit Forecast, by Country 2019 & 2032
- Table 35: China Elastomeric Pump Industry Revenue (Million) Forecast, by Application 2019 & 2032
- Table 36: China Elastomeric Pump Industry Volume (K Unit) Forecast, by Application 2019 & 2032
- Table 37: Japan Elastomeric Pump Industry Revenue (Million) Forecast, by Application 2019 & 2032
- Table 38: Japan Elastomeric Pump Industry Volume (K Unit) Forecast, by Application 2019 & 2032
- Table 39: India Elastomeric Pump Industry Revenue (Million) Forecast, by Application 2019 & 2032
- Table 40: India Elastomeric Pump Industry Volume (K Unit) Forecast, by Application 2019 & 2032
- Table 41: Australia Elastomeric Pump Industry Revenue (Million) Forecast, by Application 2019 & 2032
- Table 42: Australia Elastomeric Pump Industry Volume (K Unit) Forecast, by Application 2019 & 2032
- Table 43: South Korea Elastomeric Pump Industry Revenue (Million) Forecast, by Application 2019 & 2032
- Table 44: South Korea Elastomeric Pump Industry Volume (K Unit) Forecast, by Application 2019 & 2032
- Table 45: Rest of Asia Pacific Elastomeric Pump Industry Revenue (Million) Forecast, by Application 2019 & 2032
- Table 46: Rest of Asia Pacific Elastomeric Pump Industry Volume (K Unit) Forecast, by Application 2019 & 2032
- Table 47: Global Elastomeric Pump Industry Revenue Million Forecast, by Country 2019 & 2032
- Table 48: Global Elastomeric Pump Industry Volume K Unit Forecast, by Country 2019 & 2032
- Table 49: GCC Elastomeric Pump Industry Revenue (Million) Forecast, by Application 2019 & 2032
- Table 50: GCC Elastomeric Pump Industry Volume (K Unit) Forecast, by Application 2019 & 2032
- Table 51: South Africa Elastomeric Pump Industry Revenue (Million) Forecast, by Application 2019 & 2032
- Table 52: South Africa Elastomeric Pump Industry Volume (K Unit) Forecast, by Application 2019 & 2032
- Table 53: Rest of Middle Eastst and Africa Elastomeric Pump Industry Revenue (Million) Forecast, by Application 2019 & 2032
- Table 54: Rest of Middle Eastst and Africa Elastomeric Pump Industry Volume (K Unit) Forecast, by Application 2019 & 2032
- Table 55: Global Elastomeric Pump Industry Revenue Million Forecast, by Country 2019 & 2032
- Table 56: Global Elastomeric Pump Industry Volume K Unit Forecast, by Country 2019 & 2032
- Table 57: Brazil Elastomeric Pump Industry Revenue (Million) Forecast, by Application 2019 & 2032
- Table 58: Brazil Elastomeric Pump Industry Volume (K Unit) Forecast, by Application 2019 & 2032
- Table 59: Argentina Elastomeric Pump Industry Revenue (Million) Forecast, by Application 2019 & 2032
- Table 60: Argentina Elastomeric Pump Industry Volume (K Unit) Forecast, by Application 2019 & 2032
- Table 61: Rest of South America Elastomeric Pump Industry Revenue (Million) Forecast, by Application 2019 & 2032
- Table 62: Rest of South America Elastomeric Pump Industry Volume (K Unit) Forecast, by Application 2019 & 2032
- Table 63: Global Elastomeric Pump Industry Revenue Million Forecast, by Product Type 2019 & 2032
- Table 64: Global Elastomeric Pump Industry Volume K Unit Forecast, by Product Type 2019 & 2032
- Table 65: Global Elastomeric Pump Industry Revenue Million Forecast, by Application 2019 & 2032
- Table 66: Global Elastomeric Pump Industry Volume K Unit Forecast, by Application 2019 & 2032
- Table 67: Global Elastomeric Pump Industry Revenue Million Forecast, by End User 2019 & 2032
- Table 68: Global Elastomeric Pump Industry Volume K Unit Forecast, by End User 2019 & 2032
- Table 69: Global Elastomeric Pump Industry Revenue Million Forecast, by Country 2019 & 2032
- Table 70: Global Elastomeric Pump Industry Volume K Unit Forecast, by Country 2019 & 2032
- Table 71: United States Elastomeric Pump Industry Revenue (Million) Forecast, by Application 2019 & 2032
- Table 72: United States Elastomeric Pump Industry Volume (K Unit) Forecast, by Application 2019 & 2032
- Table 73: Canada Elastomeric Pump Industry Revenue (Million) Forecast, by Application 2019 & 2032
- Table 74: Canada Elastomeric Pump Industry Volume (K Unit) Forecast, by Application 2019 & 2032
- Table 75: Mexico Elastomeric Pump Industry Revenue (Million) Forecast, by Application 2019 & 2032
- Table 76: Mexico Elastomeric Pump Industry Volume (K Unit) Forecast, by Application 2019 & 2032
- Table 77: Global Elastomeric Pump Industry Revenue Million Forecast, by Product Type 2019 & 2032
- Table 78: Global Elastomeric Pump Industry Volume K Unit Forecast, by Product Type 2019 & 2032
- Table 79: Global Elastomeric Pump Industry Revenue Million Forecast, by Application 2019 & 2032
- Table 80: Global Elastomeric Pump Industry Volume K Unit Forecast, by Application 2019 & 2032
- Table 81: Global Elastomeric Pump Industry Revenue Million Forecast, by End User 2019 & 2032
- Table 82: Global Elastomeric Pump Industry Volume K Unit Forecast, by End User 2019 & 2032
- Table 83: Global Elastomeric Pump Industry Revenue Million Forecast, by Country 2019 & 2032
- Table 84: Global Elastomeric Pump Industry Volume K Unit Forecast, by Country 2019 & 2032
- Table 85: Germany Elastomeric Pump Industry Revenue (Million) Forecast, by Application 2019 & 2032
- Table 86: Germany Elastomeric Pump Industry Volume (K Unit) Forecast, by Application 2019 & 2032
- Table 87: United Kingdom Elastomeric Pump Industry Revenue (Million) Forecast, by Application 2019 & 2032
- Table 88: United Kingdom Elastomeric Pump Industry Volume (K Unit) Forecast, by Application 2019 & 2032
- Table 89: France Elastomeric Pump Industry Revenue (Million) Forecast, by Application 2019 & 2032
- Table 90: France Elastomeric Pump Industry Volume (K Unit) Forecast, by Application 2019 & 2032
- Table 91: Italy Elastomeric Pump Industry Revenue (Million) Forecast, by Application 2019 & 2032
- Table 92: Italy Elastomeric Pump Industry Volume (K Unit) Forecast, by Application 2019 & 2032
- Table 93: Spain Elastomeric Pump Industry Revenue (Million) Forecast, by Application 2019 & 2032
- Table 94: Spain Elastomeric Pump Industry Volume (K Unit) Forecast, by Application 2019 & 2032
- Table 95: Rest of Europe Elastomeric Pump Industry Revenue (Million) Forecast, by Application 2019 & 2032
- Table 96: Rest of Europe Elastomeric Pump Industry Volume (K Unit) Forecast, by Application 2019 & 2032
- Table 97: Global Elastomeric Pump Industry Revenue Million Forecast, by Product Type 2019 & 2032
- Table 98: Global Elastomeric Pump Industry Volume K Unit Forecast, by Product Type 2019 & 2032
- Table 99: Global Elastomeric Pump Industry Revenue Million Forecast, by Application 2019 & 2032
- Table 100: Global Elastomeric Pump Industry Volume K Unit Forecast, by Application 2019 & 2032
- Table 101: Global Elastomeric Pump Industry Revenue Million Forecast, by End User 2019 & 2032
- Table 102: Global Elastomeric Pump Industry Volume K Unit Forecast, by End User 2019 & 2032
- Table 103: Global Elastomeric Pump Industry Revenue Million Forecast, by Country 2019 & 2032
- Table 104: Global Elastomeric Pump Industry Volume K Unit Forecast, by Country 2019 & 2032
- Table 105: China Elastomeric Pump Industry Revenue (Million) Forecast, by Application 2019 & 2032
- Table 106: China Elastomeric Pump Industry Volume (K Unit) Forecast, by Application 2019 & 2032
- Table 107: Japan Elastomeric Pump Industry Revenue (Million) Forecast, by Application 2019 & 2032
- Table 108: Japan Elastomeric Pump Industry Volume (K Unit) Forecast, by Application 2019 & 2032
- Table 109: India Elastomeric Pump Industry Revenue (Million) Forecast, by Application 2019 & 2032
- Table 110: India Elastomeric Pump Industry Volume (K Unit) Forecast, by Application 2019 & 2032
- Table 111: Australia Elastomeric Pump Industry Revenue (Million) Forecast, by Application 2019 & 2032
- Table 112: Australia Elastomeric Pump Industry Volume (K Unit) Forecast, by Application 2019 & 2032
- Table 113: South Korea Elastomeric Pump Industry Revenue (Million) Forecast, by Application 2019 & 2032
- Table 114: South Korea Elastomeric Pump Industry Volume (K Unit) Forecast, by Application 2019 & 2032
- Table 115: Rest of Asia Pacific Elastomeric Pump Industry Revenue (Million) Forecast, by Application 2019 & 2032
- Table 116: Rest of Asia Pacific Elastomeric Pump Industry Volume (K Unit) Forecast, by Application 2019 & 2032
- Table 117: Global Elastomeric Pump Industry Revenue Million Forecast, by Product Type 2019 & 2032
- Table 118: Global Elastomeric Pump Industry Volume K Unit Forecast, by Product Type 2019 & 2032
- Table 119: Global Elastomeric Pump Industry Revenue Million Forecast, by Application 2019 & 2032
- Table 120: Global Elastomeric Pump Industry Volume K Unit Forecast, by Application 2019 & 2032
- Table 121: Global Elastomeric Pump Industry Revenue Million Forecast, by End User 2019 & 2032
- Table 122: Global Elastomeric Pump Industry Volume K Unit Forecast, by End User 2019 & 2032
- Table 123: Global Elastomeric Pump Industry Revenue Million Forecast, by Country 2019 & 2032
- Table 124: Global Elastomeric Pump Industry Volume K Unit Forecast, by Country 2019 & 2032
- Table 125: GCC Elastomeric Pump Industry Revenue (Million) Forecast, by Application 2019 & 2032
- Table 126: GCC Elastomeric Pump Industry Volume (K Unit) Forecast, by Application 2019 & 2032
- Table 127: South Africa Elastomeric Pump Industry Revenue (Million) Forecast, by Application 2019 & 2032
- Table 128: South Africa Elastomeric Pump Industry Volume (K Unit) Forecast, by Application 2019 & 2032
- Table 129: Rest of Middle Eastst and Africa Elastomeric Pump Industry Revenue (Million) Forecast, by Application 2019 & 2032
- Table 130: Rest of Middle Eastst and Africa Elastomeric Pump Industry Volume (K Unit) Forecast, by Application 2019 & 2032
- Table 131: Global Elastomeric Pump Industry Revenue Million Forecast, by Product Type 2019 & 2032
- Table 132: Global Elastomeric Pump Industry Volume K Unit Forecast, by Product Type 2019 & 2032
- Table 133: Global Elastomeric Pump Industry Revenue Million Forecast, by Application 2019 & 2032
- Table 134: Global Elastomeric Pump Industry Volume K Unit Forecast, by Application 2019 & 2032
- Table 135: Global Elastomeric Pump Industry Revenue Million Forecast, by End User 2019 & 2032
- Table 136: Global Elastomeric Pump Industry Volume K Unit Forecast, by End User 2019 & 2032
- Table 137: Global Elastomeric Pump Industry Revenue Million Forecast, by Country 2019 & 2032
- Table 138: Global Elastomeric Pump Industry Volume K Unit Forecast, by Country 2019 & 2032
- Table 139: Brazil Elastomeric Pump Industry Revenue (Million) Forecast, by Application 2019 & 2032
- Table 140: Brazil Elastomeric Pump Industry Volume (K Unit) Forecast, by Application 2019 & 2032
- Table 141: Argentina Elastomeric Pump Industry Revenue (Million) Forecast, by Application 2019 & 2032
- Table 142: Argentina Elastomeric Pump Industry Volume (K Unit) Forecast, by Application 2019 & 2032
- Table 143: Rest of South America Elastomeric Pump Industry Revenue (Million) Forecast, by Application 2019 & 2032
- Table 144: Rest of South America Elastomeric Pump Industry Volume (K Unit) Forecast, by Application 2019 & 2032
Frequently Asked Questions
1. What is the projected Compound Annual Growth Rate (CAGR) of the Elastomeric Pump Industry?
The projected CAGR is approximately 4.95%.
2. Which companies are prominent players in the Elastomeric Pump Industry?
Key companies in the market include Daiken Medical Co Ltd, Woo Young Medical Co, Werfenlife SA (LeVenton SAU), Nipro Corporation, Epic Medical Pte Ltd, Ambu A/s, Smiths Medical Inc (Smiths Group), B Braun Melsungen AG, Baxter International Inc, Avanos Medical Inc.
3. What are the main segments of the Elastomeric Pump Industry?
The market segments include Product Type, Application, End User.
4. Can you provide details about the market size?
The market size is estimated to be USD 769.03 Million as of 2022.
5. What are some drivers contributing to market growth?
Advancements in Device Technologies and Advantages of the Elastomeric Pumps; Growing Burden of Chronic Diseases.
6. What are the notable trends driving market growth?
Chemotherapy Segment Expects to Register a High CAGR During the Forecast Period.
7. Are there any restraints impacting market growth?
Safety Issues and Disadvantages Associated with the Pumps; High Cost in Long-Term Use and Strict Regulations.
8. Can you provide examples of recent developments in the market?
In March 2022, Shanghai MicroPort Lifesciences Co., Ltd. received marketing approval from China's National Medical Products Administration (NMPA) for its independently developed new AutoEx Chemotherapy Infusion Pump (AutoEx).
9. What pricing options are available for accessing the report?
Pricing options include single-user, multi-user, and enterprise licenses priced at USD 4750, USD 5250, and USD 8750 respectively.
10. Is the market size provided in terms of value or volume?
The market size is provided in terms of value, measured in Million and volume, measured in K Unit.
11. Are there any specific market keywords associated with the report?
Yes, the market keyword associated with the report is "Elastomeric Pump Industry," which aids in identifying and referencing the specific market segment covered.
12. How do I determine which pricing option suits my needs best?
The pricing options vary based on user requirements and access needs. Individual users may opt for single-user licenses, while businesses requiring broader access may choose multi-user or enterprise licenses for cost-effective access to the report.
13. Are there any additional resources or data provided in the Elastomeric Pump Industry report?
While the report offers comprehensive insights, it's advisable to review the specific contents or supplementary materials provided to ascertain if additional resources or data are available.
14. How can I stay updated on further developments or reports in the Elastomeric Pump Industry?
To stay informed about further developments, trends, and reports in the Elastomeric Pump Industry, consider subscribing to industry newsletters, following relevant companies and organizations, or regularly checking reputable industry news sources and publications.
Methodology
Step 1 - Identification of Relevant Samples Size from Population Database


Step 2 - Approaches for Defining Global Market Size (Value, Volume* & Price*)

Note*: In applicable scenarios
Step 3 - Data Sources
Primary Research
- Web Analytics
- Survey Reports
- Research Institute
- Latest Research Reports
- Opinion Leaders
Secondary Research
- Annual Reports
- White Paper
- Latest Press Release
- Industry Association
- Paid Database
- Investor Presentations

Step 4 - Data Triangulation
Involves using different sources of information in order to increase the validity of a study
These sources are likely to be stakeholders in a program - participants, other researchers, program staff, other community members, and so on.
Then we put all data in single framework & apply various statistical tools to find out the dynamic on the market.
During the analysis stage, feedback from the stakeholder groups would be compared to determine areas of agreement as well as areas of divergence


