
Key Insights
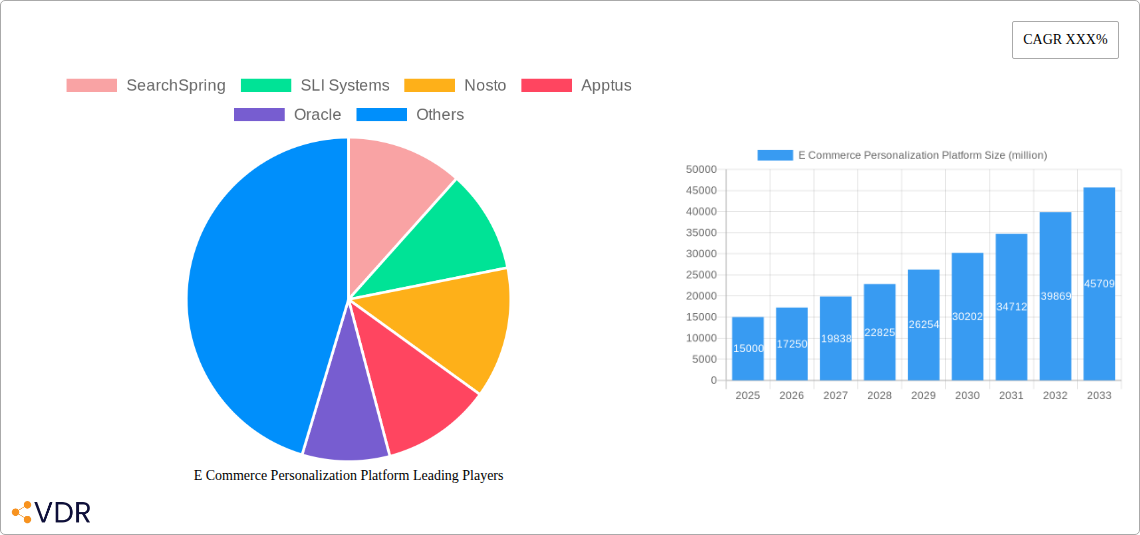
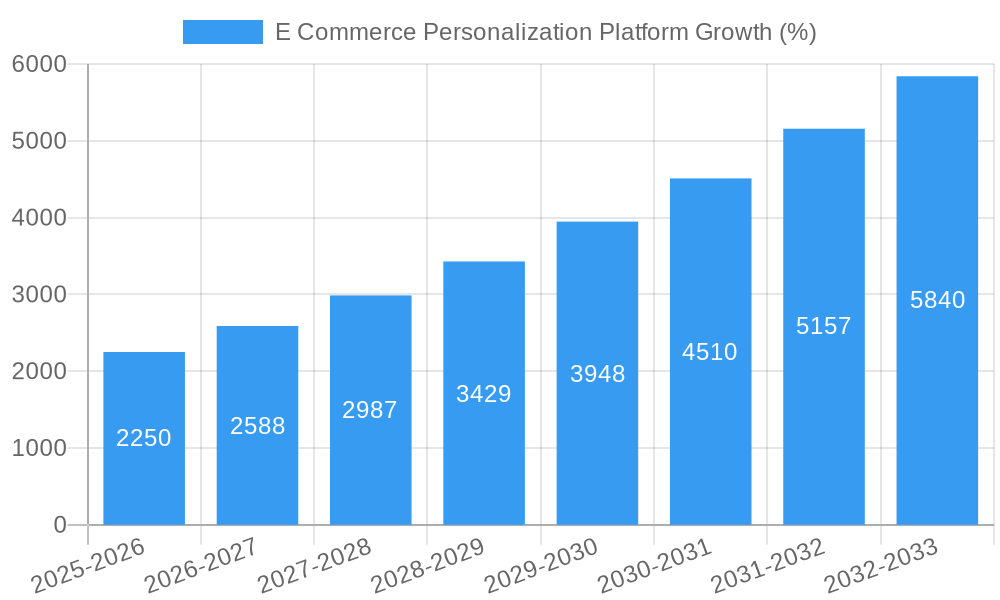
The e-commerce personalization platform market is experiencing robust growth, driven by the increasing need for businesses to enhance customer engagement and drive conversions in a competitive online landscape. The market, estimated at $15 billion in 2025, is projected to achieve a Compound Annual Growth Rate (CAGR) of 15% from 2025 to 2033, reaching approximately $45 billion by 2033. This growth is fueled by several key factors: the rising adoption of advanced technologies like AI and machine learning for personalized recommendations and targeted marketing, the expanding use of omnichannel strategies demanding unified personalization across various touchpoints, and the increasing availability of granular customer data enabling hyper-personalization. Furthermore, the growing preference for seamless and personalized online shopping experiences among consumers is significantly impacting market expansion. Companies are investing heavily in sophisticated personalization platforms to improve customer lifetime value and gain a competitive edge.
The market is segmented by various factors including platform type (cloud-based vs. on-premise), deployment model (SaaS vs. self-hosted), and industry vertical (retail, fashion, travel, etc.). While the cloud-based SaaS model dominates the market due to its scalability and cost-effectiveness, on-premise solutions still cater to enterprises with stringent security requirements. Key players such as SearchSpring, SLI Systems, Nosto, and others are actively innovating to offer advanced features like AI-powered product recommendations, personalized search experiences, and dynamic content optimization. However, factors such as the high initial investment cost, the need for skilled personnel to manage and maintain these platforms, and the potential for data privacy concerns act as restraints to market growth. Despite these challenges, the market’s future outlook remains promising, fueled by ongoing technological advancements and the ever-growing demand for personalized digital experiences.
E-commerce Personalization Platform Market Report: 2019-2033
This comprehensive report provides an in-depth analysis of the e-commerce personalization platform market, encompassing market dynamics, growth trends, regional dominance, product landscape, key players, and future outlook. The study period covers 2019-2033, with 2025 as the base and estimated year, and a forecast period of 2025-2033. The report leverages extensive primary and secondary research to deliver actionable insights for industry professionals, investors, and businesses operating within the parent market of e-commerce software and the child market of personalization technologies. The global market size is projected to reach xx billion by 2033.
E-commerce Personalization Platform Market Dynamics & Structure
The e-commerce personalization platform market is characterized by a moderately concentrated structure, with key players such as SearchSpring, SLI Systems, Nosto, Apptus, Oracle, SAP, Bluecore, Prediggo, Clerk.io, Klevu, Lucidworks, ChapsVision (Octipas), Paraspar, Algolia, Reflektion holding significant market share. The market is driven by technological innovations like AI-powered recommendation engines and advanced analytics, fostering continuous improvement in personalization capabilities. Regulatory frameworks concerning data privacy (e.g., GDPR, CCPA) significantly influence market dynamics, demanding robust compliance measures. Competitive substitutes, such as basic CRM systems with limited personalization features, pose a challenge, but the increasing need for sophisticated customer engagement strategies fuels growth. The market has witnessed several M&A activities in recent years, with xx deals recorded between 2019 and 2024, mostly focused on enhancing technological capabilities and expanding market reach. End-user demographics are primarily driven by the expansion of e-commerce across various industries, increasing the demand for effective personalization strategies.
- Market concentration: Moderately concentrated, with top 10 players holding xx% market share in 2025.
- Technological innovation: AI, machine learning, and big data analytics are key drivers.
- Regulatory landscape: GDPR, CCPA, and other data privacy regulations impact platform development and deployment.
- Competitive substitutes: Basic CRM systems with limited personalization capabilities.
- M&A activity: xx deals between 2019-2024, focusing on technology integration and market expansion.
- Innovation barriers: High initial investment costs, data integration complexities, and talent acquisition challenges.
E-commerce Personalization Platform Growth Trends & Insights
The e-commerce personalization platform market experienced robust growth during the historical period (2019-2024), expanding at a CAGR of xx%. This growth is attributed to the rising adoption of e-commerce across various industries, increasing customer expectations for personalized experiences, and the proliferation of sophisticated personalization technologies. The market size reached xx billion in 2024 and is projected to reach xx billion in 2025, exhibiting a significant increase. Technological disruptions, such as the rise of AI-driven personalization and the integration of omnichannel strategies, have significantly impacted market dynamics. Consumer behavior shifts towards personalized experiences and increased reliance on online shopping have further fueled market growth. Market penetration is expected to reach xx% by 2033, driven by continued technological advancements and increasing adoption rates. The forecast period (2025-2033) anticipates a CAGR of xx%, reaching a projected market value of xx billion by 2033.
Dominant Regions, Countries, or Segments in E-commerce Personalization Platform
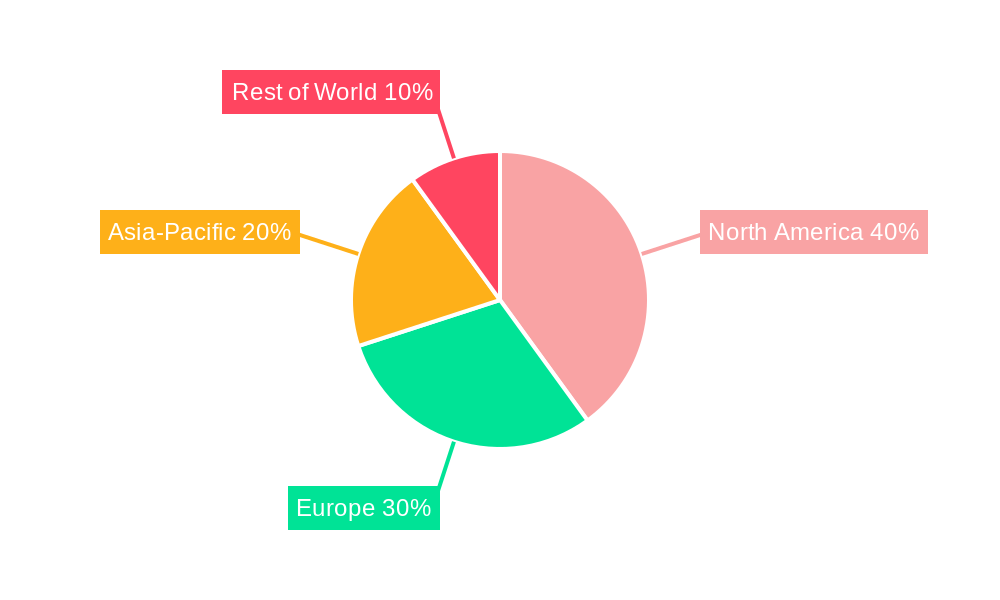
North America currently dominates the e-commerce personalization platform market, holding a xx% market share in 2025, driven by the high adoption of e-commerce, strong technological infrastructure, and the presence of major market players. Europe follows as the second-largest market, with a xx% share, fueled by increasing digitalization and the growing focus on personalized customer experiences. The Asia-Pacific region is projected to experience the fastest growth rate during the forecast period, driven by increasing internet and smartphone penetration, coupled with expanding e-commerce activities.
- North America: High e-commerce adoption, strong technological infrastructure, presence of major players.
- Europe: Increasing digitalization, growing focus on personalized customer experiences.
- Asia-Pacific: Rapid growth driven by increasing internet and smartphone penetration.
- Other Regions: Significant growth potential, but hindered by factors such as lower internet penetration.
E-commerce Personalization Platform Product Landscape
The e-commerce personalization platform market offers a diverse range of solutions, including recommendation engines, personalized search, targeted email marketing, and dynamic content personalization. These platforms leverage advanced technologies such as AI, machine learning, and big data analytics to deliver highly personalized customer experiences. Unique selling propositions often include real-time personalization, seamless integration with existing e-commerce platforms, advanced analytics dashboards, and robust customer support. Recent technological advancements focus on improving prediction accuracy, enhancing user experience, and optimizing conversion rates.
Key Drivers, Barriers & Challenges in E-commerce Personalization Platform
Key Drivers: The primary drivers include the rising demand for personalized customer experiences, increased adoption of e-commerce, advancements in AI and machine learning, and the need for improved customer engagement strategies. The growing volume of e-commerce data provides fuel for personalization algorithms.
Key Barriers & Challenges: Data privacy regulations, integration complexities with existing systems, high implementation costs, and the need for skilled personnel represent significant challenges. Competitive pressure from established players and emerging startups also poses a threat, impacting market share and profitability. Supply chain disruptions can affect the timely delivery of solutions. The estimated impact of these challenges on market growth is approximately xx% reduction by 2033.
Emerging Opportunities in E-commerce Personalization Platform
Emerging opportunities lie in the expansion into untapped markets, particularly in developing economies with burgeoning e-commerce sectors. The integration of AR/VR technologies for personalized product visualization and the development of solutions tailored to specific niche markets offer significant growth potential. Furthermore, the increasing demand for personalized customer service and support opens avenues for innovative applications of personalization platforms.
Growth Accelerators in the E-commerce Personalization Platform Industry
Technological breakthroughs in AI and machine learning, strategic partnerships between platform providers and e-commerce businesses, and the expansion into new geographic markets and industry verticals are key growth accelerators. The development of more user-friendly interfaces and improved analytics capabilities will further enhance market adoption. Increased investment in research and development will drive innovation and competition.
Key Players Shaping the E-commerce Personalization Platform Market
- SearchSpring
- SLI Systems
- Nosto
- Apptus
- Oracle
- SAP
- Bluecore
- Prediggo
- Clerk.io
- Klevu
- Lucidworks
- ChapsVision (Octipas)
- Paraspar
- Algolia
- Reflektion
Notable Milestones in E-commerce Personalization Platform Sector
- 2020: Launch of AI-powered recommendation engine by SearchSpring.
- 2021: Acquisition of a smaller personalization company by Oracle.
- 2022: Introduction of a new omnichannel personalization platform by Nosto.
- 2023: Partnership between SAP and a major e-commerce platform provider.
- 2024: Release of GDPR-compliant personalization solution by Clerk.io.
In-Depth E-commerce Personalization Platform Market Outlook
The future of the e-commerce personalization platform market is bright, driven by continuous technological advancements, increasing customer expectations, and the expanding e-commerce landscape. Strategic partnerships, acquisitions, and innovation in areas such as AI and AR/VR will continue to shape the market. The market is poised for robust growth, with significant opportunities for existing and new players to capitalize on the increasing demand for personalized customer experiences. The projected market size and growth rate suggest a compelling investment opportunity for businesses interested in this dynamic sector.
E Commerce Personalization Platform Segmentation
-
1. Application
- 1.1. SMEs
- 1.2. Large Enterprises
-
2. Type
- 2.1. Apparel & Footwear
- 2.2. Groceries & Food
- 2.3. Home & Furniture
- 2.4. Electronics & Jewelry
- 2.5. Beauty & Personal Care
- 2.6. Other
E Commerce Personalization Platform Segmentation By Geography
-
1. North America
- 1.1. United States
- 1.2. Canada
- 1.3. Mexico
-
2. South America
- 2.1. Brazil
- 2.2. Argentina
- 2.3. Rest of South America
-
3. Europe
- 3.1. United Kingdom
- 3.2. Germany
- 3.3. France
- 3.4. Italy
- 3.5. Spain
- 3.6. Russia
- 3.7. Benelux
- 3.8. Nordics
- 3.9. Rest of Europe
-
4. Middle East & Africa
- 4.1. Turkey
- 4.2. Israel
- 4.3. GCC
- 4.4. North Africa
- 4.5. South Africa
- 4.6. Rest of Middle East & Africa
-
5. Asia Pacific
- 5.1. China
- 5.2. India
- 5.3. Japan
- 5.4. South Korea
- 5.5. ASEAN
- 5.6. Oceania
- 5.7. Rest of Asia Pacific
E Commerce Personalization Platform REPORT HIGHLIGHTS
| Aspects | Details |
|---|---|
| Study Period | 2019-2033 |
| Base Year | 2024 |
| Estimated Year | 2025 |
| Forecast Period | 2025-2033 |
| Historical Period | 2019-2024 |
| Growth Rate | CAGR of XXX% from 2019-2033 |
| Segmentation |
|
Table of Contents
- 1. Introduction
- 1.1. Research Scope
- 1.2. Market Segmentation
- 1.3. Research Methodology
- 1.4. Definitions and Assumptions
- 2. Executive Summary
- 2.1. Introduction
- 3. Market Dynamics
- 3.1. Introduction
- 3.2. Market Drivers
- 3.3. Market Restrains
- 3.4. Market Trends
- 4. Market Factor Analysis
- 4.1. Porters Five Forces
- 4.2. Supply/Value Chain
- 4.3. PESTEL analysis
- 4.4. Market Entropy
- 4.5. Patent/Trademark Analysis
- 5. Global E Commerce Personalization Platform Analysis, Insights and Forecast, 2019-2031
- 5.1. Market Analysis, Insights and Forecast - by Application
- 5.1.1. SMEs
- 5.1.2. Large Enterprises
- 5.2. Market Analysis, Insights and Forecast - by Type
- 5.2.1. Apparel & Footwear
- 5.2.2. Groceries & Food
- 5.2.3. Home & Furniture
- 5.2.4. Electronics & Jewelry
- 5.2.5. Beauty & Personal Care
- 5.2.6. Other
- 5.3. Market Analysis, Insights and Forecast - by Region
- 5.3.1. North America
- 5.3.2. South America
- 5.3.3. Europe
- 5.3.4. Middle East & Africa
- 5.3.5. Asia Pacific
- 5.1. Market Analysis, Insights and Forecast - by Application
- 6. North America E Commerce Personalization Platform Analysis, Insights and Forecast, 2019-2031
- 6.1. Market Analysis, Insights and Forecast - by Application
- 6.1.1. SMEs
- 6.1.2. Large Enterprises
- 6.2. Market Analysis, Insights and Forecast - by Type
- 6.2.1. Apparel & Footwear
- 6.2.2. Groceries & Food
- 6.2.3. Home & Furniture
- 6.2.4. Electronics & Jewelry
- 6.2.5. Beauty & Personal Care
- 6.2.6. Other
- 6.1. Market Analysis, Insights and Forecast - by Application
- 7. South America E Commerce Personalization Platform Analysis, Insights and Forecast, 2019-2031
- 7.1. Market Analysis, Insights and Forecast - by Application
- 7.1.1. SMEs
- 7.1.2. Large Enterprises
- 7.2. Market Analysis, Insights and Forecast - by Type
- 7.2.1. Apparel & Footwear
- 7.2.2. Groceries & Food
- 7.2.3. Home & Furniture
- 7.2.4. Electronics & Jewelry
- 7.2.5. Beauty & Personal Care
- 7.2.6. Other
- 7.1. Market Analysis, Insights and Forecast - by Application
- 8. Europe E Commerce Personalization Platform Analysis, Insights and Forecast, 2019-2031
- 8.1. Market Analysis, Insights and Forecast - by Application
- 8.1.1. SMEs
- 8.1.2. Large Enterprises
- 8.2. Market Analysis, Insights and Forecast - by Type
- 8.2.1. Apparel & Footwear
- 8.2.2. Groceries & Food
- 8.2.3. Home & Furniture
- 8.2.4. Electronics & Jewelry
- 8.2.5. Beauty & Personal Care
- 8.2.6. Other
- 8.1. Market Analysis, Insights and Forecast - by Application
- 9. Middle East & Africa E Commerce Personalization Platform Analysis, Insights and Forecast, 2019-2031
- 9.1. Market Analysis, Insights and Forecast - by Application
- 9.1.1. SMEs
- 9.1.2. Large Enterprises
- 9.2. Market Analysis, Insights and Forecast - by Type
- 9.2.1. Apparel & Footwear
- 9.2.2. Groceries & Food
- 9.2.3. Home & Furniture
- 9.2.4. Electronics & Jewelry
- 9.2.5. Beauty & Personal Care
- 9.2.6. Other
- 9.1. Market Analysis, Insights and Forecast - by Application
- 10. Asia Pacific E Commerce Personalization Platform Analysis, Insights and Forecast, 2019-2031
- 10.1. Market Analysis, Insights and Forecast - by Application
- 10.1.1. SMEs
- 10.1.2. Large Enterprises
- 10.2. Market Analysis, Insights and Forecast - by Type
- 10.2.1. Apparel & Footwear
- 10.2.2. Groceries & Food
- 10.2.3. Home & Furniture
- 10.2.4. Electronics & Jewelry
- 10.2.5. Beauty & Personal Care
- 10.2.6. Other
- 10.1. Market Analysis, Insights and Forecast - by Application
- 11. Competitive Analysis
- 11.1. Global Market Share Analysis 2024
- 11.2. Company Profiles
- 11.2.1 SearchSpring
- 11.2.1.1. Overview
- 11.2.1.2. Products
- 11.2.1.3. SWOT Analysis
- 11.2.1.4. Recent Developments
- 11.2.1.5. Financials (Based on Availability)
- 11.2.2 SLI Systems
- 11.2.2.1. Overview
- 11.2.2.2. Products
- 11.2.2.3. SWOT Analysis
- 11.2.2.4. Recent Developments
- 11.2.2.5. Financials (Based on Availability)
- 11.2.3 Nosto
- 11.2.3.1. Overview
- 11.2.3.2. Products
- 11.2.3.3. SWOT Analysis
- 11.2.3.4. Recent Developments
- 11.2.3.5. Financials (Based on Availability)
- 11.2.4 Apptus
- 11.2.4.1. Overview
- 11.2.4.2. Products
- 11.2.4.3. SWOT Analysis
- 11.2.4.4. Recent Developments
- 11.2.4.5. Financials (Based on Availability)
- 11.2.5 Oracle
- 11.2.5.1. Overview
- 11.2.5.2. Products
- 11.2.5.3. SWOT Analysis
- 11.2.5.4. Recent Developments
- 11.2.5.5. Financials (Based on Availability)
- 11.2.6 SAP
- 11.2.6.1. Overview
- 11.2.6.2. Products
- 11.2.6.3. SWOT Analysis
- 11.2.6.4. Recent Developments
- 11.2.6.5. Financials (Based on Availability)
- 11.2.7 Bluecore
- 11.2.7.1. Overview
- 11.2.7.2. Products
- 11.2.7.3. SWOT Analysis
- 11.2.7.4. Recent Developments
- 11.2.7.5. Financials (Based on Availability)
- 11.2.8 Prediggo
- 11.2.8.1. Overview
- 11.2.8.2. Products
- 11.2.8.3. SWOT Analysis
- 11.2.8.4. Recent Developments
- 11.2.8.5. Financials (Based on Availability)
- 11.2.9 Clerk.io
- 11.2.9.1. Overview
- 11.2.9.2. Products
- 11.2.9.3. SWOT Analysis
- 11.2.9.4. Recent Developments
- 11.2.9.5. Financials (Based on Availability)
- 11.2.10 Klevu
- 11.2.10.1. Overview
- 11.2.10.2. Products
- 11.2.10.3. SWOT Analysis
- 11.2.10.4. Recent Developments
- 11.2.10.5. Financials (Based on Availability)
- 11.2.11 Lucidworks
- 11.2.11.1. Overview
- 11.2.11.2. Products
- 11.2.11.3. SWOT Analysis
- 11.2.11.4. Recent Developments
- 11.2.11.5. Financials (Based on Availability)
- 11.2.12 ChapsVision (Octipas)
- 11.2.12.1. Overview
- 11.2.12.2. Products
- 11.2.12.3. SWOT Analysis
- 11.2.12.4. Recent Developments
- 11.2.12.5. Financials (Based on Availability)
- 11.2.13 Paraspar
- 11.2.13.1. Overview
- 11.2.13.2. Products
- 11.2.13.3. SWOT Analysis
- 11.2.13.4. Recent Developments
- 11.2.13.5. Financials (Based on Availability)
- 11.2.14 Algolia
- 11.2.14.1. Overview
- 11.2.14.2. Products
- 11.2.14.3. SWOT Analysis
- 11.2.14.4. Recent Developments
- 11.2.14.5. Financials (Based on Availability)
- 11.2.15 Reflektion
- 11.2.15.1. Overview
- 11.2.15.2. Products
- 11.2.15.3. SWOT Analysis
- 11.2.15.4. Recent Developments
- 11.2.15.5. Financials (Based on Availability)
- 11.2.1 SearchSpring
List of Figures
- Figure 1: Global E Commerce Personalization Platform Revenue Breakdown (million, %) by Region 2024 & 2032
- Figure 2: North America E Commerce Personalization Platform Revenue (million), by Application 2024 & 2032
- Figure 3: North America E Commerce Personalization Platform Revenue Share (%), by Application 2024 & 2032
- Figure 4: North America E Commerce Personalization Platform Revenue (million), by Type 2024 & 2032
- Figure 5: North America E Commerce Personalization Platform Revenue Share (%), by Type 2024 & 2032
- Figure 6: North America E Commerce Personalization Platform Revenue (million), by Country 2024 & 2032
- Figure 7: North America E Commerce Personalization Platform Revenue Share (%), by Country 2024 & 2032
- Figure 8: South America E Commerce Personalization Platform Revenue (million), by Application 2024 & 2032
- Figure 9: South America E Commerce Personalization Platform Revenue Share (%), by Application 2024 & 2032
- Figure 10: South America E Commerce Personalization Platform Revenue (million), by Type 2024 & 2032
- Figure 11: South America E Commerce Personalization Platform Revenue Share (%), by Type 2024 & 2032
- Figure 12: South America E Commerce Personalization Platform Revenue (million), by Country 2024 & 2032
- Figure 13: South America E Commerce Personalization Platform Revenue Share (%), by Country 2024 & 2032
- Figure 14: Europe E Commerce Personalization Platform Revenue (million), by Application 2024 & 2032
- Figure 15: Europe E Commerce Personalization Platform Revenue Share (%), by Application 2024 & 2032
- Figure 16: Europe E Commerce Personalization Platform Revenue (million), by Type 2024 & 2032
- Figure 17: Europe E Commerce Personalization Platform Revenue Share (%), by Type 2024 & 2032
- Figure 18: Europe E Commerce Personalization Platform Revenue (million), by Country 2024 & 2032
- Figure 19: Europe E Commerce Personalization Platform Revenue Share (%), by Country 2024 & 2032
- Figure 20: Middle East & Africa E Commerce Personalization Platform Revenue (million), by Application 2024 & 2032
- Figure 21: Middle East & Africa E Commerce Personalization Platform Revenue Share (%), by Application 2024 & 2032
- Figure 22: Middle East & Africa E Commerce Personalization Platform Revenue (million), by Type 2024 & 2032
- Figure 23: Middle East & Africa E Commerce Personalization Platform Revenue Share (%), by Type 2024 & 2032
- Figure 24: Middle East & Africa E Commerce Personalization Platform Revenue (million), by Country 2024 & 2032
- Figure 25: Middle East & Africa E Commerce Personalization Platform Revenue Share (%), by Country 2024 & 2032
- Figure 26: Asia Pacific E Commerce Personalization Platform Revenue (million), by Application 2024 & 2032
- Figure 27: Asia Pacific E Commerce Personalization Platform Revenue Share (%), by Application 2024 & 2032
- Figure 28: Asia Pacific E Commerce Personalization Platform Revenue (million), by Type 2024 & 2032
- Figure 29: Asia Pacific E Commerce Personalization Platform Revenue Share (%), by Type 2024 & 2032
- Figure 30: Asia Pacific E Commerce Personalization Platform Revenue (million), by Country 2024 & 2032
- Figure 31: Asia Pacific E Commerce Personalization Platform Revenue Share (%), by Country 2024 & 2032
List of Tables
- Table 1: Global E Commerce Personalization Platform Revenue million Forecast, by Region 2019 & 2032
- Table 2: Global E Commerce Personalization Platform Revenue million Forecast, by Application 2019 & 2032
- Table 3: Global E Commerce Personalization Platform Revenue million Forecast, by Type 2019 & 2032
- Table 4: Global E Commerce Personalization Platform Revenue million Forecast, by Region 2019 & 2032
- Table 5: Global E Commerce Personalization Platform Revenue million Forecast, by Application 2019 & 2032
- Table 6: Global E Commerce Personalization Platform Revenue million Forecast, by Type 2019 & 2032
- Table 7: Global E Commerce Personalization Platform Revenue million Forecast, by Country 2019 & 2032
- Table 8: United States E Commerce Personalization Platform Revenue (million) Forecast, by Application 2019 & 2032
- Table 9: Canada E Commerce Personalization Platform Revenue (million) Forecast, by Application 2019 & 2032
- Table 10: Mexico E Commerce Personalization Platform Revenue (million) Forecast, by Application 2019 & 2032
- Table 11: Global E Commerce Personalization Platform Revenue million Forecast, by Application 2019 & 2032
- Table 12: Global E Commerce Personalization Platform Revenue million Forecast, by Type 2019 & 2032
- Table 13: Global E Commerce Personalization Platform Revenue million Forecast, by Country 2019 & 2032
- Table 14: Brazil E Commerce Personalization Platform Revenue (million) Forecast, by Application 2019 & 2032
- Table 15: Argentina E Commerce Personalization Platform Revenue (million) Forecast, by Application 2019 & 2032
- Table 16: Rest of South America E Commerce Personalization Platform Revenue (million) Forecast, by Application 2019 & 2032
- Table 17: Global E Commerce Personalization Platform Revenue million Forecast, by Application 2019 & 2032
- Table 18: Global E Commerce Personalization Platform Revenue million Forecast, by Type 2019 & 2032
- Table 19: Global E Commerce Personalization Platform Revenue million Forecast, by Country 2019 & 2032
- Table 20: United Kingdom E Commerce Personalization Platform Revenue (million) Forecast, by Application 2019 & 2032
- Table 21: Germany E Commerce Personalization Platform Revenue (million) Forecast, by Application 2019 & 2032
- Table 22: France E Commerce Personalization Platform Revenue (million) Forecast, by Application 2019 & 2032
- Table 23: Italy E Commerce Personalization Platform Revenue (million) Forecast, by Application 2019 & 2032
- Table 24: Spain E Commerce Personalization Platform Revenue (million) Forecast, by Application 2019 & 2032
- Table 25: Russia E Commerce Personalization Platform Revenue (million) Forecast, by Application 2019 & 2032
- Table 26: Benelux E Commerce Personalization Platform Revenue (million) Forecast, by Application 2019 & 2032
- Table 27: Nordics E Commerce Personalization Platform Revenue (million) Forecast, by Application 2019 & 2032
- Table 28: Rest of Europe E Commerce Personalization Platform Revenue (million) Forecast, by Application 2019 & 2032
- Table 29: Global E Commerce Personalization Platform Revenue million Forecast, by Application 2019 & 2032
- Table 30: Global E Commerce Personalization Platform Revenue million Forecast, by Type 2019 & 2032
- Table 31: Global E Commerce Personalization Platform Revenue million Forecast, by Country 2019 & 2032
- Table 32: Turkey E Commerce Personalization Platform Revenue (million) Forecast, by Application 2019 & 2032
- Table 33: Israel E Commerce Personalization Platform Revenue (million) Forecast, by Application 2019 & 2032
- Table 34: GCC E Commerce Personalization Platform Revenue (million) Forecast, by Application 2019 & 2032
- Table 35: North Africa E Commerce Personalization Platform Revenue (million) Forecast, by Application 2019 & 2032
- Table 36: South Africa E Commerce Personalization Platform Revenue (million) Forecast, by Application 2019 & 2032
- Table 37: Rest of Middle East & Africa E Commerce Personalization Platform Revenue (million) Forecast, by Application 2019 & 2032
- Table 38: Global E Commerce Personalization Platform Revenue million Forecast, by Application 2019 & 2032
- Table 39: Global E Commerce Personalization Platform Revenue million Forecast, by Type 2019 & 2032
- Table 40: Global E Commerce Personalization Platform Revenue million Forecast, by Country 2019 & 2032
- Table 41: China E Commerce Personalization Platform Revenue (million) Forecast, by Application 2019 & 2032
- Table 42: India E Commerce Personalization Platform Revenue (million) Forecast, by Application 2019 & 2032
- Table 43: Japan E Commerce Personalization Platform Revenue (million) Forecast, by Application 2019 & 2032
- Table 44: South Korea E Commerce Personalization Platform Revenue (million) Forecast, by Application 2019 & 2032
- Table 45: ASEAN E Commerce Personalization Platform Revenue (million) Forecast, by Application 2019 & 2032
- Table 46: Oceania E Commerce Personalization Platform Revenue (million) Forecast, by Application 2019 & 2032
- Table 47: Rest of Asia Pacific E Commerce Personalization Platform Revenue (million) Forecast, by Application 2019 & 2032
Frequently Asked Questions
1. What is the projected Compound Annual Growth Rate (CAGR) of the E Commerce Personalization Platform?
The projected CAGR is approximately XXX%.
2. Which companies are prominent players in the E Commerce Personalization Platform?
Key companies in the market include SearchSpring, SLI Systems, Nosto, Apptus, Oracle, SAP, Bluecore, Prediggo, Clerk.io, Klevu, Lucidworks, ChapsVision (Octipas), Paraspar, Algolia, Reflektion.
3. What are the main segments of the E Commerce Personalization Platform?
The market segments include Application, Type.
4. Can you provide details about the market size?
The market size is estimated to be USD XXX million as of 2022.
5. What are some drivers contributing to market growth?
N/A
6. What are the notable trends driving market growth?
N/A
7. Are there any restraints impacting market growth?
N/A
8. Can you provide examples of recent developments in the market?
N/A
9. What pricing options are available for accessing the report?
Pricing options include single-user, multi-user, and enterprise licenses priced at USD 4250.00, USD 6375.00, and USD 8500.00 respectively.
10. Is the market size provided in terms of value or volume?
The market size is provided in terms of value, measured in million.
11. Are there any specific market keywords associated with the report?
Yes, the market keyword associated with the report is "E Commerce Personalization Platform," which aids in identifying and referencing the specific market segment covered.
12. How do I determine which pricing option suits my needs best?
The pricing options vary based on user requirements and access needs. Individual users may opt for single-user licenses, while businesses requiring broader access may choose multi-user or enterprise licenses for cost-effective access to the report.
13. Are there any additional resources or data provided in the E Commerce Personalization Platform report?
While the report offers comprehensive insights, it's advisable to review the specific contents or supplementary materials provided to ascertain if additional resources or data are available.
14. How can I stay updated on further developments or reports in the E Commerce Personalization Platform?
To stay informed about further developments, trends, and reports in the E Commerce Personalization Platform, consider subscribing to industry newsletters, following relevant companies and organizations, or regularly checking reputable industry news sources and publications.
Methodology
Step 1 - Identification of Relevant Samples Size from Population Database


Step 2 - Approaches for Defining Global Market Size (Value, Volume* & Price*)

Note*: In applicable scenarios
Step 3 - Data Sources
Primary Research
- Web Analytics
- Survey Reports
- Research Institute
- Latest Research Reports
- Opinion Leaders
Secondary Research
- Annual Reports
- White Paper
- Latest Press Release
- Industry Association
- Paid Database
- Investor Presentations

Step 4 - Data Triangulation
Involves using different sources of information in order to increase the validity of a study
These sources are likely to be stakeholders in a program - participants, other researchers, program staff, other community members, and so on.
Then we put all data in single framework & apply various statistical tools to find out the dynamic on the market.
During the analysis stage, feedback from the stakeholder groups would be compared to determine areas of agreement as well as areas of divergence


