
Key Insights
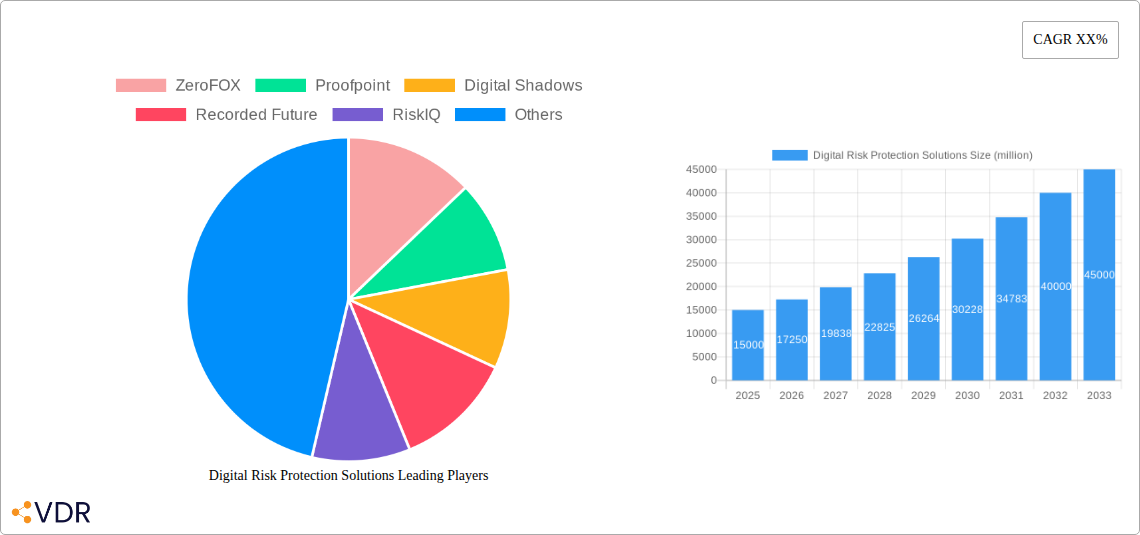
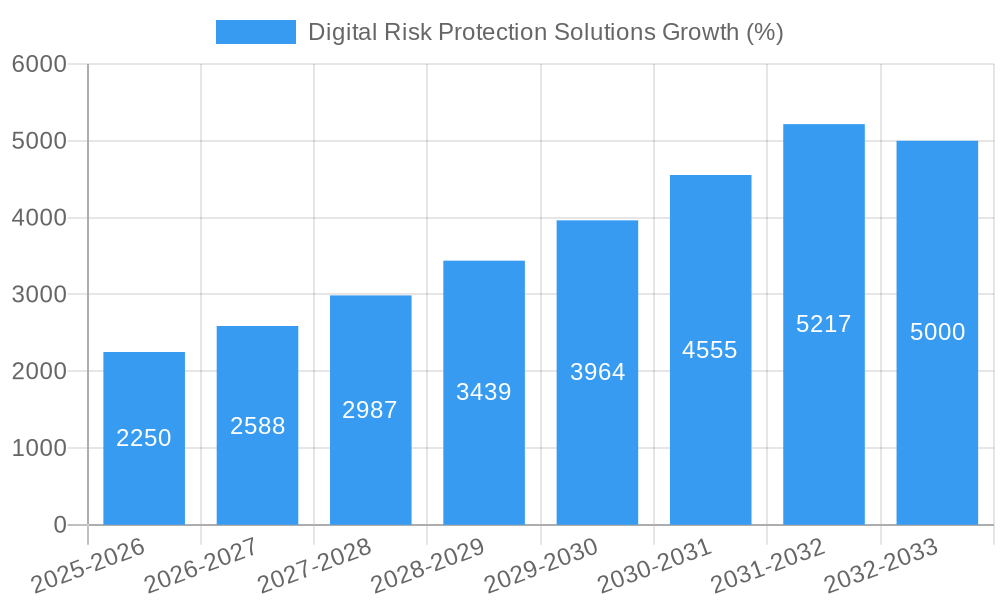
The Digital Risk Protection (DRP) solutions market is experiencing robust growth, driven by the escalating frequency and sophistication of cyber threats targeting organizations globally. The market, estimated at $15 billion in 2025, is projected to maintain a Compound Annual Growth Rate (CAGR) of 15% from 2025 to 2033, reaching approximately $45 billion by 2033. This expansion is fueled by several key factors: the increasing reliance on digital assets by businesses, the growing awareness of brand protection needs, and the rising adoption of cloud-based services, each increasing vulnerability to online attacks. Furthermore, the evolving threat landscape, including advanced persistent threats (APTs) and the proliferation of disinformation campaigns, necessitates proactive and comprehensive DRP strategies. Key market segments include threat intelligence platforms, social media monitoring tools, and vulnerability management solutions, each catering to specific organizational needs.
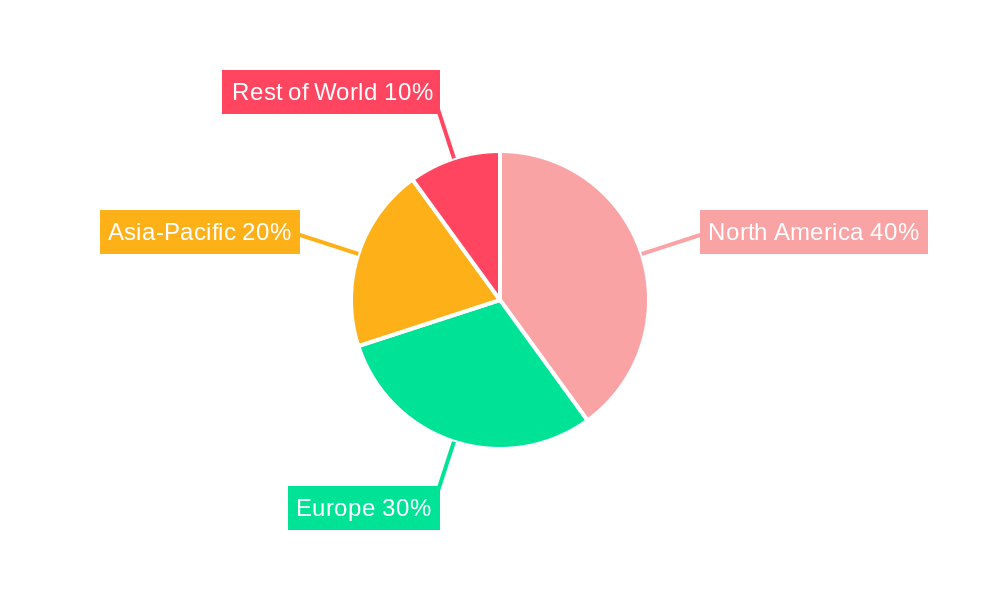
The competitive landscape is characterized by a mix of established players and emerging innovators. Companies like ZeroFOX, Proofpoint, and Recorded Future are prominent market leaders, leveraging their extensive experience and technological capabilities. However, the market also witnesses the emergence of niche players focusing on specialized solutions and geographic regions. Despite the robust growth, the market faces certain restraints, including the high cost of implementation and maintenance of DRP solutions, a lack of skilled cybersecurity professionals, and the complexity of integrating these solutions into existing security infrastructures. Addressing these challenges is vital for continued market expansion and wider adoption of DRP solutions across diverse industries and organizational sizes. The market's regional distribution will see strong growth in APAC and LATAM fueled by increasing digital adoption and government investments in cybersecurity infrastructure.
Digital Risk Protection Solutions Market Report: 2019-2033
This comprehensive report provides an in-depth analysis of the Digital Risk Protection (DRP) Solutions market, encompassing historical data (2019-2024), current estimations (2025), and future projections (2025-2033). It meticulously examines market dynamics, growth trends, regional dominance, product landscapes, key players, and emerging opportunities within this rapidly evolving sector. This report is crucial for cybersecurity professionals, investors, and businesses seeking to understand and capitalize on the DRP solutions market's potential. The market is segmented by solution type (e.g., threat intelligence, vulnerability management, incident response) and end-user industry (e.g., financial services, healthcare, government).
Digital Risk Protection Solutions Market Dynamics & Structure
The DRP solutions market, valued at $xx million in 2025, exhibits a moderately concentrated landscape with key players vying for market share. Technological innovation, particularly in AI and machine learning for threat detection, is a primary growth driver. Stringent data privacy regulations (e.g., GDPR, CCPA) are shaping market practices and increasing demand for DRP solutions. The market also faces competitive pressure from existing cybersecurity solutions offering overlapping functionalities. Mergers and acquisitions (M&A) activity is significant, reflecting the strategic importance of DRP capabilities.
- Market Concentration: Moderately concentrated, with the top 5 players holding approximately xx% of the market share in 2025.
- Technological Innovation: AI-powered threat intelligence, automated vulnerability management, and improved incident response capabilities are key drivers.
- Regulatory Framework: GDPR, CCPA, and other data privacy regulations are fostering demand for robust DRP solutions.
- Competitive Substitutes: Traditional cybersecurity solutions offering partial DRP functionalities present competitive pressure.
- M&A Activity: High M&A activity reflects consolidation and expansion strategies among key players, with xx deals recorded between 2019-2024.
- End-User Demographics: Large enterprises and government agencies represent the primary customer base, with growing adoption among SMBs.
Digital Risk Protection Solutions Growth Trends & Insights
The DRP solutions market experienced significant growth from 2019 to 2024, driven by rising cyber threats and increasing awareness of digital risk. The market is projected to maintain a Compound Annual Growth Rate (CAGR) of xx% during the forecast period (2025-2033), reaching an estimated value of $xx million by 2033. This growth is fueled by the rising adoption of cloud-based services, the increasing sophistication of cyberattacks, and the growing reliance on digital assets across various industries. Technological advancements, such as the integration of AI and machine learning, are enhancing the effectiveness and efficiency of DRP solutions. Furthermore, a shift in consumer behavior towards greater digital interaction and reliance on connected devices is accelerating market demand. Market penetration is expected to reach xx% by 2033.
Dominant Regions, Countries, or Segments in Digital Risk Protection Solutions
North America currently dominates the DRP solutions market, driven by a robust technological ecosystem, high cybersecurity awareness, and a large number of enterprise-level adopters. However, the Asia-Pacific region is expected to experience significant growth, fuelled by increasing internet penetration, rapid digitalization, and government initiatives to enhance cybersecurity infrastructure. Key factors driving regional dominance include favorable economic conditions, supportive government policies, and the presence of major technology hubs.
- North America: High cybersecurity awareness, mature technological ecosystem, and significant investment in DRP solutions contribute to market leadership.
- Europe: Strict data privacy regulations (GDPR) drive market growth, with a focus on compliance-related DRP solutions.
- Asia-Pacific: Rapid digitalization, increasing internet penetration, and government investment in cybersecurity infrastructure fuel significant growth potential.
Digital Risk Protection Solutions Product Landscape
The DRP solutions market offers a diverse range of products, including threat intelligence platforms, vulnerability management systems, incident response tools, and security information and event management (SIEM) solutions. Recent innovations focus on improving threat detection accuracy, automating incident response, and integrating with existing security infrastructure. Unique selling propositions include AI-powered threat detection, proactive risk identification, and streamlined workflows to minimize disruptions. The focus is on enhancing speed, accuracy, and effectiveness to counteract rapidly evolving cyber threats.
Key Drivers, Barriers & Challenges in Digital Risk Protection Solutions
Key Drivers: The increasing frequency and sophistication of cyberattacks, the growing reliance on digital assets, and stringent data privacy regulations are driving market growth. Technological advancements, particularly in AI and machine learning, are enhancing the effectiveness of DRP solutions.
Challenges: High initial investment costs, the complexity of integrating DRP solutions into existing security infrastructure, and the shortage of skilled cybersecurity professionals pose challenges. Supply chain vulnerabilities and regulatory hurdles can impact market growth.
Emerging Opportunities in Digital Risk Protection Solutions
The DRP market presents significant opportunities in untapped segments, such as small and medium-sized businesses (SMBs), which are increasingly becoming targets of cyberattacks. Innovative applications of DRP solutions in areas such as IoT security and supply chain risk management represent lucrative avenues. The rising need for proactive risk management and the expansion of cloud-based DRP solutions are driving new opportunities.
Growth Accelerators in the Digital Risk Protection Solutions Industry
Technological breakthroughs in AI and machine learning, coupled with strategic partnerships between DRP solution providers and cybersecurity consultancies, are accelerating market growth. Expansion strategies focusing on emerging markets and the integration of DRP solutions with existing security tools are driving long-term growth.
Key Players Shaping the Digital Risk Protection Solutions Market
- ZeroFOX
- Proofpoint
- Digital Shadows
- Recorded Future
- RiskIQ
- IntSights
- Axur
- Cyberint
- SKURIO
- SafeGuard Cyber (Social SafeGuard)
- Blueliv
- AppGate (Cyxtera)
- Sweepatic
- CTM360
- Cybersprint
Notable Milestones in Digital Risk Protection Solutions Sector
- 2020, Q3: Increased adoption of cloud-based DRP solutions due to the rise in remote work.
- 2021, Q1: Significant investment in AI-powered threat intelligence platforms.
- 2022, Q2: Several key acquisitions in the DRP sector consolidate market players.
- 2023, Q4: Launch of new DRP solutions incorporating advanced threat modeling capabilities.
In-Depth Digital Risk Protection Solutions Market Outlook
The DRP solutions market is poised for continued growth, driven by persistent cyber threats and increasing demand for proactive risk management. Strategic partnerships, technological advancements, and expansion into emerging markets will shape the future of this sector. Opportunities exist for innovative solutions addressing evolving cyber threats, particularly in areas such as IoT and supply chain security. The market's long-term potential is significant, presenting attractive opportunities for investors and industry players alike.
Digital Risk Protection Solutions Segmentation
-
1. Application
- 1.1. Large Enterprises
- 1.2. SMEs
-
2. Types
- 2.1. Cloud-Based
- 2.2. On-Premise
Digital Risk Protection Solutions Segmentation By Geography
-
1. North America
- 1.1. United States
- 1.2. Canada
- 1.3. Mexico
-
2. South America
- 2.1. Brazil
- 2.2. Argentina
- 2.3. Rest of South America
-
3. Europe
- 3.1. United Kingdom
- 3.2. Germany
- 3.3. France
- 3.4. Italy
- 3.5. Spain
- 3.6. Russia
- 3.7. Benelux
- 3.8. Nordics
- 3.9. Rest of Europe
-
4. Middle East & Africa
- 4.1. Turkey
- 4.2. Israel
- 4.3. GCC
- 4.4. North Africa
- 4.5. South Africa
- 4.6. Rest of Middle East & Africa
-
5. Asia Pacific
- 5.1. China
- 5.2. India
- 5.3. Japan
- 5.4. South Korea
- 5.5. ASEAN
- 5.6. Oceania
- 5.7. Rest of Asia Pacific
Digital Risk Protection Solutions REPORT HIGHLIGHTS
| Aspects | Details |
|---|---|
| Study Period | 2019-2033 |
| Base Year | 2024 |
| Estimated Year | 2025 |
| Forecast Period | 2025-2033 |
| Historical Period | 2019-2024 |
| Growth Rate | CAGR of XX% from 2019-2033 |
| Segmentation |
|
Table of Contents
- 1. Introduction
- 1.1. Research Scope
- 1.2. Market Segmentation
- 1.3. Research Methodology
- 1.4. Definitions and Assumptions
- 2. Executive Summary
- 2.1. Introduction
- 3. Market Dynamics
- 3.1. Introduction
- 3.2. Market Drivers
- 3.3. Market Restrains
- 3.4. Market Trends
- 4. Market Factor Analysis
- 4.1. Porters Five Forces
- 4.2. Supply/Value Chain
- 4.3. PESTEL analysis
- 4.4. Market Entropy
- 4.5. Patent/Trademark Analysis
- 5. Global Digital Risk Protection Solutions Analysis, Insights and Forecast, 2019-2031
- 5.1. Market Analysis, Insights and Forecast - by Application
- 5.1.1. Large Enterprises
- 5.1.2. SMEs
- 5.2. Market Analysis, Insights and Forecast - by Types
- 5.2.1. Cloud-Based
- 5.2.2. On-Premise
- 5.3. Market Analysis, Insights and Forecast - by Region
- 5.3.1. North America
- 5.3.2. South America
- 5.3.3. Europe
- 5.3.4. Middle East & Africa
- 5.3.5. Asia Pacific
- 5.1. Market Analysis, Insights and Forecast - by Application
- 6. North America Digital Risk Protection Solutions Analysis, Insights and Forecast, 2019-2031
- 6.1. Market Analysis, Insights and Forecast - by Application
- 6.1.1. Large Enterprises
- 6.1.2. SMEs
- 6.2. Market Analysis, Insights and Forecast - by Types
- 6.2.1. Cloud-Based
- 6.2.2. On-Premise
- 6.1. Market Analysis, Insights and Forecast - by Application
- 7. South America Digital Risk Protection Solutions Analysis, Insights and Forecast, 2019-2031
- 7.1. Market Analysis, Insights and Forecast - by Application
- 7.1.1. Large Enterprises
- 7.1.2. SMEs
- 7.2. Market Analysis, Insights and Forecast - by Types
- 7.2.1. Cloud-Based
- 7.2.2. On-Premise
- 7.1. Market Analysis, Insights and Forecast - by Application
- 8. Europe Digital Risk Protection Solutions Analysis, Insights and Forecast, 2019-2031
- 8.1. Market Analysis, Insights and Forecast - by Application
- 8.1.1. Large Enterprises
- 8.1.2. SMEs
- 8.2. Market Analysis, Insights and Forecast - by Types
- 8.2.1. Cloud-Based
- 8.2.2. On-Premise
- 8.1. Market Analysis, Insights and Forecast - by Application
- 9. Middle East & Africa Digital Risk Protection Solutions Analysis, Insights and Forecast, 2019-2031
- 9.1. Market Analysis, Insights and Forecast - by Application
- 9.1.1. Large Enterprises
- 9.1.2. SMEs
- 9.2. Market Analysis, Insights and Forecast - by Types
- 9.2.1. Cloud-Based
- 9.2.2. On-Premise
- 9.1. Market Analysis, Insights and Forecast - by Application
- 10. Asia Pacific Digital Risk Protection Solutions Analysis, Insights and Forecast, 2019-2031
- 10.1. Market Analysis, Insights and Forecast - by Application
- 10.1.1. Large Enterprises
- 10.1.2. SMEs
- 10.2. Market Analysis, Insights and Forecast - by Types
- 10.2.1. Cloud-Based
- 10.2.2. On-Premise
- 10.1. Market Analysis, Insights and Forecast - by Application
- 11. Competitive Analysis
- 11.1. Global Market Share Analysis 2024
- 11.2. Company Profiles
- 11.2.1 ZeroFOX
- 11.2.1.1. Overview
- 11.2.1.2. Products
- 11.2.1.3. SWOT Analysis
- 11.2.1.4. Recent Developments
- 11.2.1.5. Financials (Based on Availability)
- 11.2.2 Proofpoint
- 11.2.2.1. Overview
- 11.2.2.2. Products
- 11.2.2.3. SWOT Analysis
- 11.2.2.4. Recent Developments
- 11.2.2.5. Financials (Based on Availability)
- 11.2.3 Digital Shadows
- 11.2.3.1. Overview
- 11.2.3.2. Products
- 11.2.3.3. SWOT Analysis
- 11.2.3.4. Recent Developments
- 11.2.3.5. Financials (Based on Availability)
- 11.2.4 Recorded Future
- 11.2.4.1. Overview
- 11.2.4.2. Products
- 11.2.4.3. SWOT Analysis
- 11.2.4.4. Recent Developments
- 11.2.4.5. Financials (Based on Availability)
- 11.2.5 RiskIQ
- 11.2.5.1. Overview
- 11.2.5.2. Products
- 11.2.5.3. SWOT Analysis
- 11.2.5.4. Recent Developments
- 11.2.5.5. Financials (Based on Availability)
- 11.2.6 IntSights
- 11.2.6.1. Overview
- 11.2.6.2. Products
- 11.2.6.3. SWOT Analysis
- 11.2.6.4. Recent Developments
- 11.2.6.5. Financials (Based on Availability)
- 11.2.7 Axur
- 11.2.7.1. Overview
- 11.2.7.2. Products
- 11.2.7.3. SWOT Analysis
- 11.2.7.4. Recent Developments
- 11.2.7.5. Financials (Based on Availability)
- 11.2.8 Cyberint
- 11.2.8.1. Overview
- 11.2.8.2. Products
- 11.2.8.3. SWOT Analysis
- 11.2.8.4. Recent Developments
- 11.2.8.5. Financials (Based on Availability)
- 11.2.9 SKURIO
- 11.2.9.1. Overview
- 11.2.9.2. Products
- 11.2.9.3. SWOT Analysis
- 11.2.9.4. Recent Developments
- 11.2.9.5. Financials (Based on Availability)
- 11.2.10 SafeGuard Cyber (Social SafeGuard)
- 11.2.10.1. Overview
- 11.2.10.2. Products
- 11.2.10.3. SWOT Analysis
- 11.2.10.4. Recent Developments
- 11.2.10.5. Financials (Based on Availability)
- 11.2.11 Blueliv
- 11.2.11.1. Overview
- 11.2.11.2. Products
- 11.2.11.3. SWOT Analysis
- 11.2.11.4. Recent Developments
- 11.2.11.5. Financials (Based on Availability)
- 11.2.12 AppGate (Cyxtera)
- 11.2.12.1. Overview
- 11.2.12.2. Products
- 11.2.12.3. SWOT Analysis
- 11.2.12.4. Recent Developments
- 11.2.12.5. Financials (Based on Availability)
- 11.2.13 Sweepatic
- 11.2.13.1. Overview
- 11.2.13.2. Products
- 11.2.13.3. SWOT Analysis
- 11.2.13.4. Recent Developments
- 11.2.13.5. Financials (Based on Availability)
- 11.2.14 CTM360
- 11.2.14.1. Overview
- 11.2.14.2. Products
- 11.2.14.3. SWOT Analysis
- 11.2.14.4. Recent Developments
- 11.2.14.5. Financials (Based on Availability)
- 11.2.15 Cybersprint
- 11.2.15.1. Overview
- 11.2.15.2. Products
- 11.2.15.3. SWOT Analysis
- 11.2.15.4. Recent Developments
- 11.2.15.5. Financials (Based on Availability)
- 11.2.1 ZeroFOX
List of Figures
- Figure 1: Global Digital Risk Protection Solutions Revenue Breakdown (million, %) by Region 2024 & 2032
- Figure 2: North America Digital Risk Protection Solutions Revenue (million), by Application 2024 & 2032
- Figure 3: North America Digital Risk Protection Solutions Revenue Share (%), by Application 2024 & 2032
- Figure 4: North America Digital Risk Protection Solutions Revenue (million), by Types 2024 & 2032
- Figure 5: North America Digital Risk Protection Solutions Revenue Share (%), by Types 2024 & 2032
- Figure 6: North America Digital Risk Protection Solutions Revenue (million), by Country 2024 & 2032
- Figure 7: North America Digital Risk Protection Solutions Revenue Share (%), by Country 2024 & 2032
- Figure 8: South America Digital Risk Protection Solutions Revenue (million), by Application 2024 & 2032
- Figure 9: South America Digital Risk Protection Solutions Revenue Share (%), by Application 2024 & 2032
- Figure 10: South America Digital Risk Protection Solutions Revenue (million), by Types 2024 & 2032
- Figure 11: South America Digital Risk Protection Solutions Revenue Share (%), by Types 2024 & 2032
- Figure 12: South America Digital Risk Protection Solutions Revenue (million), by Country 2024 & 2032
- Figure 13: South America Digital Risk Protection Solutions Revenue Share (%), by Country 2024 & 2032
- Figure 14: Europe Digital Risk Protection Solutions Revenue (million), by Application 2024 & 2032
- Figure 15: Europe Digital Risk Protection Solutions Revenue Share (%), by Application 2024 & 2032
- Figure 16: Europe Digital Risk Protection Solutions Revenue (million), by Types 2024 & 2032
- Figure 17: Europe Digital Risk Protection Solutions Revenue Share (%), by Types 2024 & 2032
- Figure 18: Europe Digital Risk Protection Solutions Revenue (million), by Country 2024 & 2032
- Figure 19: Europe Digital Risk Protection Solutions Revenue Share (%), by Country 2024 & 2032
- Figure 20: Middle East & Africa Digital Risk Protection Solutions Revenue (million), by Application 2024 & 2032
- Figure 21: Middle East & Africa Digital Risk Protection Solutions Revenue Share (%), by Application 2024 & 2032
- Figure 22: Middle East & Africa Digital Risk Protection Solutions Revenue (million), by Types 2024 & 2032
- Figure 23: Middle East & Africa Digital Risk Protection Solutions Revenue Share (%), by Types 2024 & 2032
- Figure 24: Middle East & Africa Digital Risk Protection Solutions Revenue (million), by Country 2024 & 2032
- Figure 25: Middle East & Africa Digital Risk Protection Solutions Revenue Share (%), by Country 2024 & 2032
- Figure 26: Asia Pacific Digital Risk Protection Solutions Revenue (million), by Application 2024 & 2032
- Figure 27: Asia Pacific Digital Risk Protection Solutions Revenue Share (%), by Application 2024 & 2032
- Figure 28: Asia Pacific Digital Risk Protection Solutions Revenue (million), by Types 2024 & 2032
- Figure 29: Asia Pacific Digital Risk Protection Solutions Revenue Share (%), by Types 2024 & 2032
- Figure 30: Asia Pacific Digital Risk Protection Solutions Revenue (million), by Country 2024 & 2032
- Figure 31: Asia Pacific Digital Risk Protection Solutions Revenue Share (%), by Country 2024 & 2032
List of Tables
- Table 1: Global Digital Risk Protection Solutions Revenue million Forecast, by Region 2019 & 2032
- Table 2: Global Digital Risk Protection Solutions Revenue million Forecast, by Application 2019 & 2032
- Table 3: Global Digital Risk Protection Solutions Revenue million Forecast, by Types 2019 & 2032
- Table 4: Global Digital Risk Protection Solutions Revenue million Forecast, by Region 2019 & 2032
- Table 5: Global Digital Risk Protection Solutions Revenue million Forecast, by Application 2019 & 2032
- Table 6: Global Digital Risk Protection Solutions Revenue million Forecast, by Types 2019 & 2032
- Table 7: Global Digital Risk Protection Solutions Revenue million Forecast, by Country 2019 & 2032
- Table 8: United States Digital Risk Protection Solutions Revenue (million) Forecast, by Application 2019 & 2032
- Table 9: Canada Digital Risk Protection Solutions Revenue (million) Forecast, by Application 2019 & 2032
- Table 10: Mexico Digital Risk Protection Solutions Revenue (million) Forecast, by Application 2019 & 2032
- Table 11: Global Digital Risk Protection Solutions Revenue million Forecast, by Application 2019 & 2032
- Table 12: Global Digital Risk Protection Solutions Revenue million Forecast, by Types 2019 & 2032
- Table 13: Global Digital Risk Protection Solutions Revenue million Forecast, by Country 2019 & 2032
- Table 14: Brazil Digital Risk Protection Solutions Revenue (million) Forecast, by Application 2019 & 2032
- Table 15: Argentina Digital Risk Protection Solutions Revenue (million) Forecast, by Application 2019 & 2032
- Table 16: Rest of South America Digital Risk Protection Solutions Revenue (million) Forecast, by Application 2019 & 2032
- Table 17: Global Digital Risk Protection Solutions Revenue million Forecast, by Application 2019 & 2032
- Table 18: Global Digital Risk Protection Solutions Revenue million Forecast, by Types 2019 & 2032
- Table 19: Global Digital Risk Protection Solutions Revenue million Forecast, by Country 2019 & 2032
- Table 20: United Kingdom Digital Risk Protection Solutions Revenue (million) Forecast, by Application 2019 & 2032
- Table 21: Germany Digital Risk Protection Solutions Revenue (million) Forecast, by Application 2019 & 2032
- Table 22: France Digital Risk Protection Solutions Revenue (million) Forecast, by Application 2019 & 2032
- Table 23: Italy Digital Risk Protection Solutions Revenue (million) Forecast, by Application 2019 & 2032
- Table 24: Spain Digital Risk Protection Solutions Revenue (million) Forecast, by Application 2019 & 2032
- Table 25: Russia Digital Risk Protection Solutions Revenue (million) Forecast, by Application 2019 & 2032
- Table 26: Benelux Digital Risk Protection Solutions Revenue (million) Forecast, by Application 2019 & 2032
- Table 27: Nordics Digital Risk Protection Solutions Revenue (million) Forecast, by Application 2019 & 2032
- Table 28: Rest of Europe Digital Risk Protection Solutions Revenue (million) Forecast, by Application 2019 & 2032
- Table 29: Global Digital Risk Protection Solutions Revenue million Forecast, by Application 2019 & 2032
- Table 30: Global Digital Risk Protection Solutions Revenue million Forecast, by Types 2019 & 2032
- Table 31: Global Digital Risk Protection Solutions Revenue million Forecast, by Country 2019 & 2032
- Table 32: Turkey Digital Risk Protection Solutions Revenue (million) Forecast, by Application 2019 & 2032
- Table 33: Israel Digital Risk Protection Solutions Revenue (million) Forecast, by Application 2019 & 2032
- Table 34: GCC Digital Risk Protection Solutions Revenue (million) Forecast, by Application 2019 & 2032
- Table 35: North Africa Digital Risk Protection Solutions Revenue (million) Forecast, by Application 2019 & 2032
- Table 36: South Africa Digital Risk Protection Solutions Revenue (million) Forecast, by Application 2019 & 2032
- Table 37: Rest of Middle East & Africa Digital Risk Protection Solutions Revenue (million) Forecast, by Application 2019 & 2032
- Table 38: Global Digital Risk Protection Solutions Revenue million Forecast, by Application 2019 & 2032
- Table 39: Global Digital Risk Protection Solutions Revenue million Forecast, by Types 2019 & 2032
- Table 40: Global Digital Risk Protection Solutions Revenue million Forecast, by Country 2019 & 2032
- Table 41: China Digital Risk Protection Solutions Revenue (million) Forecast, by Application 2019 & 2032
- Table 42: India Digital Risk Protection Solutions Revenue (million) Forecast, by Application 2019 & 2032
- Table 43: Japan Digital Risk Protection Solutions Revenue (million) Forecast, by Application 2019 & 2032
- Table 44: South Korea Digital Risk Protection Solutions Revenue (million) Forecast, by Application 2019 & 2032
- Table 45: ASEAN Digital Risk Protection Solutions Revenue (million) Forecast, by Application 2019 & 2032
- Table 46: Oceania Digital Risk Protection Solutions Revenue (million) Forecast, by Application 2019 & 2032
- Table 47: Rest of Asia Pacific Digital Risk Protection Solutions Revenue (million) Forecast, by Application 2019 & 2032
Frequently Asked Questions
1. What is the projected Compound Annual Growth Rate (CAGR) of the Digital Risk Protection Solutions?
The projected CAGR is approximately XX%.
2. Which companies are prominent players in the Digital Risk Protection Solutions?
Key companies in the market include ZeroFOX, Proofpoint, Digital Shadows, Recorded Future, RiskIQ, IntSights, Axur, Cyberint, SKURIO, SafeGuard Cyber (Social SafeGuard), Blueliv, AppGate (Cyxtera), Sweepatic, CTM360, Cybersprint.
3. What are the main segments of the Digital Risk Protection Solutions?
The market segments include Application, Types.
4. Can you provide details about the market size?
The market size is estimated to be USD XXX million as of 2022.
5. What are some drivers contributing to market growth?
N/A
6. What are the notable trends driving market growth?
N/A
7. Are there any restraints impacting market growth?
N/A
8. Can you provide examples of recent developments in the market?
N/A
9. What pricing options are available for accessing the report?
Pricing options include single-user, multi-user, and enterprise licenses priced at USD 4900.00, USD 7350.00, and USD 9800.00 respectively.
10. Is the market size provided in terms of value or volume?
The market size is provided in terms of value, measured in million.
11. Are there any specific market keywords associated with the report?
Yes, the market keyword associated with the report is "Digital Risk Protection Solutions," which aids in identifying and referencing the specific market segment covered.
12. How do I determine which pricing option suits my needs best?
The pricing options vary based on user requirements and access needs. Individual users may opt for single-user licenses, while businesses requiring broader access may choose multi-user or enterprise licenses for cost-effective access to the report.
13. Are there any additional resources or data provided in the Digital Risk Protection Solutions report?
While the report offers comprehensive insights, it's advisable to review the specific contents or supplementary materials provided to ascertain if additional resources or data are available.
14. How can I stay updated on further developments or reports in the Digital Risk Protection Solutions?
To stay informed about further developments, trends, and reports in the Digital Risk Protection Solutions, consider subscribing to industry newsletters, following relevant companies and organizations, or regularly checking reputable industry news sources and publications.
Methodology
Step 1 - Identification of Relevant Samples Size from Population Database


Step 2 - Approaches for Defining Global Market Size (Value, Volume* & Price*)

Note*: In applicable scenarios
Step 3 - Data Sources
Primary Research
- Web Analytics
- Survey Reports
- Research Institute
- Latest Research Reports
- Opinion Leaders
Secondary Research
- Annual Reports
- White Paper
- Latest Press Release
- Industry Association
- Paid Database
- Investor Presentations

Step 4 - Data Triangulation
Involves using different sources of information in order to increase the validity of a study
These sources are likely to be stakeholders in a program - participants, other researchers, program staff, other community members, and so on.
Then we put all data in single framework & apply various statistical tools to find out the dynamic on the market.
During the analysis stage, feedback from the stakeholder groups would be compared to determine areas of agreement as well as areas of divergence


