
Key Insights
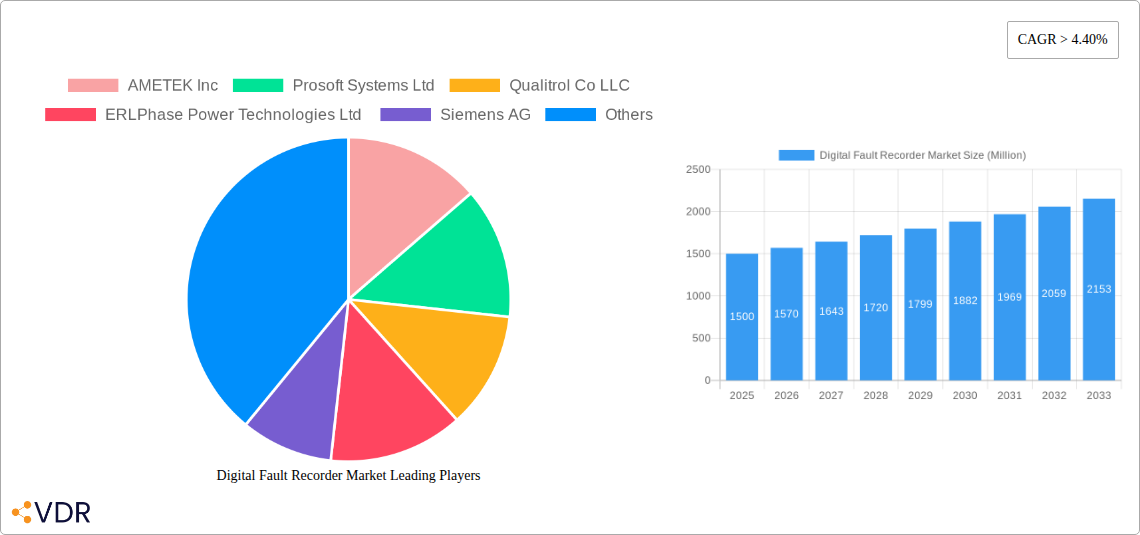
The Digital Fault Recorder (DFR) market is experiencing robust growth, driven by the increasing demand for reliable and efficient power grids globally. The market's expansion is fueled by several key factors, including the rising adoption of smart grids, stringent regulations for grid stability and safety, and the growing need for advanced fault analysis capabilities. The integration of DFRs within power generation, transmission, and distribution systems enhances grid monitoring and protection, minimizing downtime and improving overall grid resilience. The market is segmented into dedicated and multifunctional DFRs, catering to diverse needs and budgets. Dedicated DFRs offer specialized functionality, while multifunctional systems provide a broader range of features, often integrated with other grid monitoring equipment. Geographically, North America and Europe currently hold significant market shares due to established infrastructure and stringent regulatory environments. However, the Asia-Pacific region is poised for substantial growth, driven by rapid industrialization and investments in modernizing power grids. The competitive landscape is characterized by a mix of established players and emerging technology providers, with continuous innovation in areas such as data analytics, cybersecurity, and communication protocols shaping the market dynamics. The high initial investment costs of DFR systems can be a restraining factor for some utilities, especially in developing economies. However, the long-term benefits of improved grid reliability and reduced operational costs are increasingly outweighing these initial investments. We project continued market expansion with a Compound Annual Growth Rate (CAGR) exceeding 4.40% through 2033.
The projected growth trajectory of the DFR market is further bolstered by ongoing advancements in communication technologies, enabling real-time data acquisition and remote monitoring capabilities. This improves response times to faults and facilitates proactive maintenance, significantly reducing operational expenses. Furthermore, the increasing adoption of renewable energy sources, such as solar and wind power, necessitates advanced monitoring and protection solutions like DFRs to maintain grid stability and ensure seamless integration. The growing focus on data analytics and machine learning enhances the predictive capabilities of DFR systems, enabling utilities to anticipate potential faults and implement preventive measures. This shift towards predictive maintenance is further driving market demand. While competition is intense, the market offers ample opportunities for companies that can develop innovative, cost-effective solutions with enhanced cybersecurity features, particularly for applications within smart grids and advanced metering infrastructure.
Digital Fault Recorder Market Report: 2019-2033
This comprehensive report provides an in-depth analysis of the Digital Fault Recorder market, encompassing market dynamics, growth trends, regional analysis, product landscape, key players, and future outlook. The study period covers 2019-2033, with 2025 as the base and estimated year. The forecast period extends from 2025 to 2033, while the historical period analyzed is 2019-2024. The report segments the market by type (Dedicated, Multifunctional) and installation (Generation, Transmission, Distribution), providing a granular understanding of this vital sector within the broader power systems and industrial automation markets. The total market size in 2025 is estimated at XX Million units.
Digital Fault Recorder Market Market Dynamics & Structure
The Digital Fault Recorder market is characterized by moderate concentration, with key players such as AMETEK Inc, Prosoft Systems Ltd, Qualitrol Co LLC, ERLPhase Power Technologies Ltd, Siemens AG, Elspec LTD, GE Grid Solutions LLC, KoCoS Messtechnik AG, Kinkei System Corp, and Ducati Energia SpA holding significant market share. Technological innovation, particularly in advanced analytics and communication protocols, is a major driver. Stringent regulatory frameworks emphasizing grid reliability and safety contribute to market growth. Competitive substitutes include legacy relay protection systems, but the superior data acquisition and analysis capabilities of digital recorders drive market adoption. End-users include power generation companies, transmission system operators, distribution utilities, and industrial facilities. The market has witnessed a few M&A activities in recent years, with approximately xx deals recorded between 2019 and 2024, resulting in a consolidation of xx% market share amongst the top 5 players.
- Market Concentration: Moderately concentrated, with top 5 players holding xx% market share in 2024.
- Innovation Drivers: Advanced analytics, improved communication protocols (e.g., IEC 61850), and integration with smart grid technologies.
- Regulatory Landscape: Stringent regulations on grid reliability and safety compliance in many countries drive demand.
- Competitive Substitutes: Legacy relay protection systems.
- End-User Demographics: Power generation, transmission & distribution utilities, and industrial facilities.
- M&A Trends: xx M&A deals between 2019-2024, leading to xx% market share consolidation amongst the top 5 players. Innovation barriers include high initial investment costs and the complexity of integration with existing infrastructure.
Digital Fault Recorder Market Growth Trends & Insights
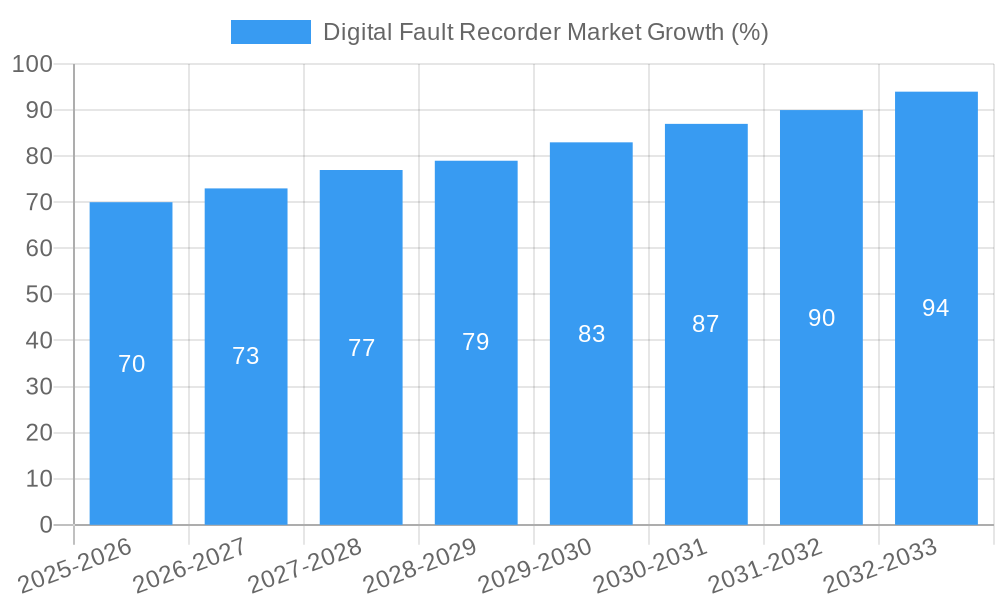
The Digital Fault Recorder market experienced robust growth between 2019 and 2024, driven by increasing investments in grid modernization, renewable energy integration, and the demand for improved grid stability and resilience. The market size grew from xx Million units in 2019 to xx Million units in 2024, registering a CAGR of xx%. This growth is fueled by the rising adoption of smart grid technologies and the need for advanced fault analysis capabilities. Technological advancements, such as the incorporation of AI and machine learning for predictive maintenance, are further accelerating market expansion. Consumer behavior shifts towards greater emphasis on grid reliability and safety are also contributing factors. The market penetration rate is projected to increase from xx% in 2024 to xx% by 2033. The shift toward digitalization in the power sector is expected to sustain strong growth through the forecast period. Factors like increasing automation and smart grid initiatives in emerging economies will boost demand, while cyber security concerns may present some limitations.
Dominant Regions, Countries, or Segments in Digital Fault Recorder Market
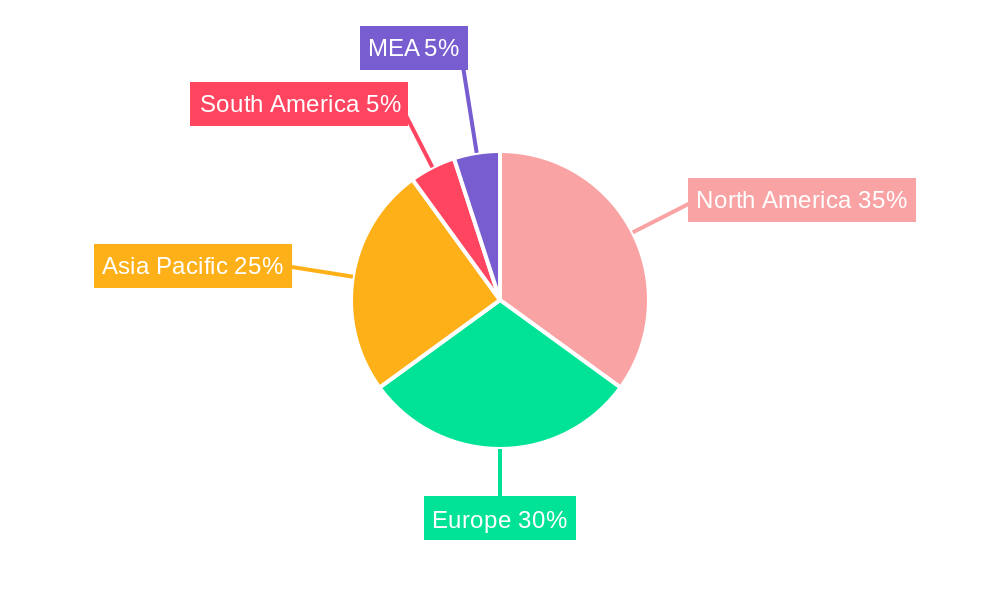
North America currently dominates the Digital Fault Recorder market, driven by strong regulatory frameworks, significant investments in grid infrastructure upgrades, and the early adoption of smart grid technologies. Within North America, the United States holds the largest market share due to its extensive power grid and robust investments in renewable energy integration. Europe follows as a significant market, with countries like Germany and France leading due to their advanced power grids and proactive regulatory initiatives. The Asia-Pacific region exhibits the fastest growth rate, driven by rapid industrialization and urbanization, coupled with increasing investments in renewable energy and grid modernization across several countries. In terms of segments, the Dedicated type Digital Fault Recorders hold a larger market share due to their specialized functionalities and higher accuracy. Within installation segments, the Transmission and Generation sectors drive the highest demand due to the critical nature of these segments and higher operational costs associated with faults.
- North America: Dominant region due to regulatory drivers and investments in grid modernization.
- Europe: Significant market driven by advanced power grids and regulatory initiatives.
- Asia-Pacific: Fastest-growing region fueled by rapid industrialization and renewable energy investments.
- Segment Dominance: Dedicated type recorders hold a larger market share, followed by Multifunctional type.
- Installation Dominance: Transmission and Generation segments have the highest demand.
Digital Fault Recorder Market Product Landscape
Digital fault recorders have evolved significantly, incorporating advanced features such as improved data acquisition capabilities, sophisticated data analysis algorithms, and enhanced communication protocols. These recorders offer real-time monitoring and analysis, providing valuable insights for grid operators and maintenance personnel. The integration of GPS, improved data storage capacity, and enhanced user interfaces have significantly enhanced their usability and effectiveness. Unique selling propositions include precise fault location identification, advanced waveform analysis, and seamless integration with SCADA systems. Technological advancements in data analytics and machine learning are enabling predictive maintenance capabilities, further improving grid reliability and reducing downtime.
Key Drivers, Barriers & Challenges in Digital Fault Recorder Market
Key Drivers:
- Increasing investments in grid modernization and smart grid technologies.
- Stringent regulatory requirements for grid reliability and safety.
- Growing demand for advanced fault analysis capabilities.
- Rising adoption of renewable energy sources.
Key Challenges:
- High initial investment costs associated with digital recorder installations.
- Complex integration with existing infrastructure and legacy systems, potentially resulting in higher implementation costs for legacy systems and slow market penetration.
- Cyber security concerns related to data protection and system vulnerability. Cybersecurity threats can lead to system outages and data breaches, resulting in significant financial and reputational damage. This factor negatively affects market growth.
- Competition from legacy protection systems.
Emerging Opportunities in Digital Fault Recorder Market
The increasing adoption of renewable energy sources creates significant opportunities for Digital Fault Recorders. Advanced analytical features, supporting predictive maintenance, will become increasingly crucial. The integration of these recorders into smart grids opens opportunities for data-driven decision-making and optimized grid operation. Furthermore, untapped markets in developing economies with rapidly expanding power grids offer considerable potential for market expansion. New application areas such as microgrids and distributed generation will also drive demand.
Growth Accelerators in the Digital Fault Recorder Market Industry
Technological breakthroughs in areas such as AI and machine learning are key growth accelerators. Strategic partnerships between equipment manufacturers and grid operators can facilitate faster adoption and market penetration. Market expansion strategies targeting emerging markets with significant investments in grid infrastructure will drive future growth. The development of cost-effective solutions is essential for wider adoption and market penetration in price-sensitive markets.
Key Players Shaping the Digital Fault Recorder Market Market
- AMETEK Inc
- Prosoft Systems Ltd
- Qualitrol Co LLC
- ERLPhase Power Technologies Ltd
- Siemens AG
- Elspec LTD
- GE Grid Solutions LLC
- KoCoS Messtechnik AG
- Kinkei System Corp
- Ducati Energia SpA
Notable Milestones in Digital Fault Recorder Market Sector
- 2020: Introduction of AI-powered fault analysis algorithms by AMETEK Inc.
- 2022: Partnership between Siemens AG and a major utility for large-scale deployment of digital fault recorders.
- 2023: Launch of a new generation of cyber-secure digital fault recorders by GE Grid Solutions.
In-Depth Digital Fault Recorder Market Market Outlook
The Digital Fault Recorder market is poised for continued robust growth over the next decade. Technological advancements, coupled with expanding grid modernization initiatives and increasing demand for reliable power supply will drive future market expansion. Strategic partnerships and focused market expansion strategies into developing economies will be critical for capturing substantial market share and maximizing long-term growth potential. The adoption of advanced analytics and improved cybersecurity measures will remain key for sustained growth and customer confidence.
Digital Fault Recorder Market Segmentation
-
1. Type
- 1.1. Dedicated
- 1.2. Multifunctional
-
2. Installation
- 2.1. Generation
- 2.2. Transmission
- 2.3. Distribution
Digital Fault Recorder Market Segmentation By Geography
- 1. North America
- 2. Europe
- 3. Asia Pacific
- 4. Middle East and Africa
- 5. South America
Digital Fault Recorder Market REPORT HIGHLIGHTS
| Aspects | Details |
|---|---|
| Study Period | 2019-2033 |
| Base Year | 2024 |
| Estimated Year | 2025 |
| Forecast Period | 2025-2033 |
| Historical Period | 2019-2024 |
| Growth Rate | CAGR of > 4.40% from 2019-2033 |
| Segmentation |
|
Table of Contents
- 1. Introduction
- 1.1. Research Scope
- 1.2. Market Segmentation
- 1.3. Research Methodology
- 1.4. Definitions and Assumptions
- 2. Executive Summary
- 2.1. Introduction
- 3. Market Dynamics
- 3.1. Introduction
- 3.2. Market Drivers
- 3.2.1. Increased Spending by Oil and Gas Companies for Reliable Protected Networks; Increased demand for natural gas and the upgradation of refineries; Rising Political Instability in the Region; Pipelines for the Transportation of Crude Oils to Drive the Demand
- 3.3. Market Restrains
- 3.3.1. High Installation & Maintenance Cost; Distributed Site Locations
- 3.4. Market Trends
- 3.4.1. Transmission Segment to Dominate the Market
- 4. Market Factor Analysis
- 4.1. Porters Five Forces
- 4.2. Supply/Value Chain
- 4.3. PESTEL analysis
- 4.4. Market Entropy
- 4.5. Patent/Trademark Analysis
- 5. Global Digital Fault Recorder Market Analysis, Insights and Forecast, 2019-2031
- 5.1. Market Analysis, Insights and Forecast - by Type
- 5.1.1. Dedicated
- 5.1.2. Multifunctional
- 5.2. Market Analysis, Insights and Forecast - by Installation
- 5.2.1. Generation
- 5.2.2. Transmission
- 5.2.3. Distribution
- 5.3. Market Analysis, Insights and Forecast - by Region
- 5.3.1. North America
- 5.3.2. Europe
- 5.3.3. Asia Pacific
- 5.3.4. Middle East and Africa
- 5.3.5. South America
- 5.1. Market Analysis, Insights and Forecast - by Type
- 6. North America Digital Fault Recorder Market Analysis, Insights and Forecast, 2019-2031
- 6.1. Market Analysis, Insights and Forecast - by Type
- 6.1.1. Dedicated
- 6.1.2. Multifunctional
- 6.2. Market Analysis, Insights and Forecast - by Installation
- 6.2.1. Generation
- 6.2.2. Transmission
- 6.2.3. Distribution
- 6.1. Market Analysis, Insights and Forecast - by Type
- 7. Europe Digital Fault Recorder Market Analysis, Insights and Forecast, 2019-2031
- 7.1. Market Analysis, Insights and Forecast - by Type
- 7.1.1. Dedicated
- 7.1.2. Multifunctional
- 7.2. Market Analysis, Insights and Forecast - by Installation
- 7.2.1. Generation
- 7.2.2. Transmission
- 7.2.3. Distribution
- 7.1. Market Analysis, Insights and Forecast - by Type
- 8. Asia Pacific Digital Fault Recorder Market Analysis, Insights and Forecast, 2019-2031
- 8.1. Market Analysis, Insights and Forecast - by Type
- 8.1.1. Dedicated
- 8.1.2. Multifunctional
- 8.2. Market Analysis, Insights and Forecast - by Installation
- 8.2.1. Generation
- 8.2.2. Transmission
- 8.2.3. Distribution
- 8.1. Market Analysis, Insights and Forecast - by Type
- 9. Middle East and Africa Digital Fault Recorder Market Analysis, Insights and Forecast, 2019-2031
- 9.1. Market Analysis, Insights and Forecast - by Type
- 9.1.1. Dedicated
- 9.1.2. Multifunctional
- 9.2. Market Analysis, Insights and Forecast - by Installation
- 9.2.1. Generation
- 9.2.2. Transmission
- 9.2.3. Distribution
- 9.1. Market Analysis, Insights and Forecast - by Type
- 10. South America Digital Fault Recorder Market Analysis, Insights and Forecast, 2019-2031
- 10.1. Market Analysis, Insights and Forecast - by Type
- 10.1.1. Dedicated
- 10.1.2. Multifunctional
- 10.2. Market Analysis, Insights and Forecast - by Installation
- 10.2.1. Generation
- 10.2.2. Transmission
- 10.2.3. Distribution
- 10.1. Market Analysis, Insights and Forecast - by Type
- 11. North America Digital Fault Recorder Market Analysis, Insights and Forecast, 2019-2031
- 11.1. Market Analysis, Insights and Forecast - By Country/Sub-region
- 11.1.1 United States
- 11.1.2 Canada
- 11.1.3 Mexico
- 12. Europe Digital Fault Recorder Market Analysis, Insights and Forecast, 2019-2031
- 12.1. Market Analysis, Insights and Forecast - By Country/Sub-region
- 12.1.1 Germany
- 12.1.2 United Kingdom
- 12.1.3 France
- 12.1.4 Spain
- 12.1.5 Italy
- 12.1.6 Spain
- 12.1.7 Belgium
- 12.1.8 Netherland
- 12.1.9 Nordics
- 12.1.10 Rest of Europe
- 13. Asia Pacific Digital Fault Recorder Market Analysis, Insights and Forecast, 2019-2031
- 13.1. Market Analysis, Insights and Forecast - By Country/Sub-region
- 13.1.1 China
- 13.1.2 Japan
- 13.1.3 India
- 13.1.4 South Korea
- 13.1.5 Southeast Asia
- 13.1.6 Australia
- 13.1.7 Indonesia
- 13.1.8 Phillipes
- 13.1.9 Singapore
- 13.1.10 Thailandc
- 13.1.11 Rest of Asia Pacific
- 14. South America Digital Fault Recorder Market Analysis, Insights and Forecast, 2019-2031
- 14.1. Market Analysis, Insights and Forecast - By Country/Sub-region
- 14.1.1 Brazil
- 14.1.2 Argentina
- 14.1.3 Peru
- 14.1.4 Chile
- 14.1.5 Colombia
- 14.1.6 Ecuador
- 14.1.7 Venezuela
- 14.1.8 Rest of South America
- 15. North America Digital Fault Recorder Market Analysis, Insights and Forecast, 2019-2031
- 15.1. Market Analysis, Insights and Forecast - By Country/Sub-region
- 15.1.1 United States
- 15.1.2 Canada
- 15.1.3 Mexico
- 16. MEA Digital Fault Recorder Market Analysis, Insights and Forecast, 2019-2031
- 16.1. Market Analysis, Insights and Forecast - By Country/Sub-region
- 16.1.1 United Arab Emirates
- 16.1.2 Saudi Arabia
- 16.1.3 South Africa
- 16.1.4 Rest of Middle East and Africa
- 17. Competitive Analysis
- 17.1. Global Market Share Analysis 2024
- 17.2. Company Profiles
- 17.2.1 AMETEK Inc
- 17.2.1.1. Overview
- 17.2.1.2. Products
- 17.2.1.3. SWOT Analysis
- 17.2.1.4. Recent Developments
- 17.2.1.5. Financials (Based on Availability)
- 17.2.2 Prosoft Systems Ltd
- 17.2.2.1. Overview
- 17.2.2.2. Products
- 17.2.2.3. SWOT Analysis
- 17.2.2.4. Recent Developments
- 17.2.2.5. Financials (Based on Availability)
- 17.2.3 Qualitrol Co LLC
- 17.2.3.1. Overview
- 17.2.3.2. Products
- 17.2.3.3. SWOT Analysis
- 17.2.3.4. Recent Developments
- 17.2.3.5. Financials (Based on Availability)
- 17.2.4 ERLPhase Power Technologies Ltd
- 17.2.4.1. Overview
- 17.2.4.2. Products
- 17.2.4.3. SWOT Analysis
- 17.2.4.4. Recent Developments
- 17.2.4.5. Financials (Based on Availability)
- 17.2.5 Siemens AG
- 17.2.5.1. Overview
- 17.2.5.2. Products
- 17.2.5.3. SWOT Analysis
- 17.2.5.4. Recent Developments
- 17.2.5.5. Financials (Based on Availability)
- 17.2.6 Elspec LTD
- 17.2.6.1. Overview
- 17.2.6.2. Products
- 17.2.6.3. SWOT Analysis
- 17.2.6.4. Recent Developments
- 17.2.6.5. Financials (Based on Availability)
- 17.2.7 GE Grid Solutions LLC
- 17.2.7.1. Overview
- 17.2.7.2. Products
- 17.2.7.3. SWOT Analysis
- 17.2.7.4. Recent Developments
- 17.2.7.5. Financials (Based on Availability)
- 17.2.8 KoCoS Messtechnik AG 2020
- 17.2.8.1. Overview
- 17.2.8.2. Products
- 17.2.8.3. SWOT Analysis
- 17.2.8.4. Recent Developments
- 17.2.8.5. Financials (Based on Availability)
- 17.2.9 Kinkei System Corp
- 17.2.9.1. Overview
- 17.2.9.2. Products
- 17.2.9.3. SWOT Analysis
- 17.2.9.4. Recent Developments
- 17.2.9.5. Financials (Based on Availability)
- 17.2.10 Ducati Energia SpA
- 17.2.10.1. Overview
- 17.2.10.2. Products
- 17.2.10.3. SWOT Analysis
- 17.2.10.4. Recent Developments
- 17.2.10.5. Financials (Based on Availability)
- 17.2.1 AMETEK Inc
List of Figures
- Figure 1: Global Digital Fault Recorder Market Revenue Breakdown (Million, %) by Region 2024 & 2032
- Figure 2: North America Digital Fault Recorder Market Revenue (Million), by Country 2024 & 2032
- Figure 3: North America Digital Fault Recorder Market Revenue Share (%), by Country 2024 & 2032
- Figure 4: Europe Digital Fault Recorder Market Revenue (Million), by Country 2024 & 2032
- Figure 5: Europe Digital Fault Recorder Market Revenue Share (%), by Country 2024 & 2032
- Figure 6: Asia Pacific Digital Fault Recorder Market Revenue (Million), by Country 2024 & 2032
- Figure 7: Asia Pacific Digital Fault Recorder Market Revenue Share (%), by Country 2024 & 2032
- Figure 8: South America Digital Fault Recorder Market Revenue (Million), by Country 2024 & 2032
- Figure 9: South America Digital Fault Recorder Market Revenue Share (%), by Country 2024 & 2032
- Figure 10: North America Digital Fault Recorder Market Revenue (Million), by Country 2024 & 2032
- Figure 11: North America Digital Fault Recorder Market Revenue Share (%), by Country 2024 & 2032
- Figure 12: MEA Digital Fault Recorder Market Revenue (Million), by Country 2024 & 2032
- Figure 13: MEA Digital Fault Recorder Market Revenue Share (%), by Country 2024 & 2032
- Figure 14: North America Digital Fault Recorder Market Revenue (Million), by Type 2024 & 2032
- Figure 15: North America Digital Fault Recorder Market Revenue Share (%), by Type 2024 & 2032
- Figure 16: North America Digital Fault Recorder Market Revenue (Million), by Installation 2024 & 2032
- Figure 17: North America Digital Fault Recorder Market Revenue Share (%), by Installation 2024 & 2032
- Figure 18: North America Digital Fault Recorder Market Revenue (Million), by Country 2024 & 2032
- Figure 19: North America Digital Fault Recorder Market Revenue Share (%), by Country 2024 & 2032
- Figure 20: Europe Digital Fault Recorder Market Revenue (Million), by Type 2024 & 2032
- Figure 21: Europe Digital Fault Recorder Market Revenue Share (%), by Type 2024 & 2032
- Figure 22: Europe Digital Fault Recorder Market Revenue (Million), by Installation 2024 & 2032
- Figure 23: Europe Digital Fault Recorder Market Revenue Share (%), by Installation 2024 & 2032
- Figure 24: Europe Digital Fault Recorder Market Revenue (Million), by Country 2024 & 2032
- Figure 25: Europe Digital Fault Recorder Market Revenue Share (%), by Country 2024 & 2032
- Figure 26: Asia Pacific Digital Fault Recorder Market Revenue (Million), by Type 2024 & 2032
- Figure 27: Asia Pacific Digital Fault Recorder Market Revenue Share (%), by Type 2024 & 2032
- Figure 28: Asia Pacific Digital Fault Recorder Market Revenue (Million), by Installation 2024 & 2032
- Figure 29: Asia Pacific Digital Fault Recorder Market Revenue Share (%), by Installation 2024 & 2032
- Figure 30: Asia Pacific Digital Fault Recorder Market Revenue (Million), by Country 2024 & 2032
- Figure 31: Asia Pacific Digital Fault Recorder Market Revenue Share (%), by Country 2024 & 2032
- Figure 32: Middle East and Africa Digital Fault Recorder Market Revenue (Million), by Type 2024 & 2032
- Figure 33: Middle East and Africa Digital Fault Recorder Market Revenue Share (%), by Type 2024 & 2032
- Figure 34: Middle East and Africa Digital Fault Recorder Market Revenue (Million), by Installation 2024 & 2032
- Figure 35: Middle East and Africa Digital Fault Recorder Market Revenue Share (%), by Installation 2024 & 2032
- Figure 36: Middle East and Africa Digital Fault Recorder Market Revenue (Million), by Country 2024 & 2032
- Figure 37: Middle East and Africa Digital Fault Recorder Market Revenue Share (%), by Country 2024 & 2032
- Figure 38: South America Digital Fault Recorder Market Revenue (Million), by Type 2024 & 2032
- Figure 39: South America Digital Fault Recorder Market Revenue Share (%), by Type 2024 & 2032
- Figure 40: South America Digital Fault Recorder Market Revenue (Million), by Installation 2024 & 2032
- Figure 41: South America Digital Fault Recorder Market Revenue Share (%), by Installation 2024 & 2032
- Figure 42: South America Digital Fault Recorder Market Revenue (Million), by Country 2024 & 2032
- Figure 43: South America Digital Fault Recorder Market Revenue Share (%), by Country 2024 & 2032
List of Tables
- Table 1: Global Digital Fault Recorder Market Revenue Million Forecast, by Region 2019 & 2032
- Table 2: Global Digital Fault Recorder Market Revenue Million Forecast, by Type 2019 & 2032
- Table 3: Global Digital Fault Recorder Market Revenue Million Forecast, by Installation 2019 & 2032
- Table 4: Global Digital Fault Recorder Market Revenue Million Forecast, by Region 2019 & 2032
- Table 5: Global Digital Fault Recorder Market Revenue Million Forecast, by Country 2019 & 2032
- Table 6: United States Digital Fault Recorder Market Revenue (Million) Forecast, by Application 2019 & 2032
- Table 7: Canada Digital Fault Recorder Market Revenue (Million) Forecast, by Application 2019 & 2032
- Table 8: Mexico Digital Fault Recorder Market Revenue (Million) Forecast, by Application 2019 & 2032
- Table 9: Global Digital Fault Recorder Market Revenue Million Forecast, by Country 2019 & 2032
- Table 10: Germany Digital Fault Recorder Market Revenue (Million) Forecast, by Application 2019 & 2032
- Table 11: United Kingdom Digital Fault Recorder Market Revenue (Million) Forecast, by Application 2019 & 2032
- Table 12: France Digital Fault Recorder Market Revenue (Million) Forecast, by Application 2019 & 2032
- Table 13: Spain Digital Fault Recorder Market Revenue (Million) Forecast, by Application 2019 & 2032
- Table 14: Italy Digital Fault Recorder Market Revenue (Million) Forecast, by Application 2019 & 2032
- Table 15: Spain Digital Fault Recorder Market Revenue (Million) Forecast, by Application 2019 & 2032
- Table 16: Belgium Digital Fault Recorder Market Revenue (Million) Forecast, by Application 2019 & 2032
- Table 17: Netherland Digital Fault Recorder Market Revenue (Million) Forecast, by Application 2019 & 2032
- Table 18: Nordics Digital Fault Recorder Market Revenue (Million) Forecast, by Application 2019 & 2032
- Table 19: Rest of Europe Digital Fault Recorder Market Revenue (Million) Forecast, by Application 2019 & 2032
- Table 20: Global Digital Fault Recorder Market Revenue Million Forecast, by Country 2019 & 2032
- Table 21: China Digital Fault Recorder Market Revenue (Million) Forecast, by Application 2019 & 2032
- Table 22: Japan Digital Fault Recorder Market Revenue (Million) Forecast, by Application 2019 & 2032
- Table 23: India Digital Fault Recorder Market Revenue (Million) Forecast, by Application 2019 & 2032
- Table 24: South Korea Digital Fault Recorder Market Revenue (Million) Forecast, by Application 2019 & 2032
- Table 25: Southeast Asia Digital Fault Recorder Market Revenue (Million) Forecast, by Application 2019 & 2032
- Table 26: Australia Digital Fault Recorder Market Revenue (Million) Forecast, by Application 2019 & 2032
- Table 27: Indonesia Digital Fault Recorder Market Revenue (Million) Forecast, by Application 2019 & 2032
- Table 28: Phillipes Digital Fault Recorder Market Revenue (Million) Forecast, by Application 2019 & 2032
- Table 29: Singapore Digital Fault Recorder Market Revenue (Million) Forecast, by Application 2019 & 2032
- Table 30: Thailandc Digital Fault Recorder Market Revenue (Million) Forecast, by Application 2019 & 2032
- Table 31: Rest of Asia Pacific Digital Fault Recorder Market Revenue (Million) Forecast, by Application 2019 & 2032
- Table 32: Global Digital Fault Recorder Market Revenue Million Forecast, by Country 2019 & 2032
- Table 33: Brazil Digital Fault Recorder Market Revenue (Million) Forecast, by Application 2019 & 2032
- Table 34: Argentina Digital Fault Recorder Market Revenue (Million) Forecast, by Application 2019 & 2032
- Table 35: Peru Digital Fault Recorder Market Revenue (Million) Forecast, by Application 2019 & 2032
- Table 36: Chile Digital Fault Recorder Market Revenue (Million) Forecast, by Application 2019 & 2032
- Table 37: Colombia Digital Fault Recorder Market Revenue (Million) Forecast, by Application 2019 & 2032
- Table 38: Ecuador Digital Fault Recorder Market Revenue (Million) Forecast, by Application 2019 & 2032
- Table 39: Venezuela Digital Fault Recorder Market Revenue (Million) Forecast, by Application 2019 & 2032
- Table 40: Rest of South America Digital Fault Recorder Market Revenue (Million) Forecast, by Application 2019 & 2032
- Table 41: Global Digital Fault Recorder Market Revenue Million Forecast, by Country 2019 & 2032
- Table 42: United States Digital Fault Recorder Market Revenue (Million) Forecast, by Application 2019 & 2032
- Table 43: Canada Digital Fault Recorder Market Revenue (Million) Forecast, by Application 2019 & 2032
- Table 44: Mexico Digital Fault Recorder Market Revenue (Million) Forecast, by Application 2019 & 2032
- Table 45: Global Digital Fault Recorder Market Revenue Million Forecast, by Country 2019 & 2032
- Table 46: United Arab Emirates Digital Fault Recorder Market Revenue (Million) Forecast, by Application 2019 & 2032
- Table 47: Saudi Arabia Digital Fault Recorder Market Revenue (Million) Forecast, by Application 2019 & 2032
- Table 48: South Africa Digital Fault Recorder Market Revenue (Million) Forecast, by Application 2019 & 2032
- Table 49: Rest of Middle East and Africa Digital Fault Recorder Market Revenue (Million) Forecast, by Application 2019 & 2032
- Table 50: Global Digital Fault Recorder Market Revenue Million Forecast, by Type 2019 & 2032
- Table 51: Global Digital Fault Recorder Market Revenue Million Forecast, by Installation 2019 & 2032
- Table 52: Global Digital Fault Recorder Market Revenue Million Forecast, by Country 2019 & 2032
- Table 53: Global Digital Fault Recorder Market Revenue Million Forecast, by Type 2019 & 2032
- Table 54: Global Digital Fault Recorder Market Revenue Million Forecast, by Installation 2019 & 2032
- Table 55: Global Digital Fault Recorder Market Revenue Million Forecast, by Country 2019 & 2032
- Table 56: Global Digital Fault Recorder Market Revenue Million Forecast, by Type 2019 & 2032
- Table 57: Global Digital Fault Recorder Market Revenue Million Forecast, by Installation 2019 & 2032
- Table 58: Global Digital Fault Recorder Market Revenue Million Forecast, by Country 2019 & 2032
- Table 59: Global Digital Fault Recorder Market Revenue Million Forecast, by Type 2019 & 2032
- Table 60: Global Digital Fault Recorder Market Revenue Million Forecast, by Installation 2019 & 2032
- Table 61: Global Digital Fault Recorder Market Revenue Million Forecast, by Country 2019 & 2032
- Table 62: Global Digital Fault Recorder Market Revenue Million Forecast, by Type 2019 & 2032
- Table 63: Global Digital Fault Recorder Market Revenue Million Forecast, by Installation 2019 & 2032
- Table 64: Global Digital Fault Recorder Market Revenue Million Forecast, by Country 2019 & 2032
Frequently Asked Questions
1. What is the projected Compound Annual Growth Rate (CAGR) of the Digital Fault Recorder Market?
The projected CAGR is approximately > 4.40%.
2. Which companies are prominent players in the Digital Fault Recorder Market?
Key companies in the market include AMETEK Inc, Prosoft Systems Ltd, Qualitrol Co LLC, ERLPhase Power Technologies Ltd , Siemens AG, Elspec LTD, GE Grid Solutions LLC, KoCoS Messtechnik AG 2020, Kinkei System Corp, Ducati Energia SpA.
3. What are the main segments of the Digital Fault Recorder Market?
The market segments include Type, Installation.
4. Can you provide details about the market size?
The market size is estimated to be USD XX Million as of 2022.
5. What are some drivers contributing to market growth?
Increased Spending by Oil and Gas Companies for Reliable Protected Networks; Increased demand for natural gas and the upgradation of refineries; Rising Political Instability in the Region; Pipelines for the Transportation of Crude Oils to Drive the Demand.
6. What are the notable trends driving market growth?
Transmission Segment to Dominate the Market.
7. Are there any restraints impacting market growth?
High Installation & Maintenance Cost; Distributed Site Locations.
8. Can you provide examples of recent developments in the market?
N/A
9. What pricing options are available for accessing the report?
Pricing options include single-user, multi-user, and enterprise licenses priced at USD 4750, USD 5250, and USD 8750 respectively.
10. Is the market size provided in terms of value or volume?
The market size is provided in terms of value, measured in Million.
11. Are there any specific market keywords associated with the report?
Yes, the market keyword associated with the report is "Digital Fault Recorder Market," which aids in identifying and referencing the specific market segment covered.
12. How do I determine which pricing option suits my needs best?
The pricing options vary based on user requirements and access needs. Individual users may opt for single-user licenses, while businesses requiring broader access may choose multi-user or enterprise licenses for cost-effective access to the report.
13. Are there any additional resources or data provided in the Digital Fault Recorder Market report?
While the report offers comprehensive insights, it's advisable to review the specific contents or supplementary materials provided to ascertain if additional resources or data are available.
14. How can I stay updated on further developments or reports in the Digital Fault Recorder Market?
To stay informed about further developments, trends, and reports in the Digital Fault Recorder Market, consider subscribing to industry newsletters, following relevant companies and organizations, or regularly checking reputable industry news sources and publications.
Methodology
Step 1 - Identification of Relevant Samples Size from Population Database


Step 2 - Approaches for Defining Global Market Size (Value, Volume* & Price*)

Note*: In applicable scenarios
Step 3 - Data Sources
Primary Research
- Web Analytics
- Survey Reports
- Research Institute
- Latest Research Reports
- Opinion Leaders
Secondary Research
- Annual Reports
- White Paper
- Latest Press Release
- Industry Association
- Paid Database
- Investor Presentations

Step 4 - Data Triangulation
Involves using different sources of information in order to increase the validity of a study
These sources are likely to be stakeholders in a program - participants, other researchers, program staff, other community members, and so on.
Then we put all data in single framework & apply various statistical tools to find out the dynamic on the market.
During the analysis stage, feedback from the stakeholder groups would be compared to determine areas of agreement as well as areas of divergence


