
Key Insights
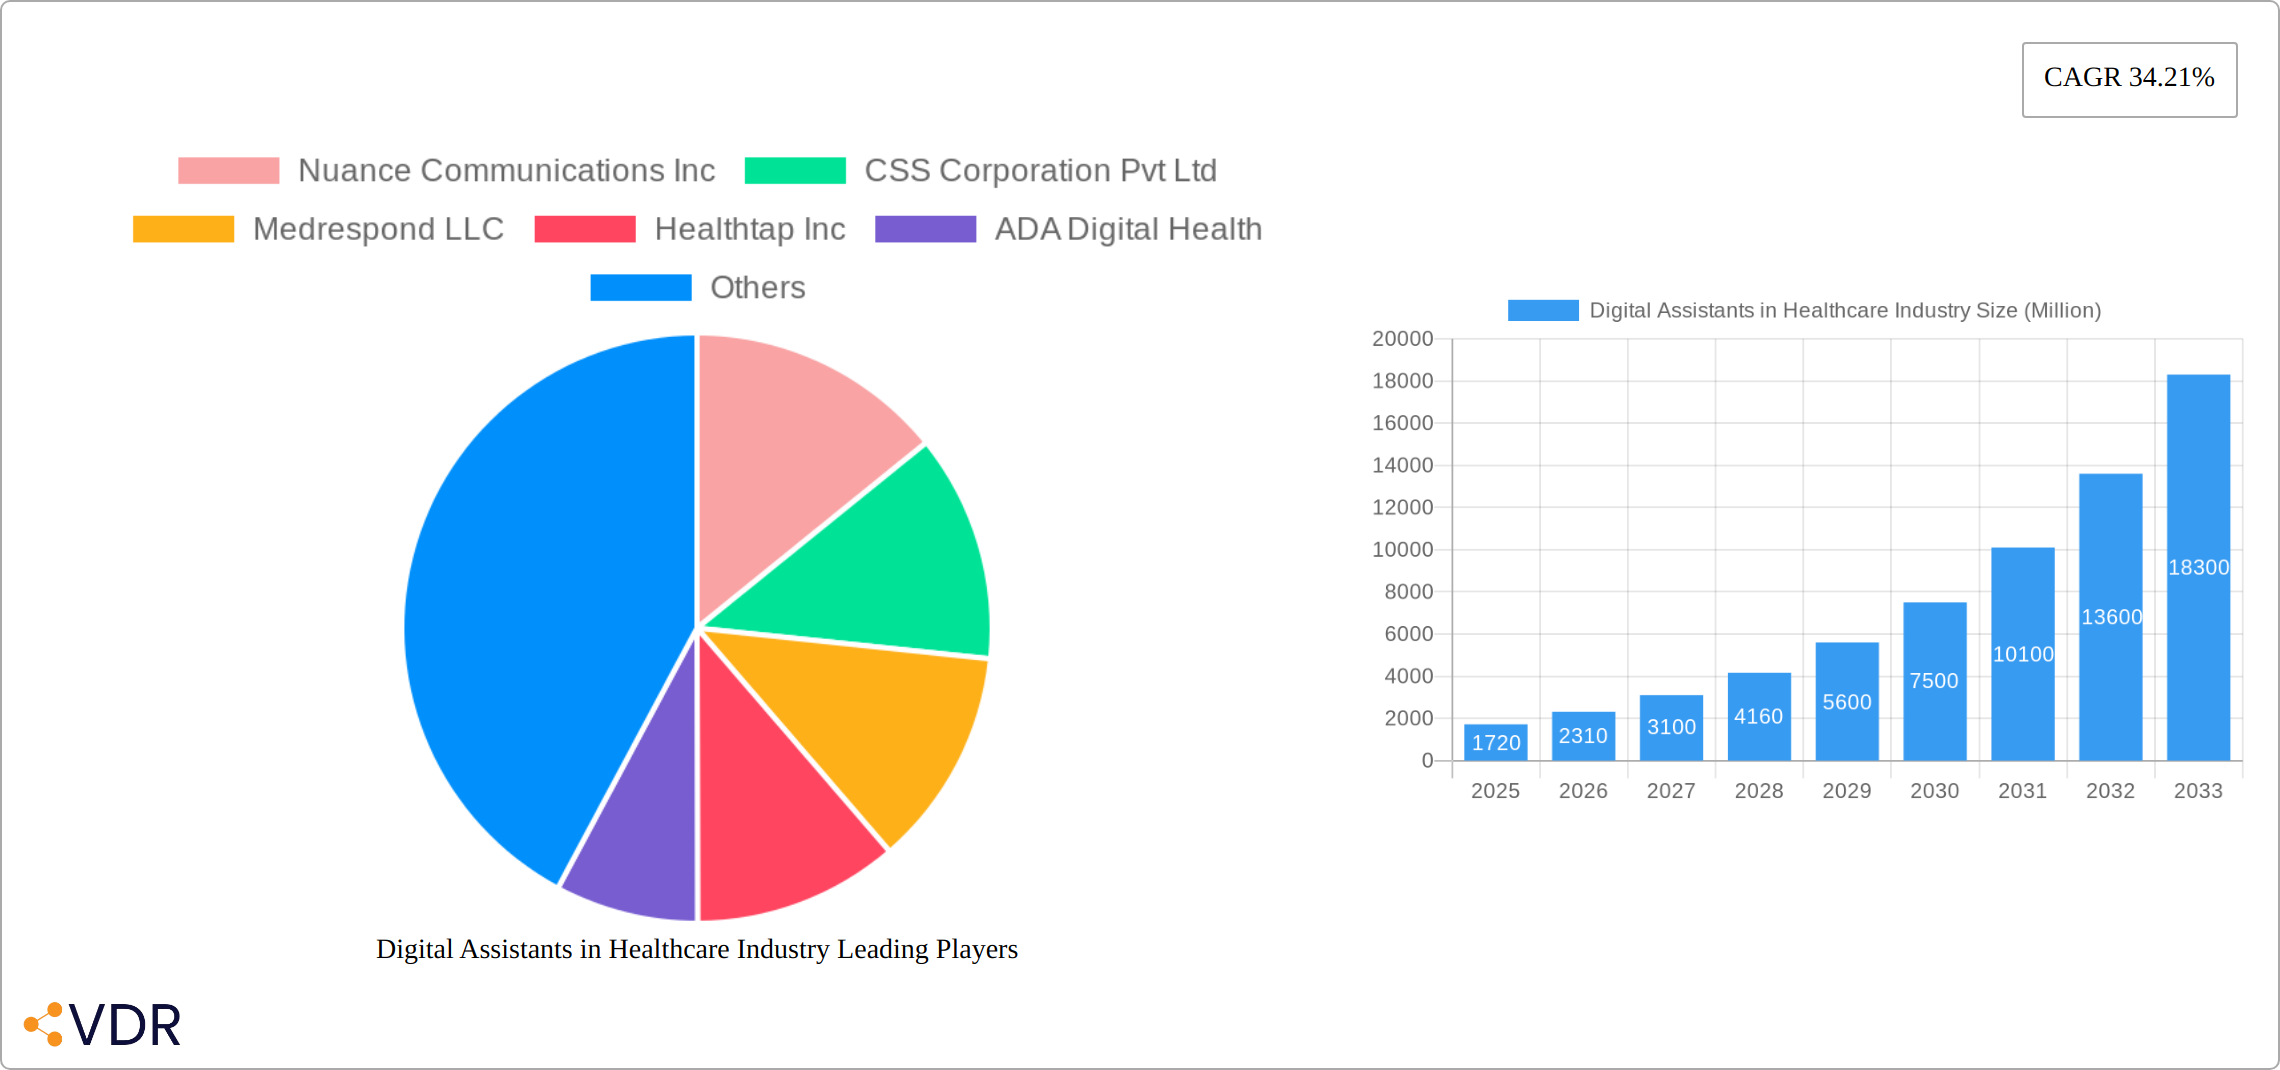
The Digital Assistants in Healthcare market is experiencing explosive growth, projected to reach a value of $1.72 billion in 2025 and exhibiting a remarkable Compound Annual Growth Rate (CAGR) of 34.21%. This expansion is fueled by several key drivers. The increasing adoption of telehealth and remote patient monitoring solutions necessitates efficient and convenient communication channels, making digital assistants an ideal solution. Furthermore, the rising demand for personalized and proactive healthcare, coupled with the growing burden on healthcare professionals, is pushing the adoption of AI-powered tools to streamline workflows and improve patient engagement. Smart speakers, chatbots, and various user interfaces like Automatic Speech Recognition (ASR), Text-to-Speech (TTS), and text-based interactions are transforming how healthcare is delivered. Applications range from simple medical calculators and drug dosage reminders to sophisticated patient tracking systems and diagnostic guides, impacting virtually every segment of the healthcare ecosystem. Key players, including Nuance Communications, Microsoft, and Amazon, are actively investing in and developing advanced capabilities, further accelerating market penetration. While data privacy and security concerns pose some challenges, the overwhelming benefits in terms of efficiency, accessibility, and improved patient outcomes are driving widespread adoption across healthcare providers, payers, and even patients themselves.
The market segmentation reveals significant opportunities across various product types and applications. Smart speakers, with their voice-activated convenience, are gaining traction for simple tasks and medication reminders. Chatbots, on the other hand, excel at handling complex queries and providing personalized medical advice. The regional distribution indicates strong growth across North America and Europe, driven by advanced healthcare infrastructure and early adoption of digital technologies. However, emerging markets in Asia-Pacific and other regions present significant untapped potential, as increasing internet penetration and rising healthcare expenditures create favorable conditions for market expansion. The forecast period (2025-2033) anticipates continued growth, driven by technological advancements, expanding applications, and an increasing focus on improving healthcare accessibility and affordability. While challenges remain, the long-term outlook for the Digital Assistants in Healthcare market remains exceptionally positive.
Digital Assistants in Healthcare Industry: Market Report 2019-2033
This comprehensive report provides a detailed analysis of the Digital Assistants in Healthcare Industry market, encompassing market dynamics, growth trends, regional analysis, product landscape, key players, and future outlook. The study period covers 2019-2033, with 2025 as the base and estimated year, and a forecast period of 2025-2033. This report is crucial for healthcare providers, payers, technology investors, and industry professionals seeking to understand and capitalize on the transformative potential of digital assistants in healthcare. The market is segmented by product (Smart Speakers, Chatbots), user interface (Automatic Speech Recognition, Text-Based, Text-to-Speech), application (Patient Tracking, Medical Reference, Diagnostic Guides, Drug Dosage, Medical Calculators, Nursing Reference, Other Applications), and end-user (Healthcare Providers, Healthcare Payers, Patients, Other End Users). The report estimates the total market size to be xx Million USD in 2025.
Digital Assistants in Healthcare Industry Market Dynamics & Structure
The Digital Assistants in Healthcare Industry market is experiencing robust growth driven by technological advancements, increasing demand for remote healthcare services, and favorable regulatory environments. Market concentration is moderate, with several key players competing for market share. The market is characterized by continuous technological innovation, particularly in AI-powered natural language processing and machine learning algorithms.
Market Structure:
- High Growth Segments: Chatbots and Automatic Speech Recognition interfaces are experiencing the fastest growth, driven by increasing patient adoption and provider integration. Patient tracking and medical reference applications dominate the application segment.
- Market Concentration: The market is moderately concentrated, with top 10 players holding an estimated xx% market share in 2025.
- Technological Innovation: Advancements in AI, machine learning, and natural language processing are continuously improving the accuracy, efficiency, and capabilities of digital assistants in healthcare.
- Regulatory Frameworks: HIPAA compliance and data privacy regulations are key considerations influencing market development. Government initiatives promoting telehealth adoption are also creating growth opportunities.
- Competitive Product Substitutes: Traditional methods of patient interaction and healthcare information access pose competition, although digital assistants offer superior convenience and scalability.
- End-User Demographics: The aging population and increasing prevalence of chronic diseases are driving demand for digital assistants, particularly among elderly and chronically ill patients.
- M&A Trends: The industry has witnessed a moderate number of mergers and acquisitions (xx deals in the past five years), indicating strategic consolidation and growth through integration.
Digital Assistants in Healthcare Industry Growth Trends & Insights
The Digital Assistants in Healthcare Industry market is projected to witness significant growth during the forecast period, driven by several factors. The market experienced a CAGR of xx% during the historical period (2019-2024), indicating a strong upward trend. This growth is expected to continue, with a projected CAGR of xx% during the forecast period (2025-2033). Market penetration rates are increasing steadily, particularly among healthcare providers and patients. Technological disruptions, such as the rise of AI-powered diagnostic tools, are transforming the healthcare landscape and creating new opportunities for digital assistants. Consumer behavior shifts towards digital health solutions and remote monitoring contribute to increased adoption rates. The increasing use of wearables and IoT devices generates valuable patient data that enhances the effectiveness and personalization of digital assistant applications.

Dominant Regions, Countries, or Segments in Digital Assistants in Healthcare Industry
North America currently holds the largest market share in the Digital Assistants in Healthcare Industry, followed by Europe. However, Asia-Pacific is projected to experience the fastest growth rate, driven by increasing healthcare spending, expanding internet penetration, and government initiatives supporting digital health technologies.
Key Drivers of Growth:
- North America: High adoption rates among healthcare providers, strong investment in digital health technologies, and well-established regulatory frameworks.
- Europe: Growing demand for telehealth services, increasing focus on cost-effectiveness in healthcare, and government support for digitalization.
- Asia-Pacific: Rapid economic growth, rising middle class, increasing smartphone penetration, and government initiatives promoting digital health.
Dominant Segments:
- Product: Chatbots are experiencing significant growth due to their ease of integration and wide applicability.
- User Interface: Automatic Speech Recognition is gaining popularity for its user-friendly nature and efficiency.
- Application: Patient tracking and medical reference applications are the most widely adopted, offering valuable functionalities to both patients and healthcare providers.
- End User: Healthcare providers are the primary adopters of digital assistants, utilizing them for enhancing operational efficiency and improving patient care.
Digital Assistants in Healthcare Industry Product Landscape
Digital assistants in healthcare are rapidly evolving, incorporating advanced technologies such as AI, machine learning, and natural language processing. Products range from simple chatbots providing basic medical information to sophisticated virtual assistants capable of performing complex tasks such as patient monitoring, diagnosis support, and medication management. Unique selling propositions include improved accessibility, personalized patient care, increased efficiency, reduced healthcare costs, and enhanced patient satisfaction. Technological advancements continue to drive innovation, leading to the development of more accurate, reliable, and user-friendly digital assistants.
Key Drivers, Barriers & Challenges in Digital Assistants in Healthcare Industry
Key Drivers:
The market is driven by the rising adoption of telehealth, the increasing demand for cost-effective healthcare solutions, and technological advancements. Government initiatives supporting digital health also significantly contribute to market growth. Furthermore, improved patient engagement and convenience offered by digital assistants are key growth drivers.
Challenges and Restraints:
Key challenges include data security and privacy concerns, regulatory hurdles related to data compliance and healthcare standards, and concerns about the accuracy and reliability of AI-powered diagnostic tools. Integration challenges with existing healthcare systems and high implementation costs pose significant barriers. Competition from established players and the need for continuous technological upgrades also present ongoing challenges.
Emerging Opportunities in Digital Assistants in Healthcare Industry
Untapped markets in developing countries, particularly in Asia and Africa, offer significant growth potential. Emerging opportunities include integrating digital assistants with wearable devices and IoT sensors for continuous patient monitoring and personalized healthcare management. Innovative applications, such as AI-powered diagnostic tools and virtual nurses, are rapidly emerging. Evolving consumer preferences towards convenient and personalized healthcare experiences further fuel growth opportunities.
Growth Accelerators in the Digital Assistants in Healthcare Industry Industry
Long-term growth is accelerated by breakthroughs in AI, particularly in natural language processing and machine learning, which enhance the accuracy and capabilities of digital assistants. Strategic partnerships between technology companies and healthcare providers create synergistic opportunities for market expansion. Government initiatives promoting telehealth adoption and increased healthcare investment create a favorable environment for market growth.
Key Players Shaping the Digital Assistants in Healthcare Industry Market
- Nuance Communications Inc
- CSS Corporation Pvt Ltd
- Medrespond LLC
- Healthtap Inc
- ADA Digital Health
- Infermedica Sp z o o
- Microsoft Corporation
- eGain Corporation
- Verint Systems Inc
- True Image Interactive Inc
- Babylon Healthcare Services Limited
- Floatbot AI
- Amazon.com Inc
- Sensely Inc
- Kore AI Inc
Notable Milestones in Digital Assistants in Healthcare Industry Sector
- February 2023: Ada Health and Pfizer launched a digital COVID-19 care journey, improving patient access to information and care.
- October 2022: Babylon Healthcare Services Limited launched a new digital health service in Vietnam, expanding access to healthcare in underserved communities.
In-Depth Digital Assistants in Healthcare Industry Market Outlook
The Digital Assistants in Healthcare Industry market is poised for significant growth in the coming years, driven by ongoing technological advancements, increasing adoption of telehealth, and favorable regulatory environments. Strategic partnerships and investments in AI research will further accelerate market expansion. The continued development of accurate and user-friendly digital assistants holds immense potential for transforming healthcare delivery, improving patient outcomes, and creating new market opportunities for innovative companies.
Digital Assistants in Healthcare Industry Segmentation
-
1. Product
- 1.1. Smart Speakers
- 1.2. Chatbots
-
2. User Interface
- 2.1. Automatic Speech Recognition
- 2.2. Text-Based
- 2.3. Text-to-Speech
-
3. Application
- 3.1. Patient Tracking
- 3.2. Medical Reference
- 3.3. Diagnostic Guides
- 3.4. Drug Dosage
- 3.5. Medical Calculators
- 3.6. Nursing Reference
- 3.7. Other Applications
-
4. End User
- 4.1. Healthcare Providers
- 4.2. Healthcare Payers
- 4.3. Patients
- 4.4. Other End Users
Digital Assistants in Healthcare Industry Segmentation By Geography
- 1. North America
- 2. Europe
- 3. Asia Pacific
- 4. Latin America
- 5. Middle East

Digital Assistants in Healthcare Industry REPORT HIGHLIGHTS
| Aspects | Details |
|---|---|
| Study Period | 2019-2033 |
| Base Year | 2024 |
| Estimated Year | 2025 |
| Forecast Period | 2025-2033 |
| Historical Period | 2019-2024 |
| Growth Rate | CAGR of 34.21% from 2019-2033 |
| Segmentation |
|
Table of Contents
- 1. Introduction
- 1.1. Research Scope
- 1.2. Market Segmentation
- 1.3. Research Methodology
- 1.4. Definitions and Assumptions
- 2. Executive Summary
- 2.1. Introduction
- 3. Market Dynamics
- 3.1. Introduction
- 3.2. Market Drivers
- 3.2.1. Growing Smartphone Users and Increasing Use of Healthcare Applications; Rising Prevalence of Chronic Disorders
- 3.3. Market Restrains
- 3.3.1. Lack of Structured Data in the Healthcare Industry; Concerns Regarding Data Privacy
- 3.4. Market Trends
- 3.4.1. Smart Speakers to Witness Significant Growth
- 4. Market Factor Analysis
- 4.1. Porters Five Forces
- 4.2. Supply/Value Chain
- 4.3. PESTEL analysis
- 4.4. Market Entropy
- 4.5. Patent/Trademark Analysis
- 5. Global Digital Assistants in Healthcare Industry Analysis, Insights and Forecast, 2019-2031
- 5.1. Market Analysis, Insights and Forecast - by Product
- 5.1.1. Smart Speakers
- 5.1.2. Chatbots
- 5.2. Market Analysis, Insights and Forecast - by User Interface
- 5.2.1. Automatic Speech Recognition
- 5.2.2. Text-Based
- 5.2.3. Text-to-Speech
- 5.3. Market Analysis, Insights and Forecast - by Application
- 5.3.1. Patient Tracking
- 5.3.2. Medical Reference
- 5.3.3. Diagnostic Guides
- 5.3.4. Drug Dosage
- 5.3.5. Medical Calculators
- 5.3.6. Nursing Reference
- 5.3.7. Other Applications
- 5.4. Market Analysis, Insights and Forecast - by End User
- 5.4.1. Healthcare Providers
- 5.4.2. Healthcare Payers
- 5.4.3. Patients
- 5.4.4. Other End Users
- 5.5. Market Analysis, Insights and Forecast - by Region
- 5.5.1. North America
- 5.5.2. Europe
- 5.5.3. Asia Pacific
- 5.5.4. Latin America
- 5.5.5. Middle East
- 5.1. Market Analysis, Insights and Forecast - by Product
- 6. North America Digital Assistants in Healthcare Industry Analysis, Insights and Forecast, 2019-2031
- 6.1. Market Analysis, Insights and Forecast - by Product
- 6.1.1. Smart Speakers
- 6.1.2. Chatbots
- 6.2. Market Analysis, Insights and Forecast - by User Interface
- 6.2.1. Automatic Speech Recognition
- 6.2.2. Text-Based
- 6.2.3. Text-to-Speech
- 6.3. Market Analysis, Insights and Forecast - by Application
- 6.3.1. Patient Tracking
- 6.3.2. Medical Reference
- 6.3.3. Diagnostic Guides
- 6.3.4. Drug Dosage
- 6.3.5. Medical Calculators
- 6.3.6. Nursing Reference
- 6.3.7. Other Applications
- 6.4. Market Analysis, Insights and Forecast - by End User
- 6.4.1. Healthcare Providers
- 6.4.2. Healthcare Payers
- 6.4.3. Patients
- 6.4.4. Other End Users
- 6.1. Market Analysis, Insights and Forecast - by Product
- 7. Europe Digital Assistants in Healthcare Industry Analysis, Insights and Forecast, 2019-2031
- 7.1. Market Analysis, Insights and Forecast - by Product
- 7.1.1. Smart Speakers
- 7.1.2. Chatbots
- 7.2. Market Analysis, Insights and Forecast - by User Interface
- 7.2.1. Automatic Speech Recognition
- 7.2.2. Text-Based
- 7.2.3. Text-to-Speech
- 7.3. Market Analysis, Insights and Forecast - by Application
- 7.3.1. Patient Tracking
- 7.3.2. Medical Reference
- 7.3.3. Diagnostic Guides
- 7.3.4. Drug Dosage
- 7.3.5. Medical Calculators
- 7.3.6. Nursing Reference
- 7.3.7. Other Applications
- 7.4. Market Analysis, Insights and Forecast - by End User
- 7.4.1. Healthcare Providers
- 7.4.2. Healthcare Payers
- 7.4.3. Patients
- 7.4.4. Other End Users
- 7.1. Market Analysis, Insights and Forecast - by Product
- 8. Asia Pacific Digital Assistants in Healthcare Industry Analysis, Insights and Forecast, 2019-2031
- 8.1. Market Analysis, Insights and Forecast - by Product
- 8.1.1. Smart Speakers
- 8.1.2. Chatbots
- 8.2. Market Analysis, Insights and Forecast - by User Interface
- 8.2.1. Automatic Speech Recognition
- 8.2.2. Text-Based
- 8.2.3. Text-to-Speech
- 8.3. Market Analysis, Insights and Forecast - by Application
- 8.3.1. Patient Tracking
- 8.3.2. Medical Reference
- 8.3.3. Diagnostic Guides
- 8.3.4. Drug Dosage
- 8.3.5. Medical Calculators
- 8.3.6. Nursing Reference
- 8.3.7. Other Applications
- 8.4. Market Analysis, Insights and Forecast - by End User
- 8.4.1. Healthcare Providers
- 8.4.2. Healthcare Payers
- 8.4.3. Patients
- 8.4.4. Other End Users
- 8.1. Market Analysis, Insights and Forecast - by Product
- 9. Latin America Digital Assistants in Healthcare Industry Analysis, Insights and Forecast, 2019-2031
- 9.1. Market Analysis, Insights and Forecast - by Product
- 9.1.1. Smart Speakers
- 9.1.2. Chatbots
- 9.2. Market Analysis, Insights and Forecast - by User Interface
- 9.2.1. Automatic Speech Recognition
- 9.2.2. Text-Based
- 9.2.3. Text-to-Speech
- 9.3. Market Analysis, Insights and Forecast - by Application
- 9.3.1. Patient Tracking
- 9.3.2. Medical Reference
- 9.3.3. Diagnostic Guides
- 9.3.4. Drug Dosage
- 9.3.5. Medical Calculators
- 9.3.6. Nursing Reference
- 9.3.7. Other Applications
- 9.4. Market Analysis, Insights and Forecast - by End User
- 9.4.1. Healthcare Providers
- 9.4.2. Healthcare Payers
- 9.4.3. Patients
- 9.4.4. Other End Users
- 9.1. Market Analysis, Insights and Forecast - by Product
- 10. Middle East Digital Assistants in Healthcare Industry Analysis, Insights and Forecast, 2019-2031
- 10.1. Market Analysis, Insights and Forecast - by Product
- 10.1.1. Smart Speakers
- 10.1.2. Chatbots
- 10.2. Market Analysis, Insights and Forecast - by User Interface
- 10.2.1. Automatic Speech Recognition
- 10.2.2. Text-Based
- 10.2.3. Text-to-Speech
- 10.3. Market Analysis, Insights and Forecast - by Application
- 10.3.1. Patient Tracking
- 10.3.2. Medical Reference
- 10.3.3. Diagnostic Guides
- 10.3.4. Drug Dosage
- 10.3.5. Medical Calculators
- 10.3.6. Nursing Reference
- 10.3.7. Other Applications
- 10.4. Market Analysis, Insights and Forecast - by End User
- 10.4.1. Healthcare Providers
- 10.4.2. Healthcare Payers
- 10.4.3. Patients
- 10.4.4. Other End Users
- 10.1. Market Analysis, Insights and Forecast - by Product
- 11. North America Digital Assistants in Healthcare Industry Analysis, Insights and Forecast, 2019-2031
- 11.1. Market Analysis, Insights and Forecast - By Country/Sub-region
- 11.1.1 United States
- 11.1.2 Canada
- 11.1.3 Mexico
- 12. Europe Digital Assistants in Healthcare Industry Analysis, Insights and Forecast, 2019-2031
- 12.1. Market Analysis, Insights and Forecast - By Country/Sub-region
- 12.1.1 Germany
- 12.1.2 United Kingdom
- 12.1.3 France
- 12.1.4 Spain
- 12.1.5 Italy
- 12.1.6 Spain
- 12.1.7 Belgium
- 12.1.8 Netherland
- 12.1.9 Nordics
- 12.1.10 Rest of Europe
- 13. Asia Pacific Digital Assistants in Healthcare Industry Analysis, Insights and Forecast, 2019-2031
- 13.1. Market Analysis, Insights and Forecast - By Country/Sub-region
- 13.1.1 China
- 13.1.2 Japan
- 13.1.3 India
- 13.1.4 South Korea
- 13.1.5 Southeast Asia
- 13.1.6 Australia
- 13.1.7 Indonesia
- 13.1.8 Phillipes
- 13.1.9 Singapore
- 13.1.10 Thailandc
- 13.1.11 Rest of Asia Pacific
- 14. South America Digital Assistants in Healthcare Industry Analysis, Insights and Forecast, 2019-2031
- 14.1. Market Analysis, Insights and Forecast - By Country/Sub-region
- 14.1.1 Brazil
- 14.1.2 Argentina
- 14.1.3 Peru
- 14.1.4 Chile
- 14.1.5 Colombia
- 14.1.6 Ecuador
- 14.1.7 Venezuela
- 14.1.8 Rest of South America
- 15. North America Digital Assistants in Healthcare Industry Analysis, Insights and Forecast, 2019-2031
- 15.1. Market Analysis, Insights and Forecast - By Country/Sub-region
- 15.1.1 United States
- 15.1.2 Canada
- 15.1.3 Mexico
- 16. MEA Digital Assistants in Healthcare Industry Analysis, Insights and Forecast, 2019-2031
- 16.1. Market Analysis, Insights and Forecast - By Country/Sub-region
- 16.1.1 United Arab Emirates
- 16.1.2 Saudi Arabia
- 16.1.3 South Africa
- 16.1.4 Rest of Middle East and Africa
- 17. Competitive Analysis
- 17.1. Global Market Share Analysis 2024
- 17.2. Company Profiles
- 17.2.1 Nuance Communications Inc
- 17.2.1.1. Overview
- 17.2.1.2. Products
- 17.2.1.3. SWOT Analysis
- 17.2.1.4. Recent Developments
- 17.2.1.5. Financials (Based on Availability)
- 17.2.2 CSS Corporation Pvt Ltd
- 17.2.2.1. Overview
- 17.2.2.2. Products
- 17.2.2.3. SWOT Analysis
- 17.2.2.4. Recent Developments
- 17.2.2.5. Financials (Based on Availability)
- 17.2.3 Medrespond LLC
- 17.2.3.1. Overview
- 17.2.3.2. Products
- 17.2.3.3. SWOT Analysis
- 17.2.3.4. Recent Developments
- 17.2.3.5. Financials (Based on Availability)
- 17.2.4 Healthtap Inc
- 17.2.4.1. Overview
- 17.2.4.2. Products
- 17.2.4.3. SWOT Analysis
- 17.2.4.4. Recent Developments
- 17.2.4.5. Financials (Based on Availability)
- 17.2.5 ADA Digital Health
- 17.2.5.1. Overview
- 17.2.5.2. Products
- 17.2.5.3. SWOT Analysis
- 17.2.5.4. Recent Developments
- 17.2.5.5. Financials (Based on Availability)
- 17.2.6 Infermedica Sp z o o
- 17.2.6.1. Overview
- 17.2.6.2. Products
- 17.2.6.3. SWOT Analysis
- 17.2.6.4. Recent Developments
- 17.2.6.5. Financials (Based on Availability)
- 17.2.7 Microsoft Corporation
- 17.2.7.1. Overview
- 17.2.7.2. Products
- 17.2.7.3. SWOT Analysis
- 17.2.7.4. Recent Developments
- 17.2.7.5. Financials (Based on Availability)
- 17.2.8 eGain Corporation
- 17.2.8.1. Overview
- 17.2.8.2. Products
- 17.2.8.3. SWOT Analysis
- 17.2.8.4. Recent Developments
- 17.2.8.5. Financials (Based on Availability)
- 17.2.9 Verint Systems Inc
- 17.2.9.1. Overview
- 17.2.9.2. Products
- 17.2.9.3. SWOT Analysis
- 17.2.9.4. Recent Developments
- 17.2.9.5. Financials (Based on Availability)
- 17.2.10 True Image Interactive Inc
- 17.2.10.1. Overview
- 17.2.10.2. Products
- 17.2.10.3. SWOT Analysis
- 17.2.10.4. Recent Developments
- 17.2.10.5. Financials (Based on Availability)
- 17.2.11 Babylon Healthcare Services Limited
- 17.2.11.1. Overview
- 17.2.11.2. Products
- 17.2.11.3. SWOT Analysis
- 17.2.11.4. Recent Developments
- 17.2.11.5. Financials (Based on Availability)
- 17.2.12 Floatbot AI
- 17.2.12.1. Overview
- 17.2.12.2. Products
- 17.2.12.3. SWOT Analysis
- 17.2.12.4. Recent Developments
- 17.2.12.5. Financials (Based on Availability)
- 17.2.13 Amazon com Inc
- 17.2.13.1. Overview
- 17.2.13.2. Products
- 17.2.13.3. SWOT Analysis
- 17.2.13.4. Recent Developments
- 17.2.13.5. Financials (Based on Availability)
- 17.2.14 Sensely Inc
- 17.2.14.1. Overview
- 17.2.14.2. Products
- 17.2.14.3. SWOT Analysis
- 17.2.14.4. Recent Developments
- 17.2.14.5. Financials (Based on Availability)
- 17.2.15 Kore AI Inc
- 17.2.15.1. Overview
- 17.2.15.2. Products
- 17.2.15.3. SWOT Analysis
- 17.2.15.4. Recent Developments
- 17.2.15.5. Financials (Based on Availability)
- 17.2.1 Nuance Communications Inc
List of Figures
- Figure 1: Global Digital Assistants in Healthcare Industry Revenue Breakdown (Million, %) by Region 2024 & 2032
- Figure 2: Global Digital Assistants in Healthcare Industry Volume Breakdown (K Unit, %) by Region 2024 & 2032
- Figure 3: North America Digital Assistants in Healthcare Industry Revenue (Million), by Country 2024 & 2032
- Figure 4: North America Digital Assistants in Healthcare Industry Volume (K Unit), by Country 2024 & 2032
- Figure 5: North America Digital Assistants in Healthcare Industry Revenue Share (%), by Country 2024 & 2032
- Figure 6: North America Digital Assistants in Healthcare Industry Volume Share (%), by Country 2024 & 2032
- Figure 7: Europe Digital Assistants in Healthcare Industry Revenue (Million), by Country 2024 & 2032
- Figure 8: Europe Digital Assistants in Healthcare Industry Volume (K Unit), by Country 2024 & 2032
- Figure 9: Europe Digital Assistants in Healthcare Industry Revenue Share (%), by Country 2024 & 2032
- Figure 10: Europe Digital Assistants in Healthcare Industry Volume Share (%), by Country 2024 & 2032
- Figure 11: Asia Pacific Digital Assistants in Healthcare Industry Revenue (Million), by Country 2024 & 2032
- Figure 12: Asia Pacific Digital Assistants in Healthcare Industry Volume (K Unit), by Country 2024 & 2032
- Figure 13: Asia Pacific Digital Assistants in Healthcare Industry Revenue Share (%), by Country 2024 & 2032
- Figure 14: Asia Pacific Digital Assistants in Healthcare Industry Volume Share (%), by Country 2024 & 2032
- Figure 15: South America Digital Assistants in Healthcare Industry Revenue (Million), by Country 2024 & 2032
- Figure 16: South America Digital Assistants in Healthcare Industry Volume (K Unit), by Country 2024 & 2032
- Figure 17: South America Digital Assistants in Healthcare Industry Revenue Share (%), by Country 2024 & 2032
- Figure 18: South America Digital Assistants in Healthcare Industry Volume Share (%), by Country 2024 & 2032
- Figure 19: North America Digital Assistants in Healthcare Industry Revenue (Million), by Country 2024 & 2032
- Figure 20: North America Digital Assistants in Healthcare Industry Volume (K Unit), by Country 2024 & 2032
- Figure 21: North America Digital Assistants in Healthcare Industry Revenue Share (%), by Country 2024 & 2032
- Figure 22: North America Digital Assistants in Healthcare Industry Volume Share (%), by Country 2024 & 2032
- Figure 23: MEA Digital Assistants in Healthcare Industry Revenue (Million), by Country 2024 & 2032
- Figure 24: MEA Digital Assistants in Healthcare Industry Volume (K Unit), by Country 2024 & 2032
- Figure 25: MEA Digital Assistants in Healthcare Industry Revenue Share (%), by Country 2024 & 2032
- Figure 26: MEA Digital Assistants in Healthcare Industry Volume Share (%), by Country 2024 & 2032
- Figure 27: North America Digital Assistants in Healthcare Industry Revenue (Million), by Product 2024 & 2032
- Figure 28: North America Digital Assistants in Healthcare Industry Volume (K Unit), by Product 2024 & 2032
- Figure 29: North America Digital Assistants in Healthcare Industry Revenue Share (%), by Product 2024 & 2032
- Figure 30: North America Digital Assistants in Healthcare Industry Volume Share (%), by Product 2024 & 2032
- Figure 31: North America Digital Assistants in Healthcare Industry Revenue (Million), by User Interface 2024 & 2032
- Figure 32: North America Digital Assistants in Healthcare Industry Volume (K Unit), by User Interface 2024 & 2032
- Figure 33: North America Digital Assistants in Healthcare Industry Revenue Share (%), by User Interface 2024 & 2032
- Figure 34: North America Digital Assistants in Healthcare Industry Volume Share (%), by User Interface 2024 & 2032
- Figure 35: North America Digital Assistants in Healthcare Industry Revenue (Million), by Application 2024 & 2032
- Figure 36: North America Digital Assistants in Healthcare Industry Volume (K Unit), by Application 2024 & 2032
- Figure 37: North America Digital Assistants in Healthcare Industry Revenue Share (%), by Application 2024 & 2032
- Figure 38: North America Digital Assistants in Healthcare Industry Volume Share (%), by Application 2024 & 2032
- Figure 39: North America Digital Assistants in Healthcare Industry Revenue (Million), by End User 2024 & 2032
- Figure 40: North America Digital Assistants in Healthcare Industry Volume (K Unit), by End User 2024 & 2032
- Figure 41: North America Digital Assistants in Healthcare Industry Revenue Share (%), by End User 2024 & 2032
- Figure 42: North America Digital Assistants in Healthcare Industry Volume Share (%), by End User 2024 & 2032
- Figure 43: North America Digital Assistants in Healthcare Industry Revenue (Million), by Country 2024 & 2032
- Figure 44: North America Digital Assistants in Healthcare Industry Volume (K Unit), by Country 2024 & 2032
- Figure 45: North America Digital Assistants in Healthcare Industry Revenue Share (%), by Country 2024 & 2032
- Figure 46: North America Digital Assistants in Healthcare Industry Volume Share (%), by Country 2024 & 2032
- Figure 47: Europe Digital Assistants in Healthcare Industry Revenue (Million), by Product 2024 & 2032
- Figure 48: Europe Digital Assistants in Healthcare Industry Volume (K Unit), by Product 2024 & 2032
- Figure 49: Europe Digital Assistants in Healthcare Industry Revenue Share (%), by Product 2024 & 2032
- Figure 50: Europe Digital Assistants in Healthcare Industry Volume Share (%), by Product 2024 & 2032
- Figure 51: Europe Digital Assistants in Healthcare Industry Revenue (Million), by User Interface 2024 & 2032
- Figure 52: Europe Digital Assistants in Healthcare Industry Volume (K Unit), by User Interface 2024 & 2032
- Figure 53: Europe Digital Assistants in Healthcare Industry Revenue Share (%), by User Interface 2024 & 2032
- Figure 54: Europe Digital Assistants in Healthcare Industry Volume Share (%), by User Interface 2024 & 2032
- Figure 55: Europe Digital Assistants in Healthcare Industry Revenue (Million), by Application 2024 & 2032
- Figure 56: Europe Digital Assistants in Healthcare Industry Volume (K Unit), by Application 2024 & 2032
- Figure 57: Europe Digital Assistants in Healthcare Industry Revenue Share (%), by Application 2024 & 2032
- Figure 58: Europe Digital Assistants in Healthcare Industry Volume Share (%), by Application 2024 & 2032
- Figure 59: Europe Digital Assistants in Healthcare Industry Revenue (Million), by End User 2024 & 2032
- Figure 60: Europe Digital Assistants in Healthcare Industry Volume (K Unit), by End User 2024 & 2032
- Figure 61: Europe Digital Assistants in Healthcare Industry Revenue Share (%), by End User 2024 & 2032
- Figure 62: Europe Digital Assistants in Healthcare Industry Volume Share (%), by End User 2024 & 2032
- Figure 63: Europe Digital Assistants in Healthcare Industry Revenue (Million), by Country 2024 & 2032
- Figure 64: Europe Digital Assistants in Healthcare Industry Volume (K Unit), by Country 2024 & 2032
- Figure 65: Europe Digital Assistants in Healthcare Industry Revenue Share (%), by Country 2024 & 2032
- Figure 66: Europe Digital Assistants in Healthcare Industry Volume Share (%), by Country 2024 & 2032
- Figure 67: Asia Pacific Digital Assistants in Healthcare Industry Revenue (Million), by Product 2024 & 2032
- Figure 68: Asia Pacific Digital Assistants in Healthcare Industry Volume (K Unit), by Product 2024 & 2032
- Figure 69: Asia Pacific Digital Assistants in Healthcare Industry Revenue Share (%), by Product 2024 & 2032
- Figure 70: Asia Pacific Digital Assistants in Healthcare Industry Volume Share (%), by Product 2024 & 2032
- Figure 71: Asia Pacific Digital Assistants in Healthcare Industry Revenue (Million), by User Interface 2024 & 2032
- Figure 72: Asia Pacific Digital Assistants in Healthcare Industry Volume (K Unit), by User Interface 2024 & 2032
- Figure 73: Asia Pacific Digital Assistants in Healthcare Industry Revenue Share (%), by User Interface 2024 & 2032
- Figure 74: Asia Pacific Digital Assistants in Healthcare Industry Volume Share (%), by User Interface 2024 & 2032
- Figure 75: Asia Pacific Digital Assistants in Healthcare Industry Revenue (Million), by Application 2024 & 2032
- Figure 76: Asia Pacific Digital Assistants in Healthcare Industry Volume (K Unit), by Application 2024 & 2032
- Figure 77: Asia Pacific Digital Assistants in Healthcare Industry Revenue Share (%), by Application 2024 & 2032
- Figure 78: Asia Pacific Digital Assistants in Healthcare Industry Volume Share (%), by Application 2024 & 2032
- Figure 79: Asia Pacific Digital Assistants in Healthcare Industry Revenue (Million), by End User 2024 & 2032
- Figure 80: Asia Pacific Digital Assistants in Healthcare Industry Volume (K Unit), by End User 2024 & 2032
- Figure 81: Asia Pacific Digital Assistants in Healthcare Industry Revenue Share (%), by End User 2024 & 2032
- Figure 82: Asia Pacific Digital Assistants in Healthcare Industry Volume Share (%), by End User 2024 & 2032
- Figure 83: Asia Pacific Digital Assistants in Healthcare Industry Revenue (Million), by Country 2024 & 2032
- Figure 84: Asia Pacific Digital Assistants in Healthcare Industry Volume (K Unit), by Country 2024 & 2032
- Figure 85: Asia Pacific Digital Assistants in Healthcare Industry Revenue Share (%), by Country 2024 & 2032
- Figure 86: Asia Pacific Digital Assistants in Healthcare Industry Volume Share (%), by Country 2024 & 2032
- Figure 87: Latin America Digital Assistants in Healthcare Industry Revenue (Million), by Product 2024 & 2032
- Figure 88: Latin America Digital Assistants in Healthcare Industry Volume (K Unit), by Product 2024 & 2032
- Figure 89: Latin America Digital Assistants in Healthcare Industry Revenue Share (%), by Product 2024 & 2032
- Figure 90: Latin America Digital Assistants in Healthcare Industry Volume Share (%), by Product 2024 & 2032
- Figure 91: Latin America Digital Assistants in Healthcare Industry Revenue (Million), by User Interface 2024 & 2032
- Figure 92: Latin America Digital Assistants in Healthcare Industry Volume (K Unit), by User Interface 2024 & 2032
- Figure 93: Latin America Digital Assistants in Healthcare Industry Revenue Share (%), by User Interface 2024 & 2032
- Figure 94: Latin America Digital Assistants in Healthcare Industry Volume Share (%), by User Interface 2024 & 2032
- Figure 95: Latin America Digital Assistants in Healthcare Industry Revenue (Million), by Application 2024 & 2032
- Figure 96: Latin America Digital Assistants in Healthcare Industry Volume (K Unit), by Application 2024 & 2032
- Figure 97: Latin America Digital Assistants in Healthcare Industry Revenue Share (%), by Application 2024 & 2032
- Figure 98: Latin America Digital Assistants in Healthcare Industry Volume Share (%), by Application 2024 & 2032
- Figure 99: Latin America Digital Assistants in Healthcare Industry Revenue (Million), by End User 2024 & 2032
- Figure 100: Latin America Digital Assistants in Healthcare Industry Volume (K Unit), by End User 2024 & 2032
- Figure 101: Latin America Digital Assistants in Healthcare Industry Revenue Share (%), by End User 2024 & 2032
- Figure 102: Latin America Digital Assistants in Healthcare Industry Volume Share (%), by End User 2024 & 2032
- Figure 103: Latin America Digital Assistants in Healthcare Industry Revenue (Million), by Country 2024 & 2032
- Figure 104: Latin America Digital Assistants in Healthcare Industry Volume (K Unit), by Country 2024 & 2032
- Figure 105: Latin America Digital Assistants in Healthcare Industry Revenue Share (%), by Country 2024 & 2032
- Figure 106: Latin America Digital Assistants in Healthcare Industry Volume Share (%), by Country 2024 & 2032
- Figure 107: Middle East Digital Assistants in Healthcare Industry Revenue (Million), by Product 2024 & 2032
- Figure 108: Middle East Digital Assistants in Healthcare Industry Volume (K Unit), by Product 2024 & 2032
- Figure 109: Middle East Digital Assistants in Healthcare Industry Revenue Share (%), by Product 2024 & 2032
- Figure 110: Middle East Digital Assistants in Healthcare Industry Volume Share (%), by Product 2024 & 2032
- Figure 111: Middle East Digital Assistants in Healthcare Industry Revenue (Million), by User Interface 2024 & 2032
- Figure 112: Middle East Digital Assistants in Healthcare Industry Volume (K Unit), by User Interface 2024 & 2032
- Figure 113: Middle East Digital Assistants in Healthcare Industry Revenue Share (%), by User Interface 2024 & 2032
- Figure 114: Middle East Digital Assistants in Healthcare Industry Volume Share (%), by User Interface 2024 & 2032
- Figure 115: Middle East Digital Assistants in Healthcare Industry Revenue (Million), by Application 2024 & 2032
- Figure 116: Middle East Digital Assistants in Healthcare Industry Volume (K Unit), by Application 2024 & 2032
- Figure 117: Middle East Digital Assistants in Healthcare Industry Revenue Share (%), by Application 2024 & 2032
- Figure 118: Middle East Digital Assistants in Healthcare Industry Volume Share (%), by Application 2024 & 2032
- Figure 119: Middle East Digital Assistants in Healthcare Industry Revenue (Million), by End User 2024 & 2032
- Figure 120: Middle East Digital Assistants in Healthcare Industry Volume (K Unit), by End User 2024 & 2032
- Figure 121: Middle East Digital Assistants in Healthcare Industry Revenue Share (%), by End User 2024 & 2032
- Figure 122: Middle East Digital Assistants in Healthcare Industry Volume Share (%), by End User 2024 & 2032
- Figure 123: Middle East Digital Assistants in Healthcare Industry Revenue (Million), by Country 2024 & 2032
- Figure 124: Middle East Digital Assistants in Healthcare Industry Volume (K Unit), by Country 2024 & 2032
- Figure 125: Middle East Digital Assistants in Healthcare Industry Revenue Share (%), by Country 2024 & 2032
- Figure 126: Middle East Digital Assistants in Healthcare Industry Volume Share (%), by Country 2024 & 2032
List of Tables
- Table 1: Global Digital Assistants in Healthcare Industry Revenue Million Forecast, by Region 2019 & 2032
- Table 2: Global Digital Assistants in Healthcare Industry Volume K Unit Forecast, by Region 2019 & 2032
- Table 3: Global Digital Assistants in Healthcare Industry Revenue Million Forecast, by Product 2019 & 2032
- Table 4: Global Digital Assistants in Healthcare Industry Volume K Unit Forecast, by Product 2019 & 2032
- Table 5: Global Digital Assistants in Healthcare Industry Revenue Million Forecast, by User Interface 2019 & 2032
- Table 6: Global Digital Assistants in Healthcare Industry Volume K Unit Forecast, by User Interface 2019 & 2032
- Table 7: Global Digital Assistants in Healthcare Industry Revenue Million Forecast, by Application 2019 & 2032
- Table 8: Global Digital Assistants in Healthcare Industry Volume K Unit Forecast, by Application 2019 & 2032
- Table 9: Global Digital Assistants in Healthcare Industry Revenue Million Forecast, by End User 2019 & 2032
- Table 10: Global Digital Assistants in Healthcare Industry Volume K Unit Forecast, by End User 2019 & 2032
- Table 11: Global Digital Assistants in Healthcare Industry Revenue Million Forecast, by Region 2019 & 2032
- Table 12: Global Digital Assistants in Healthcare Industry Volume K Unit Forecast, by Region 2019 & 2032
- Table 13: Global Digital Assistants in Healthcare Industry Revenue Million Forecast, by Country 2019 & 2032
- Table 14: Global Digital Assistants in Healthcare Industry Volume K Unit Forecast, by Country 2019 & 2032
- Table 15: United States Digital Assistants in Healthcare Industry Revenue (Million) Forecast, by Application 2019 & 2032
- Table 16: United States Digital Assistants in Healthcare Industry Volume (K Unit) Forecast, by Application 2019 & 2032
- Table 17: Canada Digital Assistants in Healthcare Industry Revenue (Million) Forecast, by Application 2019 & 2032
- Table 18: Canada Digital Assistants in Healthcare Industry Volume (K Unit) Forecast, by Application 2019 & 2032
- Table 19: Mexico Digital Assistants in Healthcare Industry Revenue (Million) Forecast, by Application 2019 & 2032
- Table 20: Mexico Digital Assistants in Healthcare Industry Volume (K Unit) Forecast, by Application 2019 & 2032
- Table 21: Global Digital Assistants in Healthcare Industry Revenue Million Forecast, by Country 2019 & 2032
- Table 22: Global Digital Assistants in Healthcare Industry Volume K Unit Forecast, by Country 2019 & 2032
- Table 23: Germany Digital Assistants in Healthcare Industry Revenue (Million) Forecast, by Application 2019 & 2032
- Table 24: Germany Digital Assistants in Healthcare Industry Volume (K Unit) Forecast, by Application 2019 & 2032
- Table 25: United Kingdom Digital Assistants in Healthcare Industry Revenue (Million) Forecast, by Application 2019 & 2032
- Table 26: United Kingdom Digital Assistants in Healthcare Industry Volume (K Unit) Forecast, by Application 2019 & 2032
- Table 27: France Digital Assistants in Healthcare Industry Revenue (Million) Forecast, by Application 2019 & 2032
- Table 28: France Digital Assistants in Healthcare Industry Volume (K Unit) Forecast, by Application 2019 & 2032
- Table 29: Spain Digital Assistants in Healthcare Industry Revenue (Million) Forecast, by Application 2019 & 2032
- Table 30: Spain Digital Assistants in Healthcare Industry Volume (K Unit) Forecast, by Application 2019 & 2032
- Table 31: Italy Digital Assistants in Healthcare Industry Revenue (Million) Forecast, by Application 2019 & 2032
- Table 32: Italy Digital Assistants in Healthcare Industry Volume (K Unit) Forecast, by Application 2019 & 2032
- Table 33: Spain Digital Assistants in Healthcare Industry Revenue (Million) Forecast, by Application 2019 & 2032
- Table 34: Spain Digital Assistants in Healthcare Industry Volume (K Unit) Forecast, by Application 2019 & 2032
- Table 35: Belgium Digital Assistants in Healthcare Industry Revenue (Million) Forecast, by Application 2019 & 2032
- Table 36: Belgium Digital Assistants in Healthcare Industry Volume (K Unit) Forecast, by Application 2019 & 2032
- Table 37: Netherland Digital Assistants in Healthcare Industry Revenue (Million) Forecast, by Application 2019 & 2032
- Table 38: Netherland Digital Assistants in Healthcare Industry Volume (K Unit) Forecast, by Application 2019 & 2032
- Table 39: Nordics Digital Assistants in Healthcare Industry Revenue (Million) Forecast, by Application 2019 & 2032
- Table 40: Nordics Digital Assistants in Healthcare Industry Volume (K Unit) Forecast, by Application 2019 & 2032
- Table 41: Rest of Europe Digital Assistants in Healthcare Industry Revenue (Million) Forecast, by Application 2019 & 2032
- Table 42: Rest of Europe Digital Assistants in Healthcare Industry Volume (K Unit) Forecast, by Application 2019 & 2032
- Table 43: Global Digital Assistants in Healthcare Industry Revenue Million Forecast, by Country 2019 & 2032
- Table 44: Global Digital Assistants in Healthcare Industry Volume K Unit Forecast, by Country 2019 & 2032
- Table 45: China Digital Assistants in Healthcare Industry Revenue (Million) Forecast, by Application 2019 & 2032
- Table 46: China Digital Assistants in Healthcare Industry Volume (K Unit) Forecast, by Application 2019 & 2032
- Table 47: Japan Digital Assistants in Healthcare Industry Revenue (Million) Forecast, by Application 2019 & 2032
- Table 48: Japan Digital Assistants in Healthcare Industry Volume (K Unit) Forecast, by Application 2019 & 2032
- Table 49: India Digital Assistants in Healthcare Industry Revenue (Million) Forecast, by Application 2019 & 2032
- Table 50: India Digital Assistants in Healthcare Industry Volume (K Unit) Forecast, by Application 2019 & 2032
- Table 51: South Korea Digital Assistants in Healthcare Industry Revenue (Million) Forecast, by Application 2019 & 2032
- Table 52: South Korea Digital Assistants in Healthcare Industry Volume (K Unit) Forecast, by Application 2019 & 2032
- Table 53: Southeast Asia Digital Assistants in Healthcare Industry Revenue (Million) Forecast, by Application 2019 & 2032
- Table 54: Southeast Asia Digital Assistants in Healthcare Industry Volume (K Unit) Forecast, by Application 2019 & 2032
- Table 55: Australia Digital Assistants in Healthcare Industry Revenue (Million) Forecast, by Application 2019 & 2032
- Table 56: Australia Digital Assistants in Healthcare Industry Volume (K Unit) Forecast, by Application 2019 & 2032
- Table 57: Indonesia Digital Assistants in Healthcare Industry Revenue (Million) Forecast, by Application 2019 & 2032
- Table 58: Indonesia Digital Assistants in Healthcare Industry Volume (K Unit) Forecast, by Application 2019 & 2032
- Table 59: Phillipes Digital Assistants in Healthcare Industry Revenue (Million) Forecast, by Application 2019 & 2032
- Table 60: Phillipes Digital Assistants in Healthcare Industry Volume (K Unit) Forecast, by Application 2019 & 2032
- Table 61: Singapore Digital Assistants in Healthcare Industry Revenue (Million) Forecast, by Application 2019 & 2032
- Table 62: Singapore Digital Assistants in Healthcare Industry Volume (K Unit) Forecast, by Application 2019 & 2032
- Table 63: Thailandc Digital Assistants in Healthcare Industry Revenue (Million) Forecast, by Application 2019 & 2032
- Table 64: Thailandc Digital Assistants in Healthcare Industry Volume (K Unit) Forecast, by Application 2019 & 2032
- Table 65: Rest of Asia Pacific Digital Assistants in Healthcare Industry Revenue (Million) Forecast, by Application 2019 & 2032
- Table 66: Rest of Asia Pacific Digital Assistants in Healthcare Industry Volume (K Unit) Forecast, by Application 2019 & 2032
- Table 67: Global Digital Assistants in Healthcare Industry Revenue Million Forecast, by Country 2019 & 2032
- Table 68: Global Digital Assistants in Healthcare Industry Volume K Unit Forecast, by Country 2019 & 2032
- Table 69: Brazil Digital Assistants in Healthcare Industry Revenue (Million) Forecast, by Application 2019 & 2032
- Table 70: Brazil Digital Assistants in Healthcare Industry Volume (K Unit) Forecast, by Application 2019 & 2032
- Table 71: Argentina Digital Assistants in Healthcare Industry Revenue (Million) Forecast, by Application 2019 & 2032
- Table 72: Argentina Digital Assistants in Healthcare Industry Volume (K Unit) Forecast, by Application 2019 & 2032
- Table 73: Peru Digital Assistants in Healthcare Industry Revenue (Million) Forecast, by Application 2019 & 2032
- Table 74: Peru Digital Assistants in Healthcare Industry Volume (K Unit) Forecast, by Application 2019 & 2032
- Table 75: Chile Digital Assistants in Healthcare Industry Revenue (Million) Forecast, by Application 2019 & 2032
- Table 76: Chile Digital Assistants in Healthcare Industry Volume (K Unit) Forecast, by Application 2019 & 2032
- Table 77: Colombia Digital Assistants in Healthcare Industry Revenue (Million) Forecast, by Application 2019 & 2032
- Table 78: Colombia Digital Assistants in Healthcare Industry Volume (K Unit) Forecast, by Application 2019 & 2032
- Table 79: Ecuador Digital Assistants in Healthcare Industry Revenue (Million) Forecast, by Application 2019 & 2032
- Table 80: Ecuador Digital Assistants in Healthcare Industry Volume (K Unit) Forecast, by Application 2019 & 2032
- Table 81: Venezuela Digital Assistants in Healthcare Industry Revenue (Million) Forecast, by Application 2019 & 2032
- Table 82: Venezuela Digital Assistants in Healthcare Industry Volume (K Unit) Forecast, by Application 2019 & 2032
- Table 83: Rest of South America Digital Assistants in Healthcare Industry Revenue (Million) Forecast, by Application 2019 & 2032
- Table 84: Rest of South America Digital Assistants in Healthcare Industry Volume (K Unit) Forecast, by Application 2019 & 2032
- Table 85: Global Digital Assistants in Healthcare Industry Revenue Million Forecast, by Country 2019 & 2032
- Table 86: Global Digital Assistants in Healthcare Industry Volume K Unit Forecast, by Country 2019 & 2032
- Table 87: United States Digital Assistants in Healthcare Industry Revenue (Million) Forecast, by Application 2019 & 2032
- Table 88: United States Digital Assistants in Healthcare Industry Volume (K Unit) Forecast, by Application 2019 & 2032
- Table 89: Canada Digital Assistants in Healthcare Industry Revenue (Million) Forecast, by Application 2019 & 2032
- Table 90: Canada Digital Assistants in Healthcare Industry Volume (K Unit) Forecast, by Application 2019 & 2032
- Table 91: Mexico Digital Assistants in Healthcare Industry Revenue (Million) Forecast, by Application 2019 & 2032
- Table 92: Mexico Digital Assistants in Healthcare Industry Volume (K Unit) Forecast, by Application 2019 & 2032
- Table 93: Global Digital Assistants in Healthcare Industry Revenue Million Forecast, by Country 2019 & 2032
- Table 94: Global Digital Assistants in Healthcare Industry Volume K Unit Forecast, by Country 2019 & 2032
- Table 95: United Arab Emirates Digital Assistants in Healthcare Industry Revenue (Million) Forecast, by Application 2019 & 2032
- Table 96: United Arab Emirates Digital Assistants in Healthcare Industry Volume (K Unit) Forecast, by Application 2019 & 2032
- Table 97: Saudi Arabia Digital Assistants in Healthcare Industry Revenue (Million) Forecast, by Application 2019 & 2032
- Table 98: Saudi Arabia Digital Assistants in Healthcare Industry Volume (K Unit) Forecast, by Application 2019 & 2032
- Table 99: South Africa Digital Assistants in Healthcare Industry Revenue (Million) Forecast, by Application 2019 & 2032
- Table 100: South Africa Digital Assistants in Healthcare Industry Volume (K Unit) Forecast, by Application 2019 & 2032
- Table 101: Rest of Middle East and Africa Digital Assistants in Healthcare Industry Revenue (Million) Forecast, by Application 2019 & 2032
- Table 102: Rest of Middle East and Africa Digital Assistants in Healthcare Industry Volume (K Unit) Forecast, by Application 2019 & 2032
- Table 103: Global Digital Assistants in Healthcare Industry Revenue Million Forecast, by Product 2019 & 2032
- Table 104: Global Digital Assistants in Healthcare Industry Volume K Unit Forecast, by Product 2019 & 2032
- Table 105: Global Digital Assistants in Healthcare Industry Revenue Million Forecast, by User Interface 2019 & 2032
- Table 106: Global Digital Assistants in Healthcare Industry Volume K Unit Forecast, by User Interface 2019 & 2032
- Table 107: Global Digital Assistants in Healthcare Industry Revenue Million Forecast, by Application 2019 & 2032
- Table 108: Global Digital Assistants in Healthcare Industry Volume K Unit Forecast, by Application 2019 & 2032
- Table 109: Global Digital Assistants in Healthcare Industry Revenue Million Forecast, by End User 2019 & 2032
- Table 110: Global Digital Assistants in Healthcare Industry Volume K Unit Forecast, by End User 2019 & 2032
- Table 111: Global Digital Assistants in Healthcare Industry Revenue Million Forecast, by Country 2019 & 2032
- Table 112: Global Digital Assistants in Healthcare Industry Volume K Unit Forecast, by Country 2019 & 2032
- Table 113: Global Digital Assistants in Healthcare Industry Revenue Million Forecast, by Product 2019 & 2032
- Table 114: Global Digital Assistants in Healthcare Industry Volume K Unit Forecast, by Product 2019 & 2032
- Table 115: Global Digital Assistants in Healthcare Industry Revenue Million Forecast, by User Interface 2019 & 2032
- Table 116: Global Digital Assistants in Healthcare Industry Volume K Unit Forecast, by User Interface 2019 & 2032
- Table 117: Global Digital Assistants in Healthcare Industry Revenue Million Forecast, by Application 2019 & 2032
- Table 118: Global Digital Assistants in Healthcare Industry Volume K Unit Forecast, by Application 2019 & 2032
- Table 119: Global Digital Assistants in Healthcare Industry Revenue Million Forecast, by End User 2019 & 2032
- Table 120: Global Digital Assistants in Healthcare Industry Volume K Unit Forecast, by End User 2019 & 2032
- Table 121: Global Digital Assistants in Healthcare Industry Revenue Million Forecast, by Country 2019 & 2032
- Table 122: Global Digital Assistants in Healthcare Industry Volume K Unit Forecast, by Country 2019 & 2032
- Table 123: Global Digital Assistants in Healthcare Industry Revenue Million Forecast, by Product 2019 & 2032
- Table 124: Global Digital Assistants in Healthcare Industry Volume K Unit Forecast, by Product 2019 & 2032
- Table 125: Global Digital Assistants in Healthcare Industry Revenue Million Forecast, by User Interface 2019 & 2032
- Table 126: Global Digital Assistants in Healthcare Industry Volume K Unit Forecast, by User Interface 2019 & 2032
- Table 127: Global Digital Assistants in Healthcare Industry Revenue Million Forecast, by Application 2019 & 2032
- Table 128: Global Digital Assistants in Healthcare Industry Volume K Unit Forecast, by Application 2019 & 2032
- Table 129: Global Digital Assistants in Healthcare Industry Revenue Million Forecast, by End User 2019 & 2032
- Table 130: Global Digital Assistants in Healthcare Industry Volume K Unit Forecast, by End User 2019 & 2032
- Table 131: Global Digital Assistants in Healthcare Industry Revenue Million Forecast, by Country 2019 & 2032
- Table 132: Global Digital Assistants in Healthcare Industry Volume K Unit Forecast, by Country 2019 & 2032
- Table 133: Global Digital Assistants in Healthcare Industry Revenue Million Forecast, by Product 2019 & 2032
- Table 134: Global Digital Assistants in Healthcare Industry Volume K Unit Forecast, by Product 2019 & 2032
- Table 135: Global Digital Assistants in Healthcare Industry Revenue Million Forecast, by User Interface 2019 & 2032
- Table 136: Global Digital Assistants in Healthcare Industry Volume K Unit Forecast, by User Interface 2019 & 2032
- Table 137: Global Digital Assistants in Healthcare Industry Revenue Million Forecast, by Application 2019 & 2032
- Table 138: Global Digital Assistants in Healthcare Industry Volume K Unit Forecast, by Application 2019 & 2032
- Table 139: Global Digital Assistants in Healthcare Industry Revenue Million Forecast, by End User 2019 & 2032
- Table 140: Global Digital Assistants in Healthcare Industry Volume K Unit Forecast, by End User 2019 & 2032
- Table 141: Global Digital Assistants in Healthcare Industry Revenue Million Forecast, by Country 2019 & 2032
- Table 142: Global Digital Assistants in Healthcare Industry Volume K Unit Forecast, by Country 2019 & 2032
- Table 143: Global Digital Assistants in Healthcare Industry Revenue Million Forecast, by Product 2019 & 2032
- Table 144: Global Digital Assistants in Healthcare Industry Volume K Unit Forecast, by Product 2019 & 2032
- Table 145: Global Digital Assistants in Healthcare Industry Revenue Million Forecast, by User Interface 2019 & 2032
- Table 146: Global Digital Assistants in Healthcare Industry Volume K Unit Forecast, by User Interface 2019 & 2032
- Table 147: Global Digital Assistants in Healthcare Industry Revenue Million Forecast, by Application 2019 & 2032
- Table 148: Global Digital Assistants in Healthcare Industry Volume K Unit Forecast, by Application 2019 & 2032
- Table 149: Global Digital Assistants in Healthcare Industry Revenue Million Forecast, by End User 2019 & 2032
- Table 150: Global Digital Assistants in Healthcare Industry Volume K Unit Forecast, by End User 2019 & 2032
- Table 151: Global Digital Assistants in Healthcare Industry Revenue Million Forecast, by Country 2019 & 2032
- Table 152: Global Digital Assistants in Healthcare Industry Volume K Unit Forecast, by Country 2019 & 2032
Frequently Asked Questions
1. What is the projected Compound Annual Growth Rate (CAGR) of the Digital Assistants in Healthcare Industry?
The projected CAGR is approximately 34.21%.
2. Which companies are prominent players in the Digital Assistants in Healthcare Industry?
Key companies in the market include Nuance Communications Inc, CSS Corporation Pvt Ltd, Medrespond LLC, Healthtap Inc, ADA Digital Health, Infermedica Sp z o o, Microsoft Corporation, eGain Corporation, Verint Systems Inc, True Image Interactive Inc, Babylon Healthcare Services Limited, Floatbot AI, Amazon com Inc, Sensely Inc, Kore AI Inc.
3. What are the main segments of the Digital Assistants in Healthcare Industry?
The market segments include Product, User Interface, Application, End User.
4. Can you provide details about the market size?
The market size is estimated to be USD 1.72 Million as of 2022.
5. What are some drivers contributing to market growth?
Growing Smartphone Users and Increasing Use of Healthcare Applications; Rising Prevalence of Chronic Disorders.
6. What are the notable trends driving market growth?
Smart Speakers to Witness Significant Growth.
7. Are there any restraints impacting market growth?
Lack of Structured Data in the Healthcare Industry; Concerns Regarding Data Privacy.
8. Can you provide examples of recent developments in the market?
February 2023: Ada Health and Pfizer collaborated and announced the launch of their first digital condition-based care journey, designed to help people understand if they meet current criteria for progression to severe COVID-19 and connect with a health care provider for evaluation of their COVID-19 symptoms and treatment options.
9. What pricing options are available for accessing the report?
Pricing options include single-user, multi-user, and enterprise licenses priced at USD 4750, USD 5250, and USD 8750 respectively.
10. Is the market size provided in terms of value or volume?
The market size is provided in terms of value, measured in Million and volume, measured in K Unit.
11. Are there any specific market keywords associated with the report?
Yes, the market keyword associated with the report is "Digital Assistants in Healthcare Industry," which aids in identifying and referencing the specific market segment covered.
12. How do I determine which pricing option suits my needs best?
The pricing options vary based on user requirements and access needs. Individual users may opt for single-user licenses, while businesses requiring broader access may choose multi-user or enterprise licenses for cost-effective access to the report.
13. Are there any additional resources or data provided in the Digital Assistants in Healthcare Industry report?
While the report offers comprehensive insights, it's advisable to review the specific contents or supplementary materials provided to ascertain if additional resources or data are available.
14. How can I stay updated on further developments or reports in the Digital Assistants in Healthcare Industry?
To stay informed about further developments, trends, and reports in the Digital Assistants in Healthcare Industry, consider subscribing to industry newsletters, following relevant companies and organizations, or regularly checking reputable industry news sources and publications.
Methodology
Step 1 - Identification of Relevant Samples Size from Population Database


Step 2 - Approaches for Defining Global Market Size (Value, Volume* & Price*)

Note*: In applicable scenarios
Step 3 - Data Sources
Primary Research
- Web Analytics
- Survey Reports
- Research Institute
- Latest Research Reports
- Opinion Leaders
Secondary Research
- Annual Reports
- White Paper
- Latest Press Release
- Industry Association
- Paid Database
- Investor Presentations

Step 4 - Data Triangulation
Involves using different sources of information in order to increase the validity of a study
These sources are likely to be stakeholders in a program - participants, other researchers, program staff, other community members, and so on.
Then we put all data in single framework & apply various statistical tools to find out the dynamic on the market.
During the analysis stage, feedback from the stakeholder groups would be compared to determine areas of agreement as well as areas of divergence


