
Key Insights
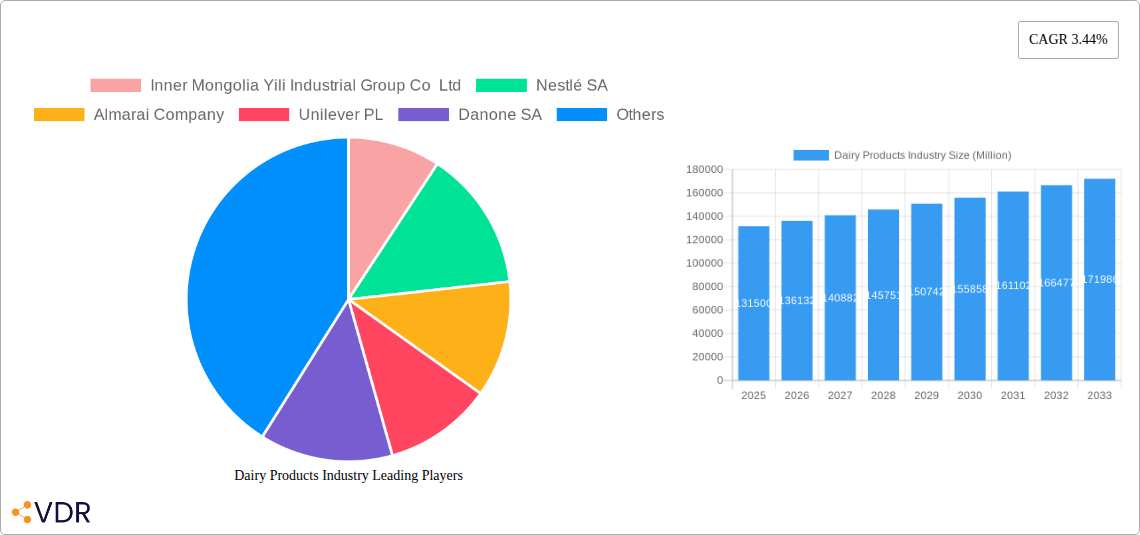
The global dairy products market, valued at $131.5 billion in 2025, is projected to experience steady growth, driven by rising global population, increasing disposable incomes, and a growing preference for convenient and nutritious food options. Key drivers include the expanding middle class in developing economies, increasing demand for dairy-based functional foods and beverages, and the ongoing innovation in product development, such as the introduction of organic and plant-based dairy alternatives. The market is segmented by distribution channels (off-trade encompassing supermarkets and convenience stores, and on-trade including restaurants, cafes, and hotels), product categories (milk, butter, yogurt, cheese, and others like those sold in warehouse clubs and gas stations), and geography. Competition is fierce, with major players like Nestlé, Danone, and Yili vying for market share through strategic acquisitions, brand building, and expansion into new markets. The market’s growth, however, faces restraints such as fluctuations in milk production due to climate change, increasing raw material costs, and evolving consumer preferences towards healthier and sustainable food choices. This necessitates a strategic approach by dairy companies, focusing on sustainability initiatives, product diversification, and targeted marketing campaigns.
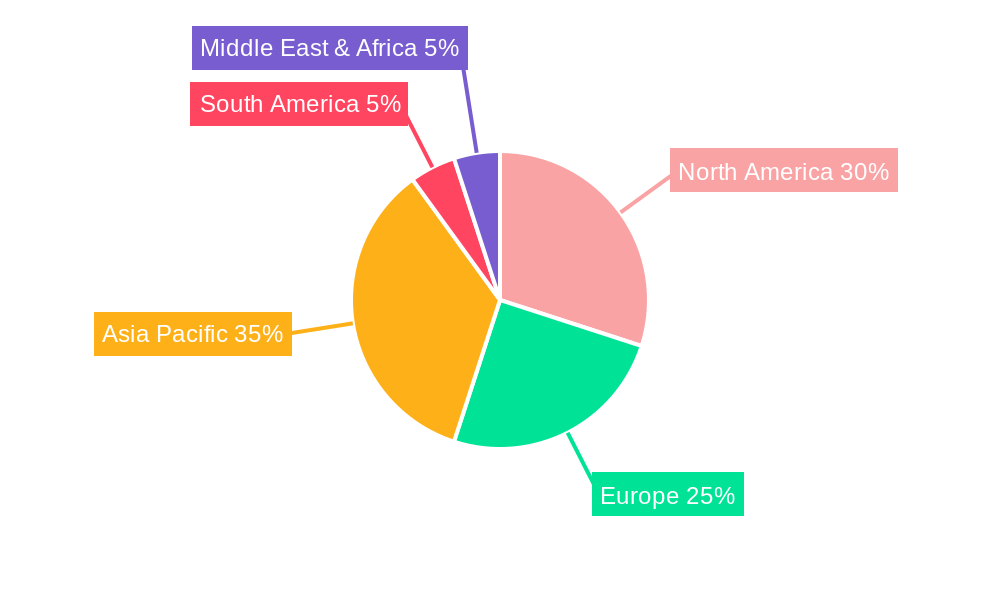
The North American market, encompassing the United States, Canada, and Mexico, currently holds a significant share of the global dairy market due to high per capita consumption and established distribution networks. The Asia-Pacific region, particularly China and India, is expected to witness significant growth in the coming years fueled by rapid economic development and rising consumer demand. European markets, while mature, continue to offer growth opportunities through premium product offerings and specialized dairy products. The Middle East and Africa region presents a developing market with considerable potential for growth driven by urbanization and changing dietary habits. Understanding regional nuances and tailoring product offerings and marketing strategies to local preferences will be crucial for successful market penetration and expansion. Further growth is expected to be fueled by the rise of e-commerce, increasing online grocery shopping, and the development of innovative packaging solutions that enhance product shelf life and convenience.
Dairy Products Industry Market Report: 2019-2033
This comprehensive report provides an in-depth analysis of the global dairy products industry, covering the period 2019-2033, with a focus on market dynamics, growth trends, key players, and future opportunities. The report segments the market by distribution channel (off-trade and on-trade), product category (milk, butter, yogurt, cheese, and others), and geographic region, offering a granular view of this dynamic sector. The base year for this analysis is 2025, with estimations for 2025 and forecasts extending to 2033. This report is essential for industry professionals, investors, and strategic decision-makers seeking a clear understanding of the current market landscape and future growth trajectory. The market size is presented in Million units throughout.
Dairy Products Industry Market Dynamics & Structure
The global dairy products market is characterized by a moderately concentrated structure, with key players like Nestlé SA, Danone SA, and Lactalis holding significant market share. However, regional variations exist, with some markets demonstrating greater fragmentation. Technological innovation, particularly in areas like shelf-life extension and sustainable packaging, is a crucial driver of growth. Stringent regulatory frameworks concerning food safety and labeling impact market operations. Competitive substitutes, such as plant-based alternatives, increasingly challenge traditional dairy products. End-user demographics, especially shifting consumer preferences toward healthier and more convenient options, also play a significant role. Mergers and acquisitions (M&A) activity is significant, reflecting industry consolidation and expansion strategies.
- Market Concentration: Top 5 players hold approximately xx% of the global market share (2024).
- Technological Innovation: Focus on sustainable packaging, extended shelf-life technologies, and precision fermentation.
- Regulatory Frameworks: Stringent food safety regulations and labeling requirements vary across regions.
- Competitive Substitutes: Plant-based milk alternatives and other protein sources pose growing competition.
- M&A Trends: Increased consolidation through acquisitions and strategic partnerships (xx deals in 2024).
- Innovation Barriers: High R&D costs and stringent regulatory approvals hinder innovation.
Dairy Products Industry Growth Trends & Insights
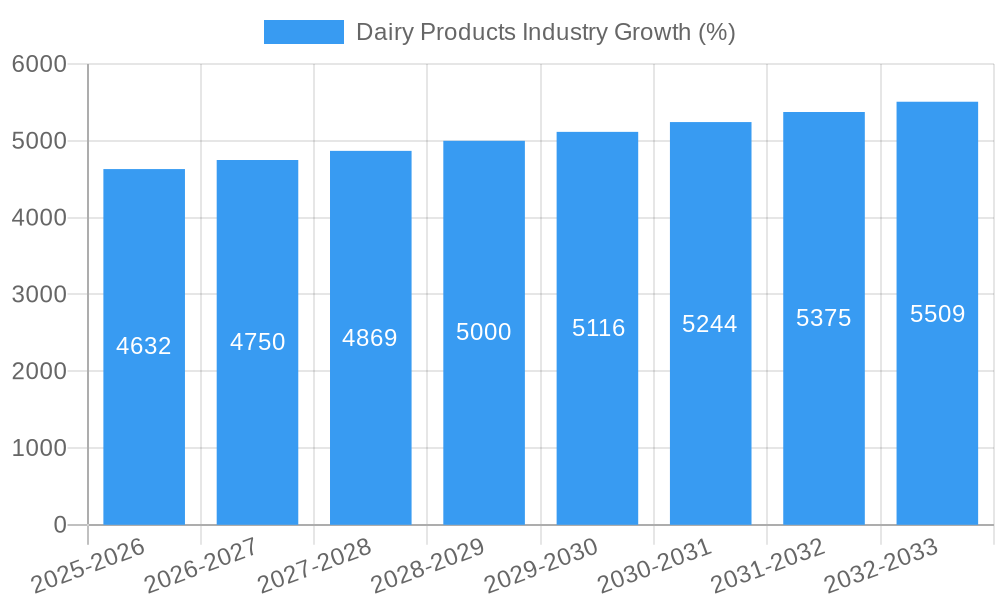
The global dairy products market experienced steady growth during the historical period (2019-2024), with a CAGR of xx%. This growth is projected to continue during the forecast period (2025-2033), driven by factors such as rising global population, increasing disposable incomes in emerging economies, and changing consumer preferences. Technological disruptions, particularly in processing and packaging, are enhancing product shelf life and convenience, further fueling market expansion. Consumer behavior shifts toward healthier options like Greek yogurt and organic dairy are also impacting segment-specific growth. Market penetration of innovative products remains relatively low, suggesting considerable untapped potential.
- Market Size Evolution: xx Million units in 2024, projected to reach xx Million units by 2033.
- CAGR (2025-2033): xx%
- Market Penetration: xx% for organic dairy products (2024).
- Technological Disruptions: Automation in processing, smart packaging solutions.
- Consumer Behavior Shifts: Increased demand for organic, lactose-free, and plant-based alternatives.
Dominant Regions, Countries, or Segments in Dairy Products Industry
North America and Europe currently dominate the global dairy products market, driven by high per capita consumption and well-established distribution channels. However, Asia-Pacific is experiencing the fastest growth, fueled by rapid economic development and increasing urbanization. Within segments, the off-trade channel (supermarkets and convenience stores) holds the largest market share, followed by the on-trade sector (restaurants and cafes). Cow's milk remains the dominant product category, though the demand for yogurt and cheese is increasing steadily.
- Leading Region: North America (Market share: xx% in 2024).
- Fastest-Growing Region: Asia-Pacific (CAGR: xx% during 2025-2033).
- Dominant Distribution Channel: Off-trade (Supermarkets and convenience stores – xx% market share in 2024).
- Leading Product Category: Cow's milk (Market share: xx% in 2024).
- Key Growth Drivers (Asia-Pacific): Rising disposable incomes, urbanization, and increasing health consciousness.
- Key Growth Drivers (North America): Innovation in product offerings and strong distribution networks.
Dairy Products Industry Product Landscape
The dairy products industry is witnessing continuous innovation, with new product launches focusing on health and convenience. This includes the development of lactose-free milk, organic dairy products, high-protein yogurts, and specialized cheeses with unique flavor profiles. Technological advancements are enhancing product shelf life, improving processing efficiency, and creating opportunities for customized products. Unique selling propositions (USPs) increasingly focus on sustainability, ethical sourcing, and health benefits.
Key Drivers, Barriers & Challenges in Dairy Products Industry
Key Drivers:
- Growing global population and rising disposable incomes.
- Increasing health consciousness and demand for functional dairy products.
- Technological advancements in processing and packaging.
- Government support and initiatives promoting the dairy industry.
Challenges:
- Fluctuations in milk prices and raw material costs.
- Stringent food safety regulations and compliance requirements.
- Intense competition from plant-based alternatives.
- Supply chain disruptions and logistics challenges. (Estimated impact on 2024 market: xx% reduction in output)
Emerging Opportunities in Dairy Products Industry
- Growing demand for premium and specialized dairy products (e.g., organic, lactose-free).
- Expanding market for functional dairy products with added health benefits (probiotics, vitamins).
- Penetration into untapped markets in developing countries.
- Increased adoption of sustainable and eco-friendly packaging solutions.
Growth Accelerators in the Dairy Products Industry
Technological advancements, strategic partnerships, and expansion into new markets will drive long-term growth. Innovation in processing techniques, including precision fermentation, will enhance efficiency and expand product possibilities. Strategic collaborations among dairy producers, retailers, and technology providers will optimize supply chains and improve product distribution. Expansion into high-growth markets, particularly in Asia-Pacific and Africa, offers substantial opportunities.
Key Players Shaping the Dairy Products Industry Market
- Inner Mongolia Yili Industrial Group Co Ltd
- Nestlé SA
- Almarai Company
- Unilever PL
- Danone SA
- Arla Foods Amba
- Dairy Farmers of America Inc
- Fonterra Co-operative Group Limited
- Gujarat Co-operative Milk Marketing Federation Ltd
- Saputo Inc
- Groupe Lactalis
- China Mengniu Dairy Company Ltd
Notable Milestones in Dairy Products Industry Sector
- September 2023: China Mengniu acquired organic infant formula producer Bellamy's Australia for USD 1 billion, expanding its presence in the premium infant nutrition market.
- October 2022: Unilever partnered with ASAP for ice cream distribution, enhancing its e-commerce capabilities.
- August 2022: Dairy Farmers of America acquired two shelf-extended facilities, strengthening its position in the extended shelf-life product segment.
In-Depth Dairy Products Industry Market Outlook
The dairy products industry is poised for continued growth, driven by technological innovations, strategic alliances, and evolving consumer preferences. Opportunities exist in developing premium and functional products, expanding into new geographic markets, and leveraging sustainable practices. Strategic partnerships and investments in research and development will be crucial for sustained success in this dynamic and competitive market. The forecast period (2025-2033) suggests significant market expansion, offering attractive opportunities for both established players and new entrants.
Dairy Products Industry Segmentation
-
1. Category
-
1.1. Butter
-
1.1.1. By Product Type
- 1.1.1.1. Cultured Butter
- 1.1.1.2. Uncultured Butter
-
1.1.1. By Product Type
-
1.2. Cheese
- 1.2.1. Natural Cheese
- 1.2.2. Processed Cheese
-
1.3. Cream
- 1.3.1. Double Cream
- 1.3.2. Single Cream
- 1.3.3. Whipping Cream
- 1.3.4. Others
-
1.4. Dairy Desserts
- 1.4.1. Cheesecakes
- 1.4.2. Frozen Desserts
- 1.4.3. Ice Cream
- 1.4.4. Mousses
-
1.5. Milk
- 1.5.1. Condensed milk
- 1.5.2. Flavored Milk
- 1.5.3. Fresh Milk
- 1.5.4. Powdered Milk
- 1.5.5. UHT Milk
- 1.6. Sour Milk Drinks
-
1.7. Yogurt
- 1.7.1. Flavored Yogurt
- 1.7.2. Unflavored Yogurt
-
1.1. Butter
-
2. Distribution Channel
-
2.1. Off-Trade
- 2.1.1. Convenience Stores
- 2.1.2. Online Retail
- 2.1.3. Specialist Retailers
- 2.1.4. Supermarkets and Hypermarkets
- 2.1.5. Others (Warehouse clubs, gas stations, etc.)
- 2.2. On-Trade
-
2.1. Off-Trade
Dairy Products Industry Segmentation By Geography
-
1. North America
- 1.1. United States
- 1.2. Canada
- 1.3. Mexico
-
2. South America
- 2.1. Brazil
- 2.2. Argentina
- 2.3. Rest of South America
-
3. Europe
- 3.1. United Kingdom
- 3.2. Germany
- 3.3. France
- 3.4. Italy
- 3.5. Spain
- 3.6. Russia
- 3.7. Benelux
- 3.8. Nordics
- 3.9. Rest of Europe
-
4. Middle East & Africa
- 4.1. Turkey
- 4.2. Israel
- 4.3. GCC
- 4.4. North Africa
- 4.5. South Africa
- 4.6. Rest of Middle East & Africa
-
5. Asia Pacific
- 5.1. China
- 5.2. India
- 5.3. Japan
- 5.4. South Korea
- 5.5. ASEAN
- 5.6. Oceania
- 5.7. Rest of Asia Pacific
Dairy Products Industry REPORT HIGHLIGHTS
| Aspects | Details |
|---|---|
| Study Period | 2019-2033 |
| Base Year | 2024 |
| Estimated Year | 2025 |
| Forecast Period | 2025-2033 |
| Historical Period | 2019-2024 |
| Growth Rate | CAGR of 3.44% from 2019-2033 |
| Segmentation |
|
Table of Contents
- 1. Introduction
- 1.1. Research Scope
- 1.2. Market Segmentation
- 1.3. Research Methodology
- 1.4. Definitions and Assumptions
- 2. Executive Summary
- 2.1. Introduction
- 3. Market Dynamics
- 3.1. Introduction
- 3.2. Market Drivers
- 3.2.1. Rising Demand for Clean Label Food & Beverage Products; Rising Demand for Dairy Products
- 3.3. Market Restrains
- 3.3.1. Presence of Preservatives in Ready Meals may Hamper the Market Growth
- 3.4. Market Trends
- 3.4.1. OTHER KEY INDUSTRY TRENDS COVERED IN THE REPORT
- 4. Market Factor Analysis
- 4.1. Porters Five Forces
- 4.2. Supply/Value Chain
- 4.3. PESTEL analysis
- 4.4. Market Entropy
- 4.5. Patent/Trademark Analysis
- 5. Global Dairy Products Industry Analysis, Insights and Forecast, 2019-2031
- 5.1. Market Analysis, Insights and Forecast - by Category
- 5.1.1. Butter
- 5.1.1.1. By Product Type
- 5.1.1.1.1. Cultured Butter
- 5.1.1.1.2. Uncultured Butter
- 5.1.1.1. By Product Type
- 5.1.2. Cheese
- 5.1.2.1. Natural Cheese
- 5.1.2.2. Processed Cheese
- 5.1.3. Cream
- 5.1.3.1. Double Cream
- 5.1.3.2. Single Cream
- 5.1.3.3. Whipping Cream
- 5.1.3.4. Others
- 5.1.4. Dairy Desserts
- 5.1.4.1. Cheesecakes
- 5.1.4.2. Frozen Desserts
- 5.1.4.3. Ice Cream
- 5.1.4.4. Mousses
- 5.1.5. Milk
- 5.1.5.1. Condensed milk
- 5.1.5.2. Flavored Milk
- 5.1.5.3. Fresh Milk
- 5.1.5.4. Powdered Milk
- 5.1.5.5. UHT Milk
- 5.1.6. Sour Milk Drinks
- 5.1.7. Yogurt
- 5.1.7.1. Flavored Yogurt
- 5.1.7.2. Unflavored Yogurt
- 5.1.1. Butter
- 5.2. Market Analysis, Insights and Forecast - by Distribution Channel
- 5.2.1. Off-Trade
- 5.2.1.1. Convenience Stores
- 5.2.1.2. Online Retail
- 5.2.1.3. Specialist Retailers
- 5.2.1.4. Supermarkets and Hypermarkets
- 5.2.1.5. Others (Warehouse clubs, gas stations, etc.)
- 5.2.2. On-Trade
- 5.2.1. Off-Trade
- 5.3. Market Analysis, Insights and Forecast - by Region
- 5.3.1. North America
- 5.3.2. South America
- 5.3.3. Europe
- 5.3.4. Middle East & Africa
- 5.3.5. Asia Pacific
- 5.1. Market Analysis, Insights and Forecast - by Category
- 6. North America Dairy Products Industry Analysis, Insights and Forecast, 2019-2031
- 6.1. Market Analysis, Insights and Forecast - by Category
- 6.1.1. Butter
- 6.1.1.1. By Product Type
- 6.1.1.1.1. Cultured Butter
- 6.1.1.1.2. Uncultured Butter
- 6.1.1.1. By Product Type
- 6.1.2. Cheese
- 6.1.2.1. Natural Cheese
- 6.1.2.2. Processed Cheese
- 6.1.3. Cream
- 6.1.3.1. Double Cream
- 6.1.3.2. Single Cream
- 6.1.3.3. Whipping Cream
- 6.1.3.4. Others
- 6.1.4. Dairy Desserts
- 6.1.4.1. Cheesecakes
- 6.1.4.2. Frozen Desserts
- 6.1.4.3. Ice Cream
- 6.1.4.4. Mousses
- 6.1.5. Milk
- 6.1.5.1. Condensed milk
- 6.1.5.2. Flavored Milk
- 6.1.5.3. Fresh Milk
- 6.1.5.4. Powdered Milk
- 6.1.5.5. UHT Milk
- 6.1.6. Sour Milk Drinks
- 6.1.7. Yogurt
- 6.1.7.1. Flavored Yogurt
- 6.1.7.2. Unflavored Yogurt
- 6.1.1. Butter
- 6.2. Market Analysis, Insights and Forecast - by Distribution Channel
- 6.2.1. Off-Trade
- 6.2.1.1. Convenience Stores
- 6.2.1.2. Online Retail
- 6.2.1.3. Specialist Retailers
- 6.2.1.4. Supermarkets and Hypermarkets
- 6.2.1.5. Others (Warehouse clubs, gas stations, etc.)
- 6.2.2. On-Trade
- 6.2.1. Off-Trade
- 6.1. Market Analysis, Insights and Forecast - by Category
- 7. South America Dairy Products Industry Analysis, Insights and Forecast, 2019-2031
- 7.1. Market Analysis, Insights and Forecast - by Category
- 7.1.1. Butter
- 7.1.1.1. By Product Type
- 7.1.1.1.1. Cultured Butter
- 7.1.1.1.2. Uncultured Butter
- 7.1.1.1. By Product Type
- 7.1.2. Cheese
- 7.1.2.1. Natural Cheese
- 7.1.2.2. Processed Cheese
- 7.1.3. Cream
- 7.1.3.1. Double Cream
- 7.1.3.2. Single Cream
- 7.1.3.3. Whipping Cream
- 7.1.3.4. Others
- 7.1.4. Dairy Desserts
- 7.1.4.1. Cheesecakes
- 7.1.4.2. Frozen Desserts
- 7.1.4.3. Ice Cream
- 7.1.4.4. Mousses
- 7.1.5. Milk
- 7.1.5.1. Condensed milk
- 7.1.5.2. Flavored Milk
- 7.1.5.3. Fresh Milk
- 7.1.5.4. Powdered Milk
- 7.1.5.5. UHT Milk
- 7.1.6. Sour Milk Drinks
- 7.1.7. Yogurt
- 7.1.7.1. Flavored Yogurt
- 7.1.7.2. Unflavored Yogurt
- 7.1.1. Butter
- 7.2. Market Analysis, Insights and Forecast - by Distribution Channel
- 7.2.1. Off-Trade
- 7.2.1.1. Convenience Stores
- 7.2.1.2. Online Retail
- 7.2.1.3. Specialist Retailers
- 7.2.1.4. Supermarkets and Hypermarkets
- 7.2.1.5. Others (Warehouse clubs, gas stations, etc.)
- 7.2.2. On-Trade
- 7.2.1. Off-Trade
- 7.1. Market Analysis, Insights and Forecast - by Category
- 8. Europe Dairy Products Industry Analysis, Insights and Forecast, 2019-2031
- 8.1. Market Analysis, Insights and Forecast - by Category
- 8.1.1. Butter
- 8.1.1.1. By Product Type
- 8.1.1.1.1. Cultured Butter
- 8.1.1.1.2. Uncultured Butter
- 8.1.1.1. By Product Type
- 8.1.2. Cheese
- 8.1.2.1. Natural Cheese
- 8.1.2.2. Processed Cheese
- 8.1.3. Cream
- 8.1.3.1. Double Cream
- 8.1.3.2. Single Cream
- 8.1.3.3. Whipping Cream
- 8.1.3.4. Others
- 8.1.4. Dairy Desserts
- 8.1.4.1. Cheesecakes
- 8.1.4.2. Frozen Desserts
- 8.1.4.3. Ice Cream
- 8.1.4.4. Mousses
- 8.1.5. Milk
- 8.1.5.1. Condensed milk
- 8.1.5.2. Flavored Milk
- 8.1.5.3. Fresh Milk
- 8.1.5.4. Powdered Milk
- 8.1.5.5. UHT Milk
- 8.1.6. Sour Milk Drinks
- 8.1.7. Yogurt
- 8.1.7.1. Flavored Yogurt
- 8.1.7.2. Unflavored Yogurt
- 8.1.1. Butter
- 8.2. Market Analysis, Insights and Forecast - by Distribution Channel
- 8.2.1. Off-Trade
- 8.2.1.1. Convenience Stores
- 8.2.1.2. Online Retail
- 8.2.1.3. Specialist Retailers
- 8.2.1.4. Supermarkets and Hypermarkets
- 8.2.1.5. Others (Warehouse clubs, gas stations, etc.)
- 8.2.2. On-Trade
- 8.2.1. Off-Trade
- 8.1. Market Analysis, Insights and Forecast - by Category
- 9. Middle East & Africa Dairy Products Industry Analysis, Insights and Forecast, 2019-2031
- 9.1. Market Analysis, Insights and Forecast - by Category
- 9.1.1. Butter
- 9.1.1.1. By Product Type
- 9.1.1.1.1. Cultured Butter
- 9.1.1.1.2. Uncultured Butter
- 9.1.1.1. By Product Type
- 9.1.2. Cheese
- 9.1.2.1. Natural Cheese
- 9.1.2.2. Processed Cheese
- 9.1.3. Cream
- 9.1.3.1. Double Cream
- 9.1.3.2. Single Cream
- 9.1.3.3. Whipping Cream
- 9.1.3.4. Others
- 9.1.4. Dairy Desserts
- 9.1.4.1. Cheesecakes
- 9.1.4.2. Frozen Desserts
- 9.1.4.3. Ice Cream
- 9.1.4.4. Mousses
- 9.1.5. Milk
- 9.1.5.1. Condensed milk
- 9.1.5.2. Flavored Milk
- 9.1.5.3. Fresh Milk
- 9.1.5.4. Powdered Milk
- 9.1.5.5. UHT Milk
- 9.1.6. Sour Milk Drinks
- 9.1.7. Yogurt
- 9.1.7.1. Flavored Yogurt
- 9.1.7.2. Unflavored Yogurt
- 9.1.1. Butter
- 9.2. Market Analysis, Insights and Forecast - by Distribution Channel
- 9.2.1. Off-Trade
- 9.2.1.1. Convenience Stores
- 9.2.1.2. Online Retail
- 9.2.1.3. Specialist Retailers
- 9.2.1.4. Supermarkets and Hypermarkets
- 9.2.1.5. Others (Warehouse clubs, gas stations, etc.)
- 9.2.2. On-Trade
- 9.2.1. Off-Trade
- 9.1. Market Analysis, Insights and Forecast - by Category
- 10. Asia Pacific Dairy Products Industry Analysis, Insights and Forecast, 2019-2031
- 10.1. Market Analysis, Insights and Forecast - by Category
- 10.1.1. Butter
- 10.1.1.1. By Product Type
- 10.1.1.1.1. Cultured Butter
- 10.1.1.1.2. Uncultured Butter
- 10.1.1.1. By Product Type
- 10.1.2. Cheese
- 10.1.2.1. Natural Cheese
- 10.1.2.2. Processed Cheese
- 10.1.3. Cream
- 10.1.3.1. Double Cream
- 10.1.3.2. Single Cream
- 10.1.3.3. Whipping Cream
- 10.1.3.4. Others
- 10.1.4. Dairy Desserts
- 10.1.4.1. Cheesecakes
- 10.1.4.2. Frozen Desserts
- 10.1.4.3. Ice Cream
- 10.1.4.4. Mousses
- 10.1.5. Milk
- 10.1.5.1. Condensed milk
- 10.1.5.2. Flavored Milk
- 10.1.5.3. Fresh Milk
- 10.1.5.4. Powdered Milk
- 10.1.5.5. UHT Milk
- 10.1.6. Sour Milk Drinks
- 10.1.7. Yogurt
- 10.1.7.1. Flavored Yogurt
- 10.1.7.2. Unflavored Yogurt
- 10.1.1. Butter
- 10.2. Market Analysis, Insights and Forecast - by Distribution Channel
- 10.2.1. Off-Trade
- 10.2.1.1. Convenience Stores
- 10.2.1.2. Online Retail
- 10.2.1.3. Specialist Retailers
- 10.2.1.4. Supermarkets and Hypermarkets
- 10.2.1.5. Others (Warehouse clubs, gas stations, etc.)
- 10.2.2. On-Trade
- 10.2.1. Off-Trade
- 10.1. Market Analysis, Insights and Forecast - by Category
- 11. North America Dairy Products Industry Analysis, Insights and Forecast, 2019-2031
- 11.1. Market Analysis, Insights and Forecast - By Country/Sub-region
- 11.1.1 United States
- 11.1.2 Canada
- 11.1.3 Mexico
- 12. South America Dairy Products Industry Analysis, Insights and Forecast, 2019-2031
- 12.1. Market Analysis, Insights and Forecast - By Country/Sub-region
- 12.1.1 Brazil
- 12.1.2 Argentina
- 12.1.3 Rest of South America
- 13. Europe Dairy Products Industry Analysis, Insights and Forecast, 2019-2031
- 13.1. Market Analysis, Insights and Forecast - By Country/Sub-region
- 13.1.1 Germany
- 13.1.2 France
- 13.1.3 Italy
- 13.1.4 United Kingdom
- 13.1.5 Netherlands
- 13.1.6 Rest of Europe
- 14. Asia Pacific Dairy Products Industry Analysis, Insights and Forecast, 2019-2031
- 14.1. Market Analysis, Insights and Forecast - By Country/Sub-region
- 14.1.1 China
- 14.1.2 Japan
- 14.1.3 India
- 14.1.4 South Korea
- 14.1.5 Taiwan
- 14.1.6 Australia
- 14.1.7 Rest of Asia-Pacific
- 15. Middle East & Africa Dairy Products Industry Analysis, Insights and Forecast, 2019-2031
- 15.1. Market Analysis, Insights and Forecast - By Country/Sub-region
- 15.1.1 UAE
- 15.1.2 South Africa
- 15.1.3 Saudi Arabia
- 15.1.4 Rest of MEA
- 16. Competitive Analysis
- 16.1. Global Market Share Analysis 2024
- 16.2. Company Profiles
- 16.2.1 Inner Mongolia Yili Industrial Group Co Ltd
- 16.2.1.1. Overview
- 16.2.1.2. Products
- 16.2.1.3. SWOT Analysis
- 16.2.1.4. Recent Developments
- 16.2.1.5. Financials (Based on Availability)
- 16.2.2 Nestlé SA
- 16.2.2.1. Overview
- 16.2.2.2. Products
- 16.2.2.3. SWOT Analysis
- 16.2.2.4. Recent Developments
- 16.2.2.5. Financials (Based on Availability)
- 16.2.3 Almarai Company
- 16.2.3.1. Overview
- 16.2.3.2. Products
- 16.2.3.3. SWOT Analysis
- 16.2.3.4. Recent Developments
- 16.2.3.5. Financials (Based on Availability)
- 16.2.4 Unilever PL
- 16.2.4.1. Overview
- 16.2.4.2. Products
- 16.2.4.3. SWOT Analysis
- 16.2.4.4. Recent Developments
- 16.2.4.5. Financials (Based on Availability)
- 16.2.5 Danone SA
- 16.2.5.1. Overview
- 16.2.5.2. Products
- 16.2.5.3. SWOT Analysis
- 16.2.5.4. Recent Developments
- 16.2.5.5. Financials (Based on Availability)
- 16.2.6 Arla Foods Amba
- 16.2.6.1. Overview
- 16.2.6.2. Products
- 16.2.6.3. SWOT Analysis
- 16.2.6.4. Recent Developments
- 16.2.6.5. Financials (Based on Availability)
- 16.2.7 Dairy Farmers of America Inc
- 16.2.7.1. Overview
- 16.2.7.2. Products
- 16.2.7.3. SWOT Analysis
- 16.2.7.4. Recent Developments
- 16.2.7.5. Financials (Based on Availability)
- 16.2.8 Fonterra Co-operative Group Limited
- 16.2.8.1. Overview
- 16.2.8.2. Products
- 16.2.8.3. SWOT Analysis
- 16.2.8.4. Recent Developments
- 16.2.8.5. Financials (Based on Availability)
- 16.2.9 Gujarat Co-operative Milk Marketing Federation Ltd
- 16.2.9.1. Overview
- 16.2.9.2. Products
- 16.2.9.3. SWOT Analysis
- 16.2.9.4. Recent Developments
- 16.2.9.5. Financials (Based on Availability)
- 16.2.10 Saputo Inc
- 16.2.10.1. Overview
- 16.2.10.2. Products
- 16.2.10.3. SWOT Analysis
- 16.2.10.4. Recent Developments
- 16.2.10.5. Financials (Based on Availability)
- 16.2.11 Groupe Lactalis
- 16.2.11.1. Overview
- 16.2.11.2. Products
- 16.2.11.3. SWOT Analysis
- 16.2.11.4. Recent Developments
- 16.2.11.5. Financials (Based on Availability)
- 16.2.12 China Mengniu Dairy Company Ltd
- 16.2.12.1. Overview
- 16.2.12.2. Products
- 16.2.12.3. SWOT Analysis
- 16.2.12.4. Recent Developments
- 16.2.12.5. Financials (Based on Availability)
- 16.2.1 Inner Mongolia Yili Industrial Group Co Ltd
List of Figures
- Figure 1: Global Dairy Products Industry Revenue Breakdown (Million, %) by Region 2024 & 2032
- Figure 2: North America Dairy Products Industry Revenue (Million), by Country 2024 & 2032
- Figure 3: North America Dairy Products Industry Revenue Share (%), by Country 2024 & 2032
- Figure 4: South America Dairy Products Industry Revenue (Million), by Country 2024 & 2032
- Figure 5: South America Dairy Products Industry Revenue Share (%), by Country 2024 & 2032
- Figure 6: Europe Dairy Products Industry Revenue (Million), by Country 2024 & 2032
- Figure 7: Europe Dairy Products Industry Revenue Share (%), by Country 2024 & 2032
- Figure 8: Asia Pacific Dairy Products Industry Revenue (Million), by Country 2024 & 2032
- Figure 9: Asia Pacific Dairy Products Industry Revenue Share (%), by Country 2024 & 2032
- Figure 10: Middle East & Africa Dairy Products Industry Revenue (Million), by Country 2024 & 2032
- Figure 11: Middle East & Africa Dairy Products Industry Revenue Share (%), by Country 2024 & 2032
- Figure 12: North America Dairy Products Industry Revenue (Million), by Category 2024 & 2032
- Figure 13: North America Dairy Products Industry Revenue Share (%), by Category 2024 & 2032
- Figure 14: North America Dairy Products Industry Revenue (Million), by Distribution Channel 2024 & 2032
- Figure 15: North America Dairy Products Industry Revenue Share (%), by Distribution Channel 2024 & 2032
- Figure 16: North America Dairy Products Industry Revenue (Million), by Country 2024 & 2032
- Figure 17: North America Dairy Products Industry Revenue Share (%), by Country 2024 & 2032
- Figure 18: South America Dairy Products Industry Revenue (Million), by Category 2024 & 2032
- Figure 19: South America Dairy Products Industry Revenue Share (%), by Category 2024 & 2032
- Figure 20: South America Dairy Products Industry Revenue (Million), by Distribution Channel 2024 & 2032
- Figure 21: South America Dairy Products Industry Revenue Share (%), by Distribution Channel 2024 & 2032
- Figure 22: South America Dairy Products Industry Revenue (Million), by Country 2024 & 2032
- Figure 23: South America Dairy Products Industry Revenue Share (%), by Country 2024 & 2032
- Figure 24: Europe Dairy Products Industry Revenue (Million), by Category 2024 & 2032
- Figure 25: Europe Dairy Products Industry Revenue Share (%), by Category 2024 & 2032
- Figure 26: Europe Dairy Products Industry Revenue (Million), by Distribution Channel 2024 & 2032
- Figure 27: Europe Dairy Products Industry Revenue Share (%), by Distribution Channel 2024 & 2032
- Figure 28: Europe Dairy Products Industry Revenue (Million), by Country 2024 & 2032
- Figure 29: Europe Dairy Products Industry Revenue Share (%), by Country 2024 & 2032
- Figure 30: Middle East & Africa Dairy Products Industry Revenue (Million), by Category 2024 & 2032
- Figure 31: Middle East & Africa Dairy Products Industry Revenue Share (%), by Category 2024 & 2032
- Figure 32: Middle East & Africa Dairy Products Industry Revenue (Million), by Distribution Channel 2024 & 2032
- Figure 33: Middle East & Africa Dairy Products Industry Revenue Share (%), by Distribution Channel 2024 & 2032
- Figure 34: Middle East & Africa Dairy Products Industry Revenue (Million), by Country 2024 & 2032
- Figure 35: Middle East & Africa Dairy Products Industry Revenue Share (%), by Country 2024 & 2032
- Figure 36: Asia Pacific Dairy Products Industry Revenue (Million), by Category 2024 & 2032
- Figure 37: Asia Pacific Dairy Products Industry Revenue Share (%), by Category 2024 & 2032
- Figure 38: Asia Pacific Dairy Products Industry Revenue (Million), by Distribution Channel 2024 & 2032
- Figure 39: Asia Pacific Dairy Products Industry Revenue Share (%), by Distribution Channel 2024 & 2032
- Figure 40: Asia Pacific Dairy Products Industry Revenue (Million), by Country 2024 & 2032
- Figure 41: Asia Pacific Dairy Products Industry Revenue Share (%), by Country 2024 & 2032
List of Tables
- Table 1: Global Dairy Products Industry Revenue Million Forecast, by Region 2019 & 2032
- Table 2: Global Dairy Products Industry Revenue Million Forecast, by Category 2019 & 2032
- Table 3: Global Dairy Products Industry Revenue Million Forecast, by Distribution Channel 2019 & 2032
- Table 4: Global Dairy Products Industry Revenue Million Forecast, by Region 2019 & 2032
- Table 5: Global Dairy Products Industry Revenue Million Forecast, by Country 2019 & 2032
- Table 6: United States Dairy Products Industry Revenue (Million) Forecast, by Application 2019 & 2032
- Table 7: Canada Dairy Products Industry Revenue (Million) Forecast, by Application 2019 & 2032
- Table 8: Mexico Dairy Products Industry Revenue (Million) Forecast, by Application 2019 & 2032
- Table 9: Global Dairy Products Industry Revenue Million Forecast, by Country 2019 & 2032
- Table 10: Brazil Dairy Products Industry Revenue (Million) Forecast, by Application 2019 & 2032
- Table 11: Argentina Dairy Products Industry Revenue (Million) Forecast, by Application 2019 & 2032
- Table 12: Rest of South America Dairy Products Industry Revenue (Million) Forecast, by Application 2019 & 2032
- Table 13: Global Dairy Products Industry Revenue Million Forecast, by Country 2019 & 2032
- Table 14: Germany Dairy Products Industry Revenue (Million) Forecast, by Application 2019 & 2032
- Table 15: France Dairy Products Industry Revenue (Million) Forecast, by Application 2019 & 2032
- Table 16: Italy Dairy Products Industry Revenue (Million) Forecast, by Application 2019 & 2032
- Table 17: United Kingdom Dairy Products Industry Revenue (Million) Forecast, by Application 2019 & 2032
- Table 18: Netherlands Dairy Products Industry Revenue (Million) Forecast, by Application 2019 & 2032
- Table 19: Rest of Europe Dairy Products Industry Revenue (Million) Forecast, by Application 2019 & 2032
- Table 20: Global Dairy Products Industry Revenue Million Forecast, by Country 2019 & 2032
- Table 21: China Dairy Products Industry Revenue (Million) Forecast, by Application 2019 & 2032
- Table 22: Japan Dairy Products Industry Revenue (Million) Forecast, by Application 2019 & 2032
- Table 23: India Dairy Products Industry Revenue (Million) Forecast, by Application 2019 & 2032
- Table 24: South Korea Dairy Products Industry Revenue (Million) Forecast, by Application 2019 & 2032
- Table 25: Taiwan Dairy Products Industry Revenue (Million) Forecast, by Application 2019 & 2032
- Table 26: Australia Dairy Products Industry Revenue (Million) Forecast, by Application 2019 & 2032
- Table 27: Rest of Asia-Pacific Dairy Products Industry Revenue (Million) Forecast, by Application 2019 & 2032
- Table 28: Global Dairy Products Industry Revenue Million Forecast, by Country 2019 & 2032
- Table 29: UAE Dairy Products Industry Revenue (Million) Forecast, by Application 2019 & 2032
- Table 30: South Africa Dairy Products Industry Revenue (Million) Forecast, by Application 2019 & 2032
- Table 31: Saudi Arabia Dairy Products Industry Revenue (Million) Forecast, by Application 2019 & 2032
- Table 32: Rest of MEA Dairy Products Industry Revenue (Million) Forecast, by Application 2019 & 2032
- Table 33: Global Dairy Products Industry Revenue Million Forecast, by Category 2019 & 2032
- Table 34: Global Dairy Products Industry Revenue Million Forecast, by Distribution Channel 2019 & 2032
- Table 35: Global Dairy Products Industry Revenue Million Forecast, by Country 2019 & 2032
- Table 36: United States Dairy Products Industry Revenue (Million) Forecast, by Application 2019 & 2032
- Table 37: Canada Dairy Products Industry Revenue (Million) Forecast, by Application 2019 & 2032
- Table 38: Mexico Dairy Products Industry Revenue (Million) Forecast, by Application 2019 & 2032
- Table 39: Global Dairy Products Industry Revenue Million Forecast, by Category 2019 & 2032
- Table 40: Global Dairy Products Industry Revenue Million Forecast, by Distribution Channel 2019 & 2032
- Table 41: Global Dairy Products Industry Revenue Million Forecast, by Country 2019 & 2032
- Table 42: Brazil Dairy Products Industry Revenue (Million) Forecast, by Application 2019 & 2032
- Table 43: Argentina Dairy Products Industry Revenue (Million) Forecast, by Application 2019 & 2032
- Table 44: Rest of South America Dairy Products Industry Revenue (Million) Forecast, by Application 2019 & 2032
- Table 45: Global Dairy Products Industry Revenue Million Forecast, by Category 2019 & 2032
- Table 46: Global Dairy Products Industry Revenue Million Forecast, by Distribution Channel 2019 & 2032
- Table 47: Global Dairy Products Industry Revenue Million Forecast, by Country 2019 & 2032
- Table 48: United Kingdom Dairy Products Industry Revenue (Million) Forecast, by Application 2019 & 2032
- Table 49: Germany Dairy Products Industry Revenue (Million) Forecast, by Application 2019 & 2032
- Table 50: France Dairy Products Industry Revenue (Million) Forecast, by Application 2019 & 2032
- Table 51: Italy Dairy Products Industry Revenue (Million) Forecast, by Application 2019 & 2032
- Table 52: Spain Dairy Products Industry Revenue (Million) Forecast, by Application 2019 & 2032
- Table 53: Russia Dairy Products Industry Revenue (Million) Forecast, by Application 2019 & 2032
- Table 54: Benelux Dairy Products Industry Revenue (Million) Forecast, by Application 2019 & 2032
- Table 55: Nordics Dairy Products Industry Revenue (Million) Forecast, by Application 2019 & 2032
- Table 56: Rest of Europe Dairy Products Industry Revenue (Million) Forecast, by Application 2019 & 2032
- Table 57: Global Dairy Products Industry Revenue Million Forecast, by Category 2019 & 2032
- Table 58: Global Dairy Products Industry Revenue Million Forecast, by Distribution Channel 2019 & 2032
- Table 59: Global Dairy Products Industry Revenue Million Forecast, by Country 2019 & 2032
- Table 60: Turkey Dairy Products Industry Revenue (Million) Forecast, by Application 2019 & 2032
- Table 61: Israel Dairy Products Industry Revenue (Million) Forecast, by Application 2019 & 2032
- Table 62: GCC Dairy Products Industry Revenue (Million) Forecast, by Application 2019 & 2032
- Table 63: North Africa Dairy Products Industry Revenue (Million) Forecast, by Application 2019 & 2032
- Table 64: South Africa Dairy Products Industry Revenue (Million) Forecast, by Application 2019 & 2032
- Table 65: Rest of Middle East & Africa Dairy Products Industry Revenue (Million) Forecast, by Application 2019 & 2032
- Table 66: Global Dairy Products Industry Revenue Million Forecast, by Category 2019 & 2032
- Table 67: Global Dairy Products Industry Revenue Million Forecast, by Distribution Channel 2019 & 2032
- Table 68: Global Dairy Products Industry Revenue Million Forecast, by Country 2019 & 2032
- Table 69: China Dairy Products Industry Revenue (Million) Forecast, by Application 2019 & 2032
- Table 70: India Dairy Products Industry Revenue (Million) Forecast, by Application 2019 & 2032
- Table 71: Japan Dairy Products Industry Revenue (Million) Forecast, by Application 2019 & 2032
- Table 72: South Korea Dairy Products Industry Revenue (Million) Forecast, by Application 2019 & 2032
- Table 73: ASEAN Dairy Products Industry Revenue (Million) Forecast, by Application 2019 & 2032
- Table 74: Oceania Dairy Products Industry Revenue (Million) Forecast, by Application 2019 & 2032
- Table 75: Rest of Asia Pacific Dairy Products Industry Revenue (Million) Forecast, by Application 2019 & 2032
Frequently Asked Questions
1. What is the projected Compound Annual Growth Rate (CAGR) of the Dairy Products Industry?
The projected CAGR is approximately 3.44%.
2. Which companies are prominent players in the Dairy Products Industry?
Key companies in the market include Inner Mongolia Yili Industrial Group Co Ltd, Nestlé SA, Almarai Company, Unilever PL, Danone SA, Arla Foods Amba, Dairy Farmers of America Inc, Fonterra Co-operative Group Limited, Gujarat Co-operative Milk Marketing Federation Ltd, Saputo Inc, Groupe Lactalis, China Mengniu Dairy Company Ltd.
3. What are the main segments of the Dairy Products Industry?
The market segments include Category, Distribution Channel.
4. Can you provide details about the market size?
The market size is estimated to be USD 131.5 Million as of 2022.
5. What are some drivers contributing to market growth?
Rising Demand for Clean Label Food & Beverage Products; Rising Demand for Dairy Products.
6. What are the notable trends driving market growth?
OTHER KEY INDUSTRY TRENDS COVERED IN THE REPORT.
7. Are there any restraints impacting market growth?
Presence of Preservatives in Ready Meals may Hamper the Market Growth.
8. Can you provide examples of recent developments in the market?
September 2023: China Mengniu acquired organic infant formula producer Bellamy's Australia for USD 1 billion.October 2022: Unilever partnered with ASAP for the distribution of its ice cream goods. As per the partnership, ASAP will also deliver ice cream and treats from Unilever's virtual storefront, The Ice Cream Shop.August 2022: Dairy Farmers of America acquired two shelf-extended facilities of SmithFoods. The strategy of this acquisition was to assist the corporation in capitalizing on the market's growing demand for products with extended shelf lives.
9. What pricing options are available for accessing the report?
Pricing options include single-user, multi-user, and enterprise licenses priced at USD 3800, USD 4500, and USD 5800 respectively.
10. Is the market size provided in terms of value or volume?
The market size is provided in terms of value, measured in Million.
11. Are there any specific market keywords associated with the report?
Yes, the market keyword associated with the report is "Dairy Products Industry," which aids in identifying and referencing the specific market segment covered.
12. How do I determine which pricing option suits my needs best?
The pricing options vary based on user requirements and access needs. Individual users may opt for single-user licenses, while businesses requiring broader access may choose multi-user or enterprise licenses for cost-effective access to the report.
13. Are there any additional resources or data provided in the Dairy Products Industry report?
While the report offers comprehensive insights, it's advisable to review the specific contents or supplementary materials provided to ascertain if additional resources or data are available.
14. How can I stay updated on further developments or reports in the Dairy Products Industry?
To stay informed about further developments, trends, and reports in the Dairy Products Industry, consider subscribing to industry newsletters, following relevant companies and organizations, or regularly checking reputable industry news sources and publications.
Methodology
Step 1 - Identification of Relevant Samples Size from Population Database


Step 2 - Approaches for Defining Global Market Size (Value, Volume* & Price*)

Note*: In applicable scenarios
Step 3 - Data Sources
Primary Research
- Web Analytics
- Survey Reports
- Research Institute
- Latest Research Reports
- Opinion Leaders
Secondary Research
- Annual Reports
- White Paper
- Latest Press Release
- Industry Association
- Paid Database
- Investor Presentations

Step 4 - Data Triangulation
Involves using different sources of information in order to increase the validity of a study
These sources are likely to be stakeholders in a program - participants, other researchers, program staff, other community members, and so on.
Then we put all data in single framework & apply various statistical tools to find out the dynamic on the market.
During the analysis stage, feedback from the stakeholder groups would be compared to determine areas of agreement as well as areas of divergence


