
Key Insights
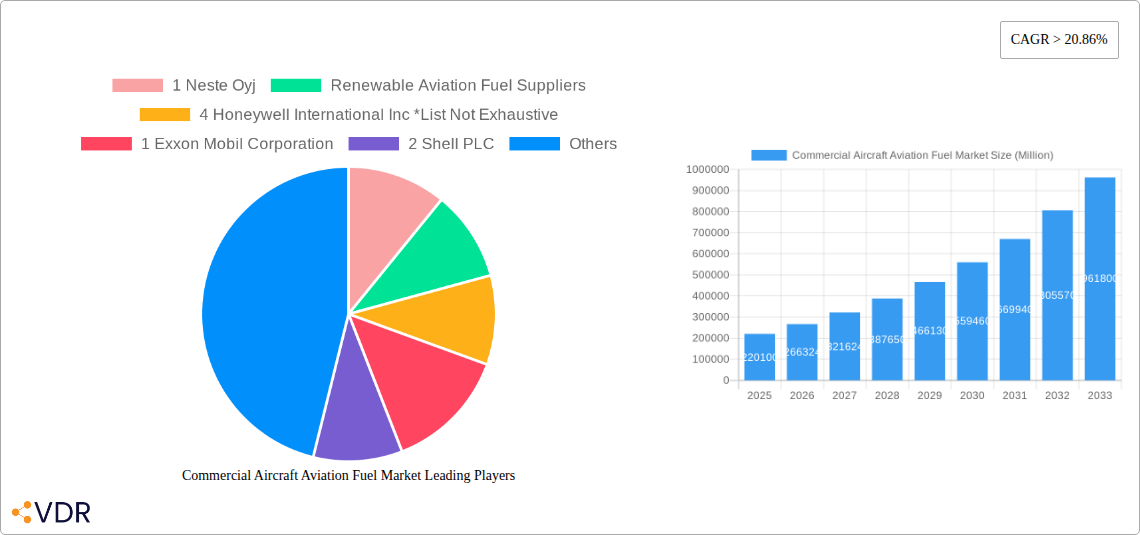
The Commercial Aircraft Aviation Fuel market is experiencing robust growth, projected to reach \$220.1 billion in 2025 and maintain a Compound Annual Growth Rate (CAGR) exceeding 20.86% from 2025 to 2033. This expansion is driven by a surge in air travel demand, particularly in emerging economies across Asia-Pacific and South America. The increasing focus on reducing carbon emissions within the aviation industry is fueling the adoption of sustainable aviation fuels (SAFs), such as Aviation Biofuel, representing a significant segment within the market. While conventional Aviation Turbine Fuel (ATF) remains dominant, the stricter environmental regulations and growing consumer awareness of sustainable travel are accelerating the transition towards SAFs. Key players like Neste Oyj, Honeywell International Inc., Exxon Mobil Corporation, and Shell PLC are actively investing in research and development, expanding production capabilities, and establishing strategic partnerships to capitalize on this burgeoning market for greener aviation fuel solutions. However, the high initial investment costs associated with SAF production and the limited availability of sustainable feedstocks present challenges to market penetration. Furthermore, the volatility of crude oil prices directly impacts ATF pricing, creating uncertainty within the market. Despite these restraints, the long-term outlook for the commercial aircraft aviation fuel market remains positive, driven by sustained growth in air travel and the increasing urgency to decarbonize the aviation sector.
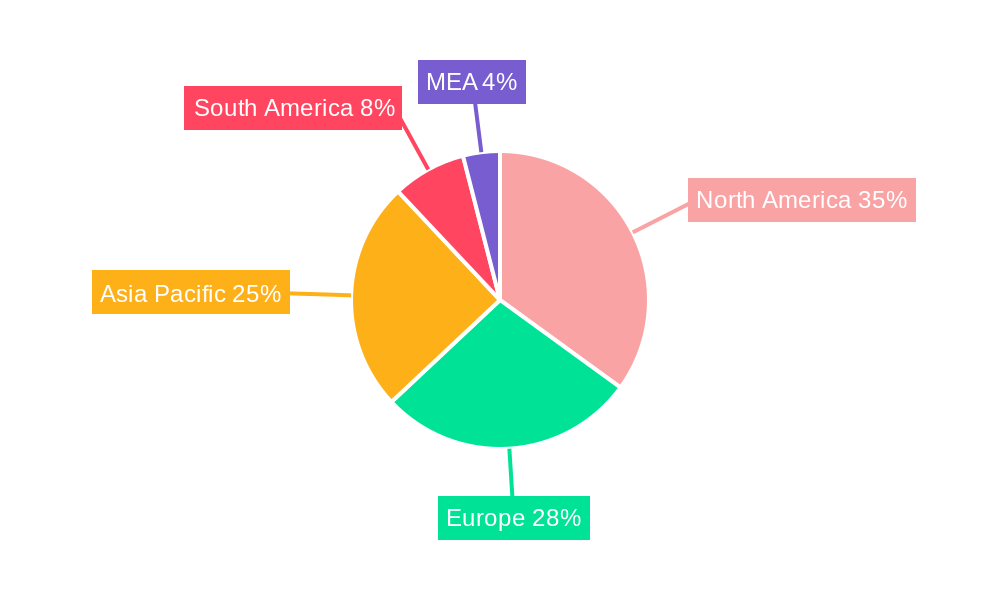
The market segmentation reveals a clear trend towards diversification. While ATF currently holds the largest market share, the Aviation Biofuel segment is expected to witness the most significant growth over the forecast period. Geographical analysis shows strong growth potential across various regions. North America and Europe are currently leading the market, but the Asia-Pacific region, propelled by rapidly expanding air travel demand in countries like China and India, is poised for rapid expansion. South America also shows promising growth potential due to increasing economic development and investment in infrastructure. The Middle East and Africa region, while currently smaller in contribution, is also anticipated to see growth fueled by increasing tourism and regional economic activity. The competitive landscape is dynamic, with established players alongside emerging biofuel producers vying for market share. Strategic alliances and mergers & acquisitions are expected to shape the market structure in the coming years. Overall, the industry is poised for substantial transformation, driven by the imperative to balance economic growth with environmental sustainability.
Commercial Aircraft Aviation Fuel Market: A Comprehensive Report (2019-2033)
This in-depth report provides a comprehensive analysis of the Commercial Aircraft Aviation Fuel Market, encompassing historical data (2019-2024), current estimates (2025), and future forecasts (2025-2033). The study meticulously examines market dynamics, growth trends, dominant segments (including parent market: Aviation Fuel and child market: Commercial Aircraft Aviation Fuel), key players, and emerging opportunities within the aviation fuel landscape. This report is essential for industry professionals, investors, and strategic decision-makers seeking to navigate the complexities and capitalize on the potential of this dynamic market, valued at xx Million in 2025 and projected to reach xx Million by 2033.
Commercial Aircraft Aviation Fuel Market Dynamics & Structure
The commercial aircraft aviation fuel market is characterized by a complex interplay of factors influencing its structure and growth trajectory. Market concentration is moderately high, with a few major players dominating the conventional fuel supply, while the renewable aviation fuel (RAF) segment exhibits a more fragmented landscape. Technological innovation, primarily driven by the need to reduce carbon emissions, is a crucial driver, with advancements in biofuel production and alternative fuel technologies shaping the market. Stringent regulatory frameworks, including emission standards and sustainability mandates, are reshaping the industry, incentivizing the adoption of sustainable alternatives. Competition from emerging fuel types and the potential for technological disruptions pose significant challenges. The market also witnesses substantial M&A activity, with strategic alliances and acquisitions aiming to consolidate market share and access innovative technologies.
- Market Concentration: Conventional fuels: Highly concentrated (xx% market share held by top 5 players). RAF: Fragmented (xx% market share held by top 5 players).
- Technological Innovation: Focus on SAF production efficiency and cost reduction; development of novel fuel types.
- Regulatory Framework: Stringent emission standards (e.g., CORSIA) driving SAF adoption; government incentives for renewable fuels.
- Competitive Substitutes: Growing competition from SAF and other alternative fuels.
- End-User Demographics: Primarily airlines and airport fuel suppliers; increasingly influenced by passenger demand for sustainable travel.
- M&A Trends: Increasing consolidation through mergers and acquisitions, particularly in the SAF segment (xx M&A deals recorded between 2019 and 2024).
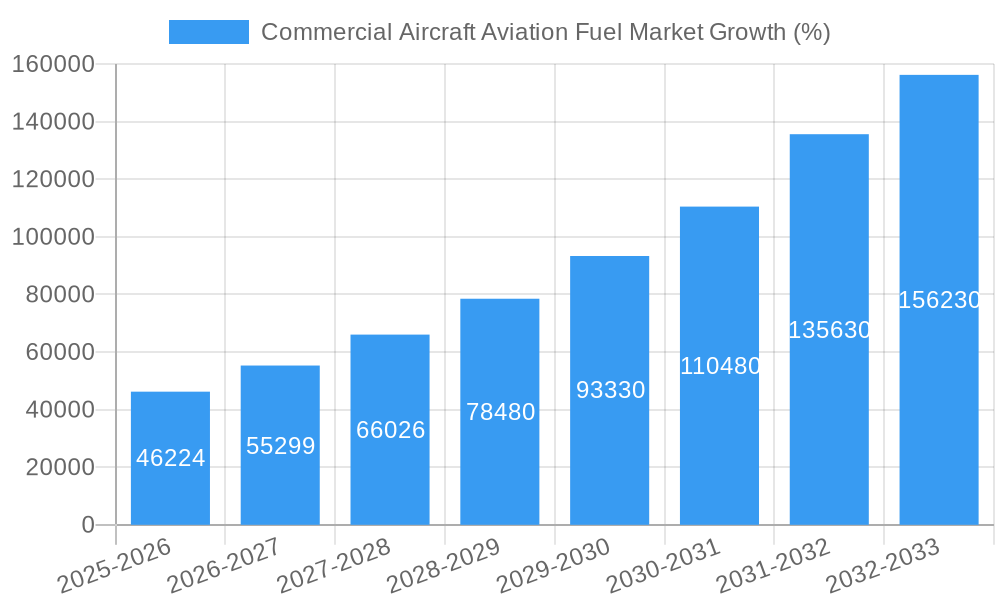
Commercial Aircraft Aviation Fuel Market Growth Trends & Insights
The commercial aircraft aviation fuel market has experienced significant growth over the historical period (2019-2024), driven primarily by rising air travel demand. However, the COVID-19 pandemic temporarily impacted growth rates, but the market is experiencing a strong recovery. The adoption rate of sustainable aviation fuels (SAF) is gradually increasing, albeit from a low base, reflecting the challenges in scaling up production and cost reduction. Technological disruptions, particularly the development and deployment of advanced biofuels and other alternative fuels, are poised to reshape the market landscape. Consumer preferences are increasingly favoring airlines with strong sustainability credentials, putting further pressure on the industry to transition to more sustainable fuel sources. The market is expected to grow at a CAGR of xx% during the forecast period (2025-2033), reaching a market size of xx Million by 2033. Market penetration of SAF is projected to increase from xx% in 2025 to xx% by 2033.
Dominant Regions, Countries, or Segments in Commercial Aircraft Aviation Fuel Market
The North American and European regions currently dominate the commercial aircraft aviation fuel market, driven by robust air travel demand and supportive government policies promoting SAF adoption. Within fuel types, Air Turbine Fuel (ATF) maintains the largest market share, but Aviation Biofuel is experiencing the most significant growth, fueled by increasing environmental concerns and regulatory pressures. Key drivers include well-established aviation infrastructure, strong economic activity, and supportive government policies promoting sustainable aviation.
- North America: High air travel demand; substantial government investment in SAF research and development; established refinery infrastructure.
- Europe: Stringent environmental regulations; increasing adoption of SAF; significant investments in renewable energy technologies.
- Asia-Pacific: Rapidly growing air travel market; significant potential for SAF growth; however, infrastructure development remains a key challenge.
- Fuel Type Dominance: ATF holds the largest market share (xx%), followed by Aviation Biofuel (xx%), with Other Fuel Types representing a smaller segment (xx%).
Commercial Aircraft Aviation Fuel Market Product Landscape
The commercial aircraft aviation fuel market features a range of products, primarily categorized by fuel type (ATF, Aviation Biofuel, and other fuel types). Recent product innovations focus on improving the performance and sustainability of aviation fuels. This includes advancements in biofuel production techniques to enhance efficiency and reduce costs, alongside the development of alternative fuel sources, such as synthetic fuels derived from renewable sources. Key performance metrics include energy density, emissions profile, and compatibility with existing aircraft engines. Unique selling propositions include reduced carbon footprint, improved engine performance, and enhanced operational efficiency.
Key Drivers, Barriers & Challenges in Commercial Aircraft Aviation Fuel Market
Key Drivers:
- Growing Air Travel Demand: The ongoing increase in air passenger numbers globally is driving fuel consumption.
- Stringent Environmental Regulations: Regulations aiming to reduce aviation emissions are pushing the adoption of sustainable alternatives.
- Government Incentives: Financial incentives and policy support for SAF production and use are stimulating market growth.
Key Challenges:
- High Production Costs of SAF: The current high cost of SAF compared to conventional fuels hinders widespread adoption.
- Supply Chain Constraints: Scaling up SAF production requires significant infrastructure investments and logistical adjustments.
- Limited Availability of Sustainable Feedstocks: The availability of sustainable feedstocks for biofuel production is a major limiting factor.
- Technological Hurdles: Ongoing research and development are necessary to overcome technological challenges in alternative fuel production and engine compatibility.
Emerging Opportunities in Commercial Aircraft Aviation Fuel Market
- Growing demand for SAF: The increasing focus on sustainability within the aviation sector is creating substantial opportunities for SAF producers and suppliers.
- Development of next-generation biofuels: Advances in biofuel technology offer significant potential for cost reduction and improved performance.
- Exploration of alternative fuel sources: Synthetic fuels and other innovative fuel types present promising avenues for the industry.
- Expansion in emerging markets: Growth in air travel demand in developing economies creates opportunities for market expansion.
Growth Accelerators in the Commercial Aircraft Aviation Fuel Market Industry
Technological advancements in biofuel production and the emergence of alternative fuels are crucial growth catalysts. Strategic partnerships between fuel suppliers, airlines, and technology providers are accelerating innovation and market adoption. Government policies promoting sustainable aviation fuel and supporting infrastructure development are also significantly boosting market expansion.
Key Players Shaping the Commercial Aircraft Aviation Fuel Market Market
- Neste Oyj
- Renewable Aviation Fuel Suppliers
- Honeywell International Inc
- Exxon Mobil Corporation
- Shell PLC
- Chevron Corporation
- TotalEnergies SE
- Conventional Aviation Fuel Suppliers
- Gevo Inc
- Swedish Biofuels AB
- BP PLC
Notable Milestones in Commercial Aircraft Aviation Fuel Sector
- March 2022: United Airlines, Oxy Low Carbon Ventures, and CemvitaFactory collaborate to commercialize SAF production using CO2 and synthetic microbes. This signifies a significant advancement in the development of sustainable fuel sources.
- March 2022: Pratt & Whitney and AirBP announce a memorandum of understanding to explore the viability of using 100% SAF blends in engine testing, highlighting growing industry support for SAF adoption.
In-Depth Commercial Aircraft Aviation Fuel Market Outlook
The commercial aircraft aviation fuel market is poised for substantial growth in the coming years, driven by ongoing air travel expansion and the accelerating adoption of sustainable aviation fuels. Strategic investments in renewable energy technologies, coupled with supportive government policies and technological breakthroughs, are expected to unlock significant market potential. Companies focusing on innovation, sustainability, and efficient supply chain management are well-positioned to capitalize on the emerging opportunities within this dynamic sector.
Commercial Aircraft Aviation Fuel Market Segmentation
-
1. Fuel Type
- 1.1. Air Turbine Fuel (ATF)
- 1.2. Aviation Biofuel
- 1.3. Other Fuel Types
Commercial Aircraft Aviation Fuel Market Segmentation By Geography
- 1. North America
- 2. Europe
- 3. Asia Pacific
- 4. South America
- 5. Middle East and Africa
Commercial Aircraft Aviation Fuel Market REPORT HIGHLIGHTS
| Aspects | Details |
|---|---|
| Study Period | 2019-2033 |
| Base Year | 2024 |
| Estimated Year | 2025 |
| Forecast Period | 2025-2033 |
| Historical Period | 2019-2024 |
| Growth Rate | CAGR of > 20.86% from 2019-2033 |
| Segmentation |
|
Table of Contents
- 1. Introduction
- 1.1. Research Scope
- 1.2. Market Segmentation
- 1.3. Research Methodology
- 1.4. Definitions and Assumptions
- 2. Executive Summary
- 2.1. Introduction
- 3. Market Dynamics
- 3.1. Introduction
- 3.2. Market Drivers
- 3.2.1. 4.; Increasing Demand for Petroleum Products Due to the Growth of the Local Economy4.; Government Initiatives to Boost the Production of Crude Oil and Natural Gas
- 3.3. Market Restrains
- 3.3.1. 4.; Increasing Adoption of Renewable Energy
- 3.4. Market Trends
- 3.4.1. Air Turbine Fuel (ATF) Type to Dominate the Market
- 4. Market Factor Analysis
- 4.1. Porters Five Forces
- 4.2. Supply/Value Chain
- 4.3. PESTEL analysis
- 4.4. Market Entropy
- 4.5. Patent/Trademark Analysis
- 5. Global Commercial Aircraft Aviation Fuel Market Analysis, Insights and Forecast, 2019-2031
- 5.1. Market Analysis, Insights and Forecast - by Fuel Type
- 5.1.1. Air Turbine Fuel (ATF)
- 5.1.2. Aviation Biofuel
- 5.1.3. Other Fuel Types
- 5.2. Market Analysis, Insights and Forecast - by Region
- 5.2.1. North America
- 5.2.2. Europe
- 5.2.3. Asia Pacific
- 5.2.4. South America
- 5.2.5. Middle East and Africa
- 5.1. Market Analysis, Insights and Forecast - by Fuel Type
- 6. North America Commercial Aircraft Aviation Fuel Market Analysis, Insights and Forecast, 2019-2031
- 6.1. Market Analysis, Insights and Forecast - by Fuel Type
- 6.1.1. Air Turbine Fuel (ATF)
- 6.1.2. Aviation Biofuel
- 6.1.3. Other Fuel Types
- 6.1. Market Analysis, Insights and Forecast - by Fuel Type
- 7. Europe Commercial Aircraft Aviation Fuel Market Analysis, Insights and Forecast, 2019-2031
- 7.1. Market Analysis, Insights and Forecast - by Fuel Type
- 7.1.1. Air Turbine Fuel (ATF)
- 7.1.2. Aviation Biofuel
- 7.1.3. Other Fuel Types
- 7.1. Market Analysis, Insights and Forecast - by Fuel Type
- 8. Asia Pacific Commercial Aircraft Aviation Fuel Market Analysis, Insights and Forecast, 2019-2031
- 8.1. Market Analysis, Insights and Forecast - by Fuel Type
- 8.1.1. Air Turbine Fuel (ATF)
- 8.1.2. Aviation Biofuel
- 8.1.3. Other Fuel Types
- 8.1. Market Analysis, Insights and Forecast - by Fuel Type
- 9. South America Commercial Aircraft Aviation Fuel Market Analysis, Insights and Forecast, 2019-2031
- 9.1. Market Analysis, Insights and Forecast - by Fuel Type
- 9.1.1. Air Turbine Fuel (ATF)
- 9.1.2. Aviation Biofuel
- 9.1.3. Other Fuel Types
- 9.1. Market Analysis, Insights and Forecast - by Fuel Type
- 10. Middle East and Africa Commercial Aircraft Aviation Fuel Market Analysis, Insights and Forecast, 2019-2031
- 10.1. Market Analysis, Insights and Forecast - by Fuel Type
- 10.1.1. Air Turbine Fuel (ATF)
- 10.1.2. Aviation Biofuel
- 10.1.3. Other Fuel Types
- 10.1. Market Analysis, Insights and Forecast - by Fuel Type
- 11. North America Commercial Aircraft Aviation Fuel Market Analysis, Insights and Forecast, 2019-2031
- 11.1. Market Analysis, Insights and Forecast - By Country/Sub-region
- 11.1.1 United States
- 11.1.2 Canada
- 11.1.3 Mexico
- 12. Europe Commercial Aircraft Aviation Fuel Market Analysis, Insights and Forecast, 2019-2031
- 12.1. Market Analysis, Insights and Forecast - By Country/Sub-region
- 12.1.1 Germany
- 12.1.2 United Kingdom
- 12.1.3 France
- 12.1.4 Spain
- 12.1.5 Italy
- 12.1.6 Spain
- 12.1.7 Belgium
- 12.1.8 Netherland
- 12.1.9 Nordics
- 12.1.10 Rest of Europe
- 13. Asia Pacific Commercial Aircraft Aviation Fuel Market Analysis, Insights and Forecast, 2019-2031
- 13.1. Market Analysis, Insights and Forecast - By Country/Sub-region
- 13.1.1 China
- 13.1.2 Japan
- 13.1.3 India
- 13.1.4 South Korea
- 13.1.5 Southeast Asia
- 13.1.6 Australia
- 13.1.7 Indonesia
- 13.1.8 Phillipes
- 13.1.9 Singapore
- 13.1.10 Thailandc
- 13.1.11 Rest of Asia Pacific
- 14. South America Commercial Aircraft Aviation Fuel Market Analysis, Insights and Forecast, 2019-2031
- 14.1. Market Analysis, Insights and Forecast - By Country/Sub-region
- 14.1.1 Brazil
- 14.1.2 Argentina
- 14.1.3 Peru
- 14.1.4 Chile
- 14.1.5 Colombia
- 14.1.6 Ecuador
- 14.1.7 Venezuela
- 14.1.8 Rest of South America
- 15. North America Commercial Aircraft Aviation Fuel Market Analysis, Insights and Forecast, 2019-2031
- 15.1. Market Analysis, Insights and Forecast - By Country/Sub-region
- 15.1.1 United States
- 15.1.2 Canada
- 15.1.3 Mexico
- 16. MEA Commercial Aircraft Aviation Fuel Market Analysis, Insights and Forecast, 2019-2031
- 16.1. Market Analysis, Insights and Forecast - By Country/Sub-region
- 16.1.1 United Arab Emirates
- 16.1.2 Saudi Arabia
- 16.1.3 South Africa
- 16.1.4 Rest of Middle East and Africa
- 17. Competitive Analysis
- 17.1. Global Market Share Analysis 2024
- 17.2. Company Profiles
- 17.2.1 1 Neste Oyj
- 17.2.1.1. Overview
- 17.2.1.2. Products
- 17.2.1.3. SWOT Analysis
- 17.2.1.4. Recent Developments
- 17.2.1.5. Financials (Based on Availability)
- 17.2.2 Renewable Aviation Fuel Suppliers
- 17.2.2.1. Overview
- 17.2.2.2. Products
- 17.2.2.3. SWOT Analysis
- 17.2.2.4. Recent Developments
- 17.2.2.5. Financials (Based on Availability)
- 17.2.3 4 Honeywell International Inc *List Not Exhaustive
- 17.2.3.1. Overview
- 17.2.3.2. Products
- 17.2.3.3. SWOT Analysis
- 17.2.3.4. Recent Developments
- 17.2.3.5. Financials (Based on Availability)
- 17.2.4 1 Exxon Mobil Corporation
- 17.2.4.1. Overview
- 17.2.4.2. Products
- 17.2.4.3. SWOT Analysis
- 17.2.4.4. Recent Developments
- 17.2.4.5. Financials (Based on Availability)
- 17.2.5 2 Shell PLC
- 17.2.5.1. Overview
- 17.2.5.2. Products
- 17.2.5.3. SWOT Analysis
- 17.2.5.4. Recent Developments
- 17.2.5.5. Financials (Based on Availability)
- 17.2.6 5 Chevron Corporation
- 17.2.6.1. Overview
- 17.2.6.2. Products
- 17.2.6.3. SWOT Analysis
- 17.2.6.4. Recent Developments
- 17.2.6.5. Financials (Based on Availability)
- 17.2.7 3 TotalEnergies SE
- 17.2.7.1. Overview
- 17.2.7.2. Products
- 17.2.7.3. SWOT Analysis
- 17.2.7.4. Recent Developments
- 17.2.7.5. Financials (Based on Availability)
- 17.2.8 Conventional Aviation Fuel Suppliers
- 17.2.8.1. Overview
- 17.2.8.2. Products
- 17.2.8.3. SWOT Analysis
- 17.2.8.4. Recent Developments
- 17.2.8.5. Financials (Based on Availability)
- 17.2.9 3 Gevo Inc
- 17.2.9.1. Overview
- 17.2.9.2. Products
- 17.2.9.3. SWOT Analysis
- 17.2.9.4. Recent Developments
- 17.2.9.5. Financials (Based on Availability)
- 17.2.10 2 Swedish Biofuels AB
- 17.2.10.1. Overview
- 17.2.10.2. Products
- 17.2.10.3. SWOT Analysis
- 17.2.10.4. Recent Developments
- 17.2.10.5. Financials (Based on Availability)
- 17.2.11 4 BP PLC
- 17.2.11.1. Overview
- 17.2.11.2. Products
- 17.2.11.3. SWOT Analysis
- 17.2.11.4. Recent Developments
- 17.2.11.5. Financials (Based on Availability)
- 17.2.1 1 Neste Oyj
List of Figures
- Figure 1: Global Commercial Aircraft Aviation Fuel Market Revenue Breakdown (Million, %) by Region 2024 & 2032
- Figure 2: Global Commercial Aircraft Aviation Fuel Market Volume Breakdown (K Tons, %) by Region 2024 & 2032
- Figure 3: North America Commercial Aircraft Aviation Fuel Market Revenue (Million), by Country 2024 & 2032
- Figure 4: North America Commercial Aircraft Aviation Fuel Market Volume (K Tons), by Country 2024 & 2032
- Figure 5: North America Commercial Aircraft Aviation Fuel Market Revenue Share (%), by Country 2024 & 2032
- Figure 6: North America Commercial Aircraft Aviation Fuel Market Volume Share (%), by Country 2024 & 2032
- Figure 7: Europe Commercial Aircraft Aviation Fuel Market Revenue (Million), by Country 2024 & 2032
- Figure 8: Europe Commercial Aircraft Aviation Fuel Market Volume (K Tons), by Country 2024 & 2032
- Figure 9: Europe Commercial Aircraft Aviation Fuel Market Revenue Share (%), by Country 2024 & 2032
- Figure 10: Europe Commercial Aircraft Aviation Fuel Market Volume Share (%), by Country 2024 & 2032
- Figure 11: Asia Pacific Commercial Aircraft Aviation Fuel Market Revenue (Million), by Country 2024 & 2032
- Figure 12: Asia Pacific Commercial Aircraft Aviation Fuel Market Volume (K Tons), by Country 2024 & 2032
- Figure 13: Asia Pacific Commercial Aircraft Aviation Fuel Market Revenue Share (%), by Country 2024 & 2032
- Figure 14: Asia Pacific Commercial Aircraft Aviation Fuel Market Volume Share (%), by Country 2024 & 2032
- Figure 15: South America Commercial Aircraft Aviation Fuel Market Revenue (Million), by Country 2024 & 2032
- Figure 16: South America Commercial Aircraft Aviation Fuel Market Volume (K Tons), by Country 2024 & 2032
- Figure 17: South America Commercial Aircraft Aviation Fuel Market Revenue Share (%), by Country 2024 & 2032
- Figure 18: South America Commercial Aircraft Aviation Fuel Market Volume Share (%), by Country 2024 & 2032
- Figure 19: North America Commercial Aircraft Aviation Fuel Market Revenue (Million), by Country 2024 & 2032
- Figure 20: North America Commercial Aircraft Aviation Fuel Market Volume (K Tons), by Country 2024 & 2032
- Figure 21: North America Commercial Aircraft Aviation Fuel Market Revenue Share (%), by Country 2024 & 2032
- Figure 22: North America Commercial Aircraft Aviation Fuel Market Volume Share (%), by Country 2024 & 2032
- Figure 23: MEA Commercial Aircraft Aviation Fuel Market Revenue (Million), by Country 2024 & 2032
- Figure 24: MEA Commercial Aircraft Aviation Fuel Market Volume (K Tons), by Country 2024 & 2032
- Figure 25: MEA Commercial Aircraft Aviation Fuel Market Revenue Share (%), by Country 2024 & 2032
- Figure 26: MEA Commercial Aircraft Aviation Fuel Market Volume Share (%), by Country 2024 & 2032
- Figure 27: North America Commercial Aircraft Aviation Fuel Market Revenue (Million), by Fuel Type 2024 & 2032
- Figure 28: North America Commercial Aircraft Aviation Fuel Market Volume (K Tons), by Fuel Type 2024 & 2032
- Figure 29: North America Commercial Aircraft Aviation Fuel Market Revenue Share (%), by Fuel Type 2024 & 2032
- Figure 30: North America Commercial Aircraft Aviation Fuel Market Volume Share (%), by Fuel Type 2024 & 2032
- Figure 31: North America Commercial Aircraft Aviation Fuel Market Revenue (Million), by Country 2024 & 2032
- Figure 32: North America Commercial Aircraft Aviation Fuel Market Volume (K Tons), by Country 2024 & 2032
- Figure 33: North America Commercial Aircraft Aviation Fuel Market Revenue Share (%), by Country 2024 & 2032
- Figure 34: North America Commercial Aircraft Aviation Fuel Market Volume Share (%), by Country 2024 & 2032
- Figure 35: Europe Commercial Aircraft Aviation Fuel Market Revenue (Million), by Fuel Type 2024 & 2032
- Figure 36: Europe Commercial Aircraft Aviation Fuel Market Volume (K Tons), by Fuel Type 2024 & 2032
- Figure 37: Europe Commercial Aircraft Aviation Fuel Market Revenue Share (%), by Fuel Type 2024 & 2032
- Figure 38: Europe Commercial Aircraft Aviation Fuel Market Volume Share (%), by Fuel Type 2024 & 2032
- Figure 39: Europe Commercial Aircraft Aviation Fuel Market Revenue (Million), by Country 2024 & 2032
- Figure 40: Europe Commercial Aircraft Aviation Fuel Market Volume (K Tons), by Country 2024 & 2032
- Figure 41: Europe Commercial Aircraft Aviation Fuel Market Revenue Share (%), by Country 2024 & 2032
- Figure 42: Europe Commercial Aircraft Aviation Fuel Market Volume Share (%), by Country 2024 & 2032
- Figure 43: Asia Pacific Commercial Aircraft Aviation Fuel Market Revenue (Million), by Fuel Type 2024 & 2032
- Figure 44: Asia Pacific Commercial Aircraft Aviation Fuel Market Volume (K Tons), by Fuel Type 2024 & 2032
- Figure 45: Asia Pacific Commercial Aircraft Aviation Fuel Market Revenue Share (%), by Fuel Type 2024 & 2032
- Figure 46: Asia Pacific Commercial Aircraft Aviation Fuel Market Volume Share (%), by Fuel Type 2024 & 2032
- Figure 47: Asia Pacific Commercial Aircraft Aviation Fuel Market Revenue (Million), by Country 2024 & 2032
- Figure 48: Asia Pacific Commercial Aircraft Aviation Fuel Market Volume (K Tons), by Country 2024 & 2032
- Figure 49: Asia Pacific Commercial Aircraft Aviation Fuel Market Revenue Share (%), by Country 2024 & 2032
- Figure 50: Asia Pacific Commercial Aircraft Aviation Fuel Market Volume Share (%), by Country 2024 & 2032
- Figure 51: South America Commercial Aircraft Aviation Fuel Market Revenue (Million), by Fuel Type 2024 & 2032
- Figure 52: South America Commercial Aircraft Aviation Fuel Market Volume (K Tons), by Fuel Type 2024 & 2032
- Figure 53: South America Commercial Aircraft Aviation Fuel Market Revenue Share (%), by Fuel Type 2024 & 2032
- Figure 54: South America Commercial Aircraft Aviation Fuel Market Volume Share (%), by Fuel Type 2024 & 2032
- Figure 55: South America Commercial Aircraft Aviation Fuel Market Revenue (Million), by Country 2024 & 2032
- Figure 56: South America Commercial Aircraft Aviation Fuel Market Volume (K Tons), by Country 2024 & 2032
- Figure 57: South America Commercial Aircraft Aviation Fuel Market Revenue Share (%), by Country 2024 & 2032
- Figure 58: South America Commercial Aircraft Aviation Fuel Market Volume Share (%), by Country 2024 & 2032
- Figure 59: Middle East and Africa Commercial Aircraft Aviation Fuel Market Revenue (Million), by Fuel Type 2024 & 2032
- Figure 60: Middle East and Africa Commercial Aircraft Aviation Fuel Market Volume (K Tons), by Fuel Type 2024 & 2032
- Figure 61: Middle East and Africa Commercial Aircraft Aviation Fuel Market Revenue Share (%), by Fuel Type 2024 & 2032
- Figure 62: Middle East and Africa Commercial Aircraft Aviation Fuel Market Volume Share (%), by Fuel Type 2024 & 2032
- Figure 63: Middle East and Africa Commercial Aircraft Aviation Fuel Market Revenue (Million), by Country 2024 & 2032
- Figure 64: Middle East and Africa Commercial Aircraft Aviation Fuel Market Volume (K Tons), by Country 2024 & 2032
- Figure 65: Middle East and Africa Commercial Aircraft Aviation Fuel Market Revenue Share (%), by Country 2024 & 2032
- Figure 66: Middle East and Africa Commercial Aircraft Aviation Fuel Market Volume Share (%), by Country 2024 & 2032
List of Tables
- Table 1: Global Commercial Aircraft Aviation Fuel Market Revenue Million Forecast, by Region 2019 & 2032
- Table 2: Global Commercial Aircraft Aviation Fuel Market Volume K Tons Forecast, by Region 2019 & 2032
- Table 3: Global Commercial Aircraft Aviation Fuel Market Revenue Million Forecast, by Fuel Type 2019 & 2032
- Table 4: Global Commercial Aircraft Aviation Fuel Market Volume K Tons Forecast, by Fuel Type 2019 & 2032
- Table 5: Global Commercial Aircraft Aviation Fuel Market Revenue Million Forecast, by Region 2019 & 2032
- Table 6: Global Commercial Aircraft Aviation Fuel Market Volume K Tons Forecast, by Region 2019 & 2032
- Table 7: Global Commercial Aircraft Aviation Fuel Market Revenue Million Forecast, by Country 2019 & 2032
- Table 8: Global Commercial Aircraft Aviation Fuel Market Volume K Tons Forecast, by Country 2019 & 2032
- Table 9: United States Commercial Aircraft Aviation Fuel Market Revenue (Million) Forecast, by Application 2019 & 2032
- Table 10: United States Commercial Aircraft Aviation Fuel Market Volume (K Tons) Forecast, by Application 2019 & 2032
- Table 11: Canada Commercial Aircraft Aviation Fuel Market Revenue (Million) Forecast, by Application 2019 & 2032
- Table 12: Canada Commercial Aircraft Aviation Fuel Market Volume (K Tons) Forecast, by Application 2019 & 2032
- Table 13: Mexico Commercial Aircraft Aviation Fuel Market Revenue (Million) Forecast, by Application 2019 & 2032
- Table 14: Mexico Commercial Aircraft Aviation Fuel Market Volume (K Tons) Forecast, by Application 2019 & 2032
- Table 15: Global Commercial Aircraft Aviation Fuel Market Revenue Million Forecast, by Country 2019 & 2032
- Table 16: Global Commercial Aircraft Aviation Fuel Market Volume K Tons Forecast, by Country 2019 & 2032
- Table 17: Germany Commercial Aircraft Aviation Fuel Market Revenue (Million) Forecast, by Application 2019 & 2032
- Table 18: Germany Commercial Aircraft Aviation Fuel Market Volume (K Tons) Forecast, by Application 2019 & 2032
- Table 19: United Kingdom Commercial Aircraft Aviation Fuel Market Revenue (Million) Forecast, by Application 2019 & 2032
- Table 20: United Kingdom Commercial Aircraft Aviation Fuel Market Volume (K Tons) Forecast, by Application 2019 & 2032
- Table 21: France Commercial Aircraft Aviation Fuel Market Revenue (Million) Forecast, by Application 2019 & 2032
- Table 22: France Commercial Aircraft Aviation Fuel Market Volume (K Tons) Forecast, by Application 2019 & 2032
- Table 23: Spain Commercial Aircraft Aviation Fuel Market Revenue (Million) Forecast, by Application 2019 & 2032
- Table 24: Spain Commercial Aircraft Aviation Fuel Market Volume (K Tons) Forecast, by Application 2019 & 2032
- Table 25: Italy Commercial Aircraft Aviation Fuel Market Revenue (Million) Forecast, by Application 2019 & 2032
- Table 26: Italy Commercial Aircraft Aviation Fuel Market Volume (K Tons) Forecast, by Application 2019 & 2032
- Table 27: Spain Commercial Aircraft Aviation Fuel Market Revenue (Million) Forecast, by Application 2019 & 2032
- Table 28: Spain Commercial Aircraft Aviation Fuel Market Volume (K Tons) Forecast, by Application 2019 & 2032
- Table 29: Belgium Commercial Aircraft Aviation Fuel Market Revenue (Million) Forecast, by Application 2019 & 2032
- Table 30: Belgium Commercial Aircraft Aviation Fuel Market Volume (K Tons) Forecast, by Application 2019 & 2032
- Table 31: Netherland Commercial Aircraft Aviation Fuel Market Revenue (Million) Forecast, by Application 2019 & 2032
- Table 32: Netherland Commercial Aircraft Aviation Fuel Market Volume (K Tons) Forecast, by Application 2019 & 2032
- Table 33: Nordics Commercial Aircraft Aviation Fuel Market Revenue (Million) Forecast, by Application 2019 & 2032
- Table 34: Nordics Commercial Aircraft Aviation Fuel Market Volume (K Tons) Forecast, by Application 2019 & 2032
- Table 35: Rest of Europe Commercial Aircraft Aviation Fuel Market Revenue (Million) Forecast, by Application 2019 & 2032
- Table 36: Rest of Europe Commercial Aircraft Aviation Fuel Market Volume (K Tons) Forecast, by Application 2019 & 2032
- Table 37: Global Commercial Aircraft Aviation Fuel Market Revenue Million Forecast, by Country 2019 & 2032
- Table 38: Global Commercial Aircraft Aviation Fuel Market Volume K Tons Forecast, by Country 2019 & 2032
- Table 39: China Commercial Aircraft Aviation Fuel Market Revenue (Million) Forecast, by Application 2019 & 2032
- Table 40: China Commercial Aircraft Aviation Fuel Market Volume (K Tons) Forecast, by Application 2019 & 2032
- Table 41: Japan Commercial Aircraft Aviation Fuel Market Revenue (Million) Forecast, by Application 2019 & 2032
- Table 42: Japan Commercial Aircraft Aviation Fuel Market Volume (K Tons) Forecast, by Application 2019 & 2032
- Table 43: India Commercial Aircraft Aviation Fuel Market Revenue (Million) Forecast, by Application 2019 & 2032
- Table 44: India Commercial Aircraft Aviation Fuel Market Volume (K Tons) Forecast, by Application 2019 & 2032
- Table 45: South Korea Commercial Aircraft Aviation Fuel Market Revenue (Million) Forecast, by Application 2019 & 2032
- Table 46: South Korea Commercial Aircraft Aviation Fuel Market Volume (K Tons) Forecast, by Application 2019 & 2032
- Table 47: Southeast Asia Commercial Aircraft Aviation Fuel Market Revenue (Million) Forecast, by Application 2019 & 2032
- Table 48: Southeast Asia Commercial Aircraft Aviation Fuel Market Volume (K Tons) Forecast, by Application 2019 & 2032
- Table 49: Australia Commercial Aircraft Aviation Fuel Market Revenue (Million) Forecast, by Application 2019 & 2032
- Table 50: Australia Commercial Aircraft Aviation Fuel Market Volume (K Tons) Forecast, by Application 2019 & 2032
- Table 51: Indonesia Commercial Aircraft Aviation Fuel Market Revenue (Million) Forecast, by Application 2019 & 2032
- Table 52: Indonesia Commercial Aircraft Aviation Fuel Market Volume (K Tons) Forecast, by Application 2019 & 2032
- Table 53: Phillipes Commercial Aircraft Aviation Fuel Market Revenue (Million) Forecast, by Application 2019 & 2032
- Table 54: Phillipes Commercial Aircraft Aviation Fuel Market Volume (K Tons) Forecast, by Application 2019 & 2032
- Table 55: Singapore Commercial Aircraft Aviation Fuel Market Revenue (Million) Forecast, by Application 2019 & 2032
- Table 56: Singapore Commercial Aircraft Aviation Fuel Market Volume (K Tons) Forecast, by Application 2019 & 2032
- Table 57: Thailandc Commercial Aircraft Aviation Fuel Market Revenue (Million) Forecast, by Application 2019 & 2032
- Table 58: Thailandc Commercial Aircraft Aviation Fuel Market Volume (K Tons) Forecast, by Application 2019 & 2032
- Table 59: Rest of Asia Pacific Commercial Aircraft Aviation Fuel Market Revenue (Million) Forecast, by Application 2019 & 2032
- Table 60: Rest of Asia Pacific Commercial Aircraft Aviation Fuel Market Volume (K Tons) Forecast, by Application 2019 & 2032
- Table 61: Global Commercial Aircraft Aviation Fuel Market Revenue Million Forecast, by Country 2019 & 2032
- Table 62: Global Commercial Aircraft Aviation Fuel Market Volume K Tons Forecast, by Country 2019 & 2032
- Table 63: Brazil Commercial Aircraft Aviation Fuel Market Revenue (Million) Forecast, by Application 2019 & 2032
- Table 64: Brazil Commercial Aircraft Aviation Fuel Market Volume (K Tons) Forecast, by Application 2019 & 2032
- Table 65: Argentina Commercial Aircraft Aviation Fuel Market Revenue (Million) Forecast, by Application 2019 & 2032
- Table 66: Argentina Commercial Aircraft Aviation Fuel Market Volume (K Tons) Forecast, by Application 2019 & 2032
- Table 67: Peru Commercial Aircraft Aviation Fuel Market Revenue (Million) Forecast, by Application 2019 & 2032
- Table 68: Peru Commercial Aircraft Aviation Fuel Market Volume (K Tons) Forecast, by Application 2019 & 2032
- Table 69: Chile Commercial Aircraft Aviation Fuel Market Revenue (Million) Forecast, by Application 2019 & 2032
- Table 70: Chile Commercial Aircraft Aviation Fuel Market Volume (K Tons) Forecast, by Application 2019 & 2032
- Table 71: Colombia Commercial Aircraft Aviation Fuel Market Revenue (Million) Forecast, by Application 2019 & 2032
- Table 72: Colombia Commercial Aircraft Aviation Fuel Market Volume (K Tons) Forecast, by Application 2019 & 2032
- Table 73: Ecuador Commercial Aircraft Aviation Fuel Market Revenue (Million) Forecast, by Application 2019 & 2032
- Table 74: Ecuador Commercial Aircraft Aviation Fuel Market Volume (K Tons) Forecast, by Application 2019 & 2032
- Table 75: Venezuela Commercial Aircraft Aviation Fuel Market Revenue (Million) Forecast, by Application 2019 & 2032
- Table 76: Venezuela Commercial Aircraft Aviation Fuel Market Volume (K Tons) Forecast, by Application 2019 & 2032
- Table 77: Rest of South America Commercial Aircraft Aviation Fuel Market Revenue (Million) Forecast, by Application 2019 & 2032
- Table 78: Rest of South America Commercial Aircraft Aviation Fuel Market Volume (K Tons) Forecast, by Application 2019 & 2032
- Table 79: Global Commercial Aircraft Aviation Fuel Market Revenue Million Forecast, by Country 2019 & 2032
- Table 80: Global Commercial Aircraft Aviation Fuel Market Volume K Tons Forecast, by Country 2019 & 2032
- Table 81: United States Commercial Aircraft Aviation Fuel Market Revenue (Million) Forecast, by Application 2019 & 2032
- Table 82: United States Commercial Aircraft Aviation Fuel Market Volume (K Tons) Forecast, by Application 2019 & 2032
- Table 83: Canada Commercial Aircraft Aviation Fuel Market Revenue (Million) Forecast, by Application 2019 & 2032
- Table 84: Canada Commercial Aircraft Aviation Fuel Market Volume (K Tons) Forecast, by Application 2019 & 2032
- Table 85: Mexico Commercial Aircraft Aviation Fuel Market Revenue (Million) Forecast, by Application 2019 & 2032
- Table 86: Mexico Commercial Aircraft Aviation Fuel Market Volume (K Tons) Forecast, by Application 2019 & 2032
- Table 87: Global Commercial Aircraft Aviation Fuel Market Revenue Million Forecast, by Country 2019 & 2032
- Table 88: Global Commercial Aircraft Aviation Fuel Market Volume K Tons Forecast, by Country 2019 & 2032
- Table 89: United Arab Emirates Commercial Aircraft Aviation Fuel Market Revenue (Million) Forecast, by Application 2019 & 2032
- Table 90: United Arab Emirates Commercial Aircraft Aviation Fuel Market Volume (K Tons) Forecast, by Application 2019 & 2032
- Table 91: Saudi Arabia Commercial Aircraft Aviation Fuel Market Revenue (Million) Forecast, by Application 2019 & 2032
- Table 92: Saudi Arabia Commercial Aircraft Aviation Fuel Market Volume (K Tons) Forecast, by Application 2019 & 2032
- Table 93: South Africa Commercial Aircraft Aviation Fuel Market Revenue (Million) Forecast, by Application 2019 & 2032
- Table 94: South Africa Commercial Aircraft Aviation Fuel Market Volume (K Tons) Forecast, by Application 2019 & 2032
- Table 95: Rest of Middle East and Africa Commercial Aircraft Aviation Fuel Market Revenue (Million) Forecast, by Application 2019 & 2032
- Table 96: Rest of Middle East and Africa Commercial Aircraft Aviation Fuel Market Volume (K Tons) Forecast, by Application 2019 & 2032
- Table 97: Global Commercial Aircraft Aviation Fuel Market Revenue Million Forecast, by Fuel Type 2019 & 2032
- Table 98: Global Commercial Aircraft Aviation Fuel Market Volume K Tons Forecast, by Fuel Type 2019 & 2032
- Table 99: Global Commercial Aircraft Aviation Fuel Market Revenue Million Forecast, by Country 2019 & 2032
- Table 100: Global Commercial Aircraft Aviation Fuel Market Volume K Tons Forecast, by Country 2019 & 2032
- Table 101: Global Commercial Aircraft Aviation Fuel Market Revenue Million Forecast, by Fuel Type 2019 & 2032
- Table 102: Global Commercial Aircraft Aviation Fuel Market Volume K Tons Forecast, by Fuel Type 2019 & 2032
- Table 103: Global Commercial Aircraft Aviation Fuel Market Revenue Million Forecast, by Country 2019 & 2032
- Table 104: Global Commercial Aircraft Aviation Fuel Market Volume K Tons Forecast, by Country 2019 & 2032
- Table 105: Global Commercial Aircraft Aviation Fuel Market Revenue Million Forecast, by Fuel Type 2019 & 2032
- Table 106: Global Commercial Aircraft Aviation Fuel Market Volume K Tons Forecast, by Fuel Type 2019 & 2032
- Table 107: Global Commercial Aircraft Aviation Fuel Market Revenue Million Forecast, by Country 2019 & 2032
- Table 108: Global Commercial Aircraft Aviation Fuel Market Volume K Tons Forecast, by Country 2019 & 2032
- Table 109: Global Commercial Aircraft Aviation Fuel Market Revenue Million Forecast, by Fuel Type 2019 & 2032
- Table 110: Global Commercial Aircraft Aviation Fuel Market Volume K Tons Forecast, by Fuel Type 2019 & 2032
- Table 111: Global Commercial Aircraft Aviation Fuel Market Revenue Million Forecast, by Country 2019 & 2032
- Table 112: Global Commercial Aircraft Aviation Fuel Market Volume K Tons Forecast, by Country 2019 & 2032
- Table 113: Global Commercial Aircraft Aviation Fuel Market Revenue Million Forecast, by Fuel Type 2019 & 2032
- Table 114: Global Commercial Aircraft Aviation Fuel Market Volume K Tons Forecast, by Fuel Type 2019 & 2032
- Table 115: Global Commercial Aircraft Aviation Fuel Market Revenue Million Forecast, by Country 2019 & 2032
- Table 116: Global Commercial Aircraft Aviation Fuel Market Volume K Tons Forecast, by Country 2019 & 2032
Frequently Asked Questions
1. What is the projected Compound Annual Growth Rate (CAGR) of the Commercial Aircraft Aviation Fuel Market?
The projected CAGR is approximately > 20.86%.
2. Which companies are prominent players in the Commercial Aircraft Aviation Fuel Market?
Key companies in the market include 1 Neste Oyj, Renewable Aviation Fuel Suppliers, 4 Honeywell International Inc *List Not Exhaustive, 1 Exxon Mobil Corporation, 2 Shell PLC, 5 Chevron Corporation, 3 TotalEnergies SE, Conventional Aviation Fuel Suppliers, 3 Gevo Inc, 2 Swedish Biofuels AB, 4 BP PLC.
3. What are the main segments of the Commercial Aircraft Aviation Fuel Market?
The market segments include Fuel Type.
4. Can you provide details about the market size?
The market size is estimated to be USD 220100 Million as of 2022.
5. What are some drivers contributing to market growth?
4.; Increasing Demand for Petroleum Products Due to the Growth of the Local Economy4.; Government Initiatives to Boost the Production of Crude Oil and Natural Gas.
6. What are the notable trends driving market growth?
Air Turbine Fuel (ATF) Type to Dominate the Market.
7. Are there any restraints impacting market growth?
4.; Increasing Adoption of Renewable Energy.
8. Can you provide examples of recent developments in the market?
March 2022: United Airlines, through its corporate venture capital fund, United Airlines Ventures (UAV), and with Oxy Low Carbon Ventures (a subsidiary of Occidental), have announced a collaboration with Houston-based biotech firm CemvitaFactory to commercialize the production of sustainable aviation fuel (SAF), developed through a new process using carbon dioxide (CO2) and synthetic microbes.
9. What pricing options are available for accessing the report?
Pricing options include single-user, multi-user, and enterprise licenses priced at USD 4750, USD 5250, and USD 8750 respectively.
10. Is the market size provided in terms of value or volume?
The market size is provided in terms of value, measured in Million and volume, measured in K Tons.
11. Are there any specific market keywords associated with the report?
Yes, the market keyword associated with the report is "Commercial Aircraft Aviation Fuel Market," which aids in identifying and referencing the specific market segment covered.
12. How do I determine which pricing option suits my needs best?
The pricing options vary based on user requirements and access needs. Individual users may opt for single-user licenses, while businesses requiring broader access may choose multi-user or enterprise licenses for cost-effective access to the report.
13. Are there any additional resources or data provided in the Commercial Aircraft Aviation Fuel Market report?
While the report offers comprehensive insights, it's advisable to review the specific contents or supplementary materials provided to ascertain if additional resources or data are available.
14. How can I stay updated on further developments or reports in the Commercial Aircraft Aviation Fuel Market?
To stay informed about further developments, trends, and reports in the Commercial Aircraft Aviation Fuel Market, consider subscribing to industry newsletters, following relevant companies and organizations, or regularly checking reputable industry news sources and publications.
Methodology
Step 1 - Identification of Relevant Samples Size from Population Database


Step 2 - Approaches for Defining Global Market Size (Value, Volume* & Price*)

Note*: In applicable scenarios
Step 3 - Data Sources
Primary Research
- Web Analytics
- Survey Reports
- Research Institute
- Latest Research Reports
- Opinion Leaders
Secondary Research
- Annual Reports
- White Paper
- Latest Press Release
- Industry Association
- Paid Database
- Investor Presentations

Step 4 - Data Triangulation
Involves using different sources of information in order to increase the validity of a study
These sources are likely to be stakeholders in a program - participants, other researchers, program staff, other community members, and so on.
Then we put all data in single framework & apply various statistical tools to find out the dynamic on the market.
During the analysis stage, feedback from the stakeholder groups would be compared to determine areas of agreement as well as areas of divergence


