
Key Insights
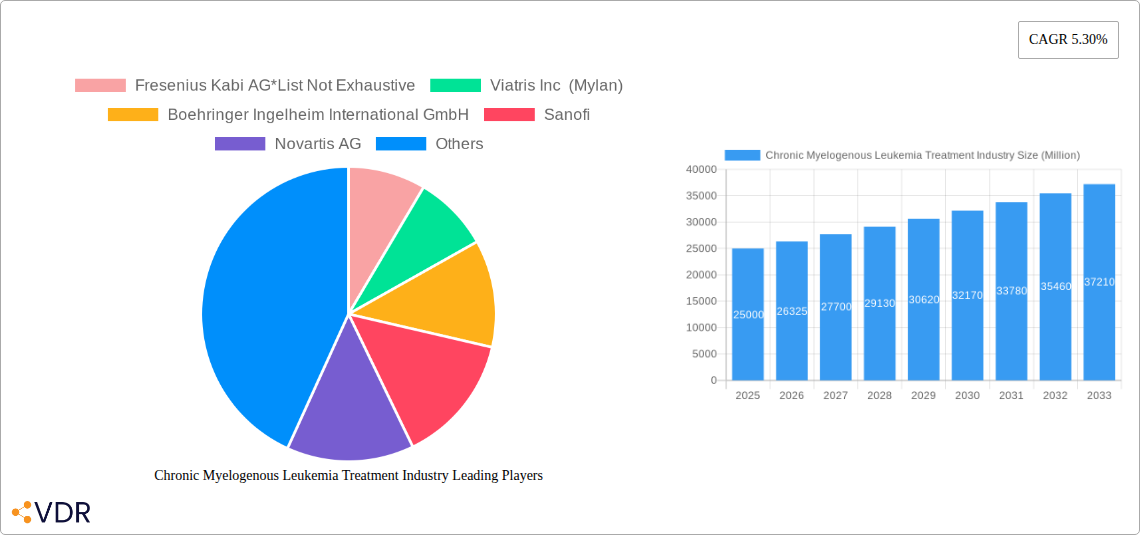
The Chronic Myelogenous Leukemia (CML) treatment market is a significant and growing sector within the oncology landscape. Driven by rising CML incidence rates globally, particularly in developing economies with expanding healthcare infrastructure, and advancements in targeted therapies like tyrosine kinase inhibitors (TKIs), the market is projected to experience substantial growth. The 5.30% CAGR indicates a consistent expansion, fueled by improved patient outcomes and longer survival rates associated with more effective and tolerable treatment regimens. While the initial high cost of TKI therapies can be a restraint, the long-term cost-effectiveness due to improved quality of life and reduced hospitalization needs is mitigating this factor. The market is segmented by treatment type, with targeted therapy representing the largest segment due to its efficacy and reduced side effects compared to traditional chemotherapy. Biologic therapies are also contributing significantly to market growth, further showcasing the shift toward more precise and personalized treatment approaches. Competition among key players like Novartis, Bristol-Myers Squibb, and Pfizer, along with the emergence of biosimilars, is driving innovation and pricing pressures, creating a dynamic and evolving market environment.
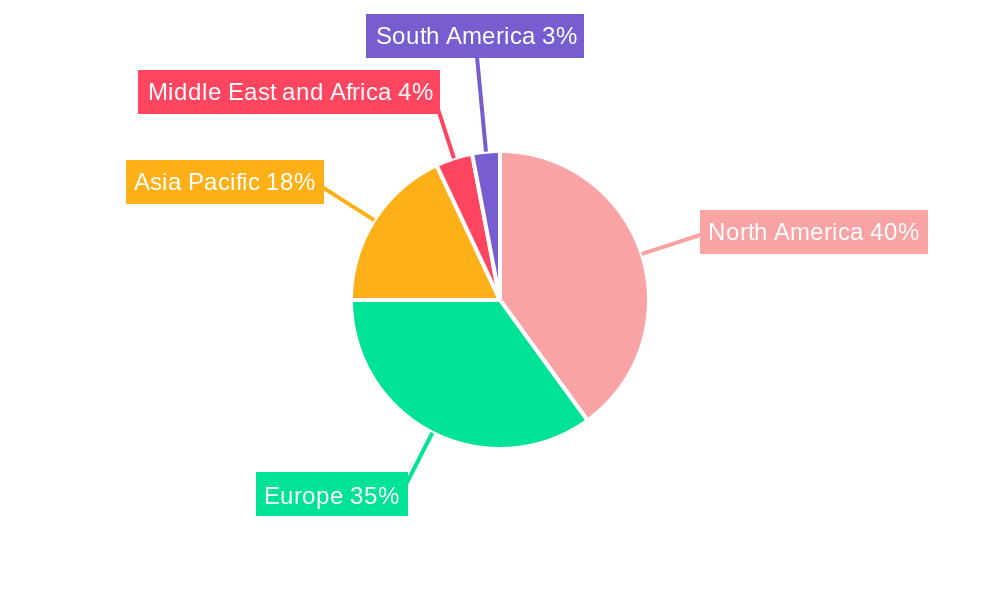
The geographical distribution of the CML treatment market reflects variations in healthcare access and affordability. North America and Europe, with their well-established healthcare systems, currently hold a significant market share. However, the Asia-Pacific region is poised for rapid growth due to the increasing prevalence of CML and rising healthcare spending. This growth is particularly notable in countries like China and India. While the Middle East and Africa, and South America show relatively smaller market sizes currently, the market penetration of advanced therapies is projected to increase in these regions as economies develop and healthcare access improves. The forecast period of 2025-2033 suggests a continuing expansion, driven by ongoing research and development into novel therapies, personalized medicine approaches, and further market penetration in under-served regions. The continued refinement of existing TKIs and exploration of new treatment strategies will undoubtedly shape the future of this vital market.
Chronic Myelogenous Leukemia (CML) Treatment Market Report: 2019-2033
This comprehensive report provides a detailed analysis of the Chronic Myelogenous Leukemia (CML) treatment market, encompassing market dynamics, growth trends, regional analysis, competitive landscape, and future outlook. The report covers the period 2019-2033, with a focus on the 2025-2033 forecast period. The study period is 2019-2024 and the base year is 2025. The parent market is the oncology therapeutics market, while the child market is specifically CML treatment. This report is invaluable for pharmaceutical companies, investors, researchers, and healthcare professionals seeking in-depth insights into this crucial therapeutic area.
Chronic Myelogenous Leukemia Treatment Industry Market Dynamics & Structure
The CML treatment market is characterized by a moderately concentrated structure with several major players holding significant market share. Technological innovation, particularly in targeted therapies, is a key driver of growth. Stringent regulatory frameworks influence market entry and product approval, while the availability of competitive substitute treatments impacts market dynamics. The end-user demographic primarily comprises adult patients diagnosed with CML, with varying disease stages influencing treatment choices. M&A activity within the industry remains significant, driving consolidation and shaping the competitive landscape.
- Market Concentration: xx% market share held by top 5 players in 2024.
- Technological Innovation: Focus on developing novel targeted therapies with improved efficacy and reduced side effects.
- Regulatory Landscape: Stringent approval processes influence market entry timelines and costs.
- Competitive Substitutes: The availability of alternative treatments impacts market share and pricing strategies.
- End-User Demographics: Predominantly adult patients, with variations in treatment based on disease stage and patient characteristics.
- M&A Activity: xx M&A deals observed between 2019 and 2024, with an estimated value of xx Million.
Chronic Myelogenous Leukemia Treatment Industry Growth Trends & Insights
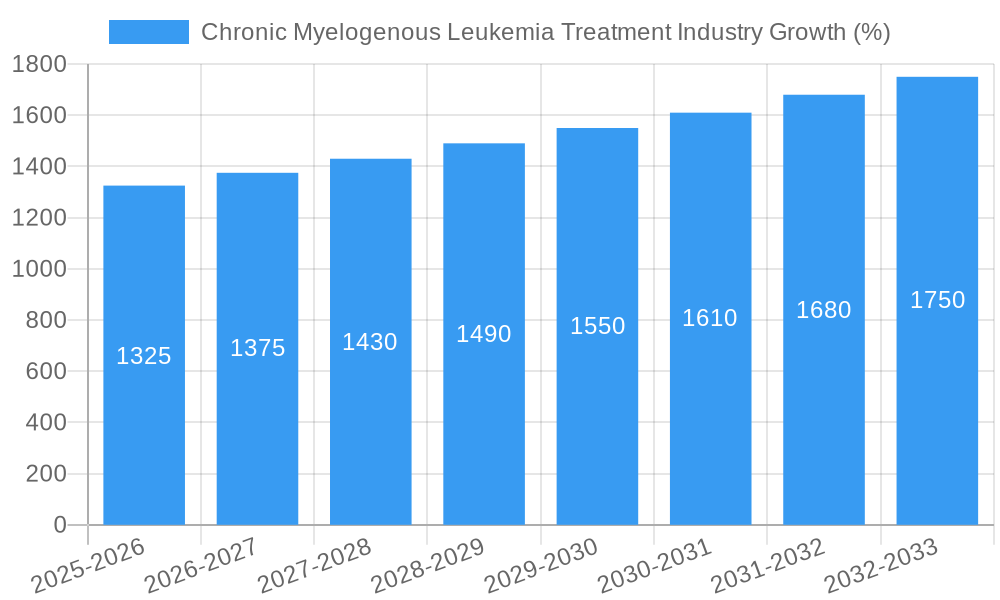
The CML treatment market exhibits robust growth, driven by increasing prevalence of the disease, advancements in targeted therapies, and improved patient outcomes. The market size is projected to reach xx Million by 2025 and xx Million by 2033, exhibiting a CAGR of xx% during the forecast period. Increased adoption of targeted therapies, particularly tyrosine kinase inhibitors (TKIs), has significantly improved treatment outcomes and patient survival rates. Technological advancements leading to the development of next-generation TKIs are further fueling market growth. Consumer behavior shifts toward personalized medicine and preference for less toxic therapies also influence market trends.
Dominant Regions, Countries, or Segments in Chronic Myelogenous Leukemia Treatment Industry
North America currently holds the largest market share in CML treatment, driven by high healthcare expenditure, advanced healthcare infrastructure, and early adoption of innovative therapies. However, Asia Pacific is projected to witness the highest growth rate due to increasing prevalence, rising healthcare awareness, and expanding access to advanced therapies. Within treatment types, targeted therapy dominates the market due to its superior efficacy and improved tolerability compared to conventional chemotherapy.
- North America: High healthcare expenditure, advanced infrastructure, early adoption of new therapies.
- Europe: Established healthcare systems, growing awareness of targeted therapies.
- Asia Pacific: High disease prevalence, growing healthcare expenditure, increasing access to advanced treatments.
- Targeted Therapy: High efficacy and improved patient outcomes compared to other treatment modalities.
- Chemotherapy: Still used in specific cases, but its market share is declining due to the availability of targeted therapies.
- Biologic Therapy: Growing segment with potential for future growth in combination therapies.
Chronic Myelogenous Leukemia Treatment Industry Product Landscape
The CML treatment market offers a range of therapies, including first-generation, second-generation, and next-generation TKIs. These products differ in their efficacy, side-effect profiles, and administration routes. Ongoing research and development efforts focus on improving treatment outcomes, reducing side effects, and extending the duration of remission. Next-generation TKIs are characterized by their higher potency and improved resistance profiles compared to earlier generations. Innovations include the development of combination therapies and personalized medicine approaches to optimize treatment strategies.
Key Drivers, Barriers & Challenges in Chronic Myelogenous Leukemia Treatment Industry
Key Drivers: Increased CML prevalence, technological advancements in targeted therapies, growing healthcare expenditure, rising awareness among patients and healthcare professionals.
Key Barriers & Challenges: High cost of treatment, development of drug resistance, side effects associated with certain therapies, limited access to advanced treatments in developing countries. The high cost of new TKIs and the potential for drug resistance limit access and pose significant challenges. Supply chain disruptions can lead to drug shortages and treatment interruptions. The regulatory hurdles for new drug approvals represent a barrier to market entry. Intense competition among established and emerging players create pricing pressure.
Emerging Opportunities in Chronic Myelogenous Leukemia Treatment Industry
Emerging opportunities lie in the development of next-generation TKIs, novel treatment strategies focusing on combination therapy, personalized medicine approaches based on genetic profiling, and improved monitoring tools to detect and manage drug resistance. Expanding access to advanced treatments in developing countries presents significant growth potential.
Growth Accelerators in the Chronic Myelogenous Leukemia Treatment Industry
Long-term growth is fueled by continuous innovation in targeted therapies, strategic collaborations between pharmaceutical companies and research institutions, and expansion of market access initiatives into underserved regions. The development of combination therapies to address drug resistance and improve treatment outcomes is a key accelerator.
Key Players Shaping the Chronic Myelogenous Leukemia Treatment Market
- Fresenius Kabi AG
- Viatris Inc (Mylan)
- Boehringer Ingelheim International GmbH
- Sanofi
- Novartis AG
- Cipla Inc (Cipla USA Inc )
- Bristol-Myers Squibb Co
- Merck & Co Inc
- F Hoffmann-La Roche Ltd
- Takeda Pharmaceutical Company Limited
- Teva Pharmaceutical Industries Ltd
- Accord Healthcare Inc
- Amneal Pharmaceuticals LLC
- Pfizer Inc
Notable Milestones in Chronic Myelogenous Leukemia Treatment Industry Sector
- July 2022: China's NMPA grants Priority Review designation to olverembatinib for CML-CP patients resistant/intolerant to first- and second-generation TKIs.
- December 2021: Ascentage Pharma launches Olverembatinib in China for chronic/accelerated phase CML.
In-Depth Chronic Myelogenous Leukemia Treatment Industry Market Outlook
The CML treatment market is poised for continued growth driven by the ongoing development of innovative therapies, increasing disease prevalence, and expansion into new markets. Strategic partnerships and collaborations will play a crucial role in accelerating the development and commercialization of next-generation treatments. The focus on personalized medicine and combination therapies will further enhance treatment outcomes and improve patient survival rates, unlocking significant market potential in the years to come.
Chronic Myelogenous Leukemia Treatment Industry Segmentation
-
1. Treatment Type
- 1.1. Targeted therapy
- 1.2. Chemotherapy
- 1.3. Biologic therapy
- 1.4. Other Treatment Types
Chronic Myelogenous Leukemia Treatment Industry Segmentation By Geography
-
1. North America
- 1.1. United States
- 1.2. Canada
- 1.3. Mexico
-
2. Europe
- 2.1. Germany
- 2.2. United Kingdom
- 2.3. France
- 2.4. Italy
- 2.5. Spain
- 2.6. Rest of Europe
-
3. Asia Pacific
- 3.1. China
- 3.2. Japan
- 3.3. India
- 3.4. Australia
- 3.5. South Korea
- 3.6. Rest of Asia Pacific
-
4. Middle East and Africa
- 4.1. GCC
- 4.2. South Africa
- 4.3. Rest of Middle East and Africa
-
5. South America
- 5.1. Brazil
- 5.2. Argentina
- 5.3. Rest of South America
Chronic Myelogenous Leukemia Treatment Industry REPORT HIGHLIGHTS
| Aspects | Details |
|---|---|
| Study Period | 2019-2033 |
| Base Year | 2024 |
| Estimated Year | 2025 |
| Forecast Period | 2025-2033 |
| Historical Period | 2019-2024 |
| Growth Rate | CAGR of 5.30% from 2019-2033 |
| Segmentation |
|
Table of Contents
- 1. Introduction
- 1.1. Research Scope
- 1.2. Market Segmentation
- 1.3. Research Methodology
- 1.4. Definitions and Assumptions
- 2. Executive Summary
- 2.1. Introduction
- 3. Market Dynamics
- 3.1. Introduction
- 3.2. Market Drivers
- 3.2.1. High Incidence and Prevalence of Chronic Myeloid Leukemia; Advancement in Drug Development; Increasing Investments in Research and Development
- 3.3. Market Restrains
- 3.3.1. Side effects Associated with Chemotherapy; Stringent Regulations on Drugs
- 3.4. Market Trends
- 3.4.1. The Chemotherapy Segment is Expected to Witness Significant Growth Over the Forecast Period
- 4. Market Factor Analysis
- 4.1. Porters Five Forces
- 4.2. Supply/Value Chain
- 4.3. PESTEL analysis
- 4.4. Market Entropy
- 4.5. Patent/Trademark Analysis
- 5. Global Chronic Myelogenous Leukemia Treatment Industry Analysis, Insights and Forecast, 2019-2031
- 5.1. Market Analysis, Insights and Forecast - by Treatment Type
- 5.1.1. Targeted therapy
- 5.1.2. Chemotherapy
- 5.1.3. Biologic therapy
- 5.1.4. Other Treatment Types
- 5.2. Market Analysis, Insights and Forecast - by Region
- 5.2.1. North America
- 5.2.2. Europe
- 5.2.3. Asia Pacific
- 5.2.4. Middle East and Africa
- 5.2.5. South America
- 5.1. Market Analysis, Insights and Forecast - by Treatment Type
- 6. North America Chronic Myelogenous Leukemia Treatment Industry Analysis, Insights and Forecast, 2019-2031
- 6.1. Market Analysis, Insights and Forecast - by Treatment Type
- 6.1.1. Targeted therapy
- 6.1.2. Chemotherapy
- 6.1.3. Biologic therapy
- 6.1.4. Other Treatment Types
- 6.1. Market Analysis, Insights and Forecast - by Treatment Type
- 7. Europe Chronic Myelogenous Leukemia Treatment Industry Analysis, Insights and Forecast, 2019-2031
- 7.1. Market Analysis, Insights and Forecast - by Treatment Type
- 7.1.1. Targeted therapy
- 7.1.2. Chemotherapy
- 7.1.3. Biologic therapy
- 7.1.4. Other Treatment Types
- 7.1. Market Analysis, Insights and Forecast - by Treatment Type
- 8. Asia Pacific Chronic Myelogenous Leukemia Treatment Industry Analysis, Insights and Forecast, 2019-2031
- 8.1. Market Analysis, Insights and Forecast - by Treatment Type
- 8.1.1. Targeted therapy
- 8.1.2. Chemotherapy
- 8.1.3. Biologic therapy
- 8.1.4. Other Treatment Types
- 8.1. Market Analysis, Insights and Forecast - by Treatment Type
- 9. Middle East and Africa Chronic Myelogenous Leukemia Treatment Industry Analysis, Insights and Forecast, 2019-2031
- 9.1. Market Analysis, Insights and Forecast - by Treatment Type
- 9.1.1. Targeted therapy
- 9.1.2. Chemotherapy
- 9.1.3. Biologic therapy
- 9.1.4. Other Treatment Types
- 9.1. Market Analysis, Insights and Forecast - by Treatment Type
- 10. South America Chronic Myelogenous Leukemia Treatment Industry Analysis, Insights and Forecast, 2019-2031
- 10.1. Market Analysis, Insights and Forecast - by Treatment Type
- 10.1.1. Targeted therapy
- 10.1.2. Chemotherapy
- 10.1.3. Biologic therapy
- 10.1.4. Other Treatment Types
- 10.1. Market Analysis, Insights and Forecast - by Treatment Type
- 11. North America Chronic Myelogenous Leukemia Treatment Industry Analysis, Insights and Forecast, 2019-2031
- 11.1. Market Analysis, Insights and Forecast - By Country/Sub-region
- 11.1.1 United States
- 11.1.2 Canada
- 11.1.3 Mexico
- 12. Europe Chronic Myelogenous Leukemia Treatment Industry Analysis, Insights and Forecast, 2019-2031
- 12.1. Market Analysis, Insights and Forecast - By Country/Sub-region
- 12.1.1 Germany
- 12.1.2 United Kingdom
- 12.1.3 France
- 12.1.4 Italy
- 12.1.5 Spain
- 12.1.6 Rest of Europe
- 13. Asia Pacific Chronic Myelogenous Leukemia Treatment Industry Analysis, Insights and Forecast, 2019-2031
- 13.1. Market Analysis, Insights and Forecast - By Country/Sub-region
- 13.1.1 China
- 13.1.2 Japan
- 13.1.3 India
- 13.1.4 Australia
- 13.1.5 South Korea
- 13.1.6 Rest of Asia Pacific
- 14. Middle East and Africa Chronic Myelogenous Leukemia Treatment Industry Analysis, Insights and Forecast, 2019-2031
- 14.1. Market Analysis, Insights and Forecast - By Country/Sub-region
- 14.1.1 GCC
- 14.1.2 South Africa
- 14.1.3 Rest of Middle East and Africa
- 15. South America Chronic Myelogenous Leukemia Treatment Industry Analysis, Insights and Forecast, 2019-2031
- 15.1. Market Analysis, Insights and Forecast - By Country/Sub-region
- 15.1.1 Brazil
- 15.1.2 Argentina
- 15.1.3 Rest of South America
- 16. Competitive Analysis
- 16.1. Global Market Share Analysis 2024
- 16.2. Company Profiles
- 16.2.1 Fresenius Kabi AG*List Not Exhaustive
- 16.2.1.1. Overview
- 16.2.1.2. Products
- 16.2.1.3. SWOT Analysis
- 16.2.1.4. Recent Developments
- 16.2.1.5. Financials (Based on Availability)
- 16.2.2 Viatris Inc (Mylan)
- 16.2.2.1. Overview
- 16.2.2.2. Products
- 16.2.2.3. SWOT Analysis
- 16.2.2.4. Recent Developments
- 16.2.2.5. Financials (Based on Availability)
- 16.2.3 Boehringer Ingelheim International GmbH
- 16.2.3.1. Overview
- 16.2.3.2. Products
- 16.2.3.3. SWOT Analysis
- 16.2.3.4. Recent Developments
- 16.2.3.5. Financials (Based on Availability)
- 16.2.4 Sanofi
- 16.2.4.1. Overview
- 16.2.4.2. Products
- 16.2.4.3. SWOT Analysis
- 16.2.4.4. Recent Developments
- 16.2.4.5. Financials (Based on Availability)
- 16.2.5 Novartis AG
- 16.2.5.1. Overview
- 16.2.5.2. Products
- 16.2.5.3. SWOT Analysis
- 16.2.5.4. Recent Developments
- 16.2.5.5. Financials (Based on Availability)
- 16.2.6 Cipla Inc (Cipla USA Inc )
- 16.2.6.1. Overview
- 16.2.6.2. Products
- 16.2.6.3. SWOT Analysis
- 16.2.6.4. Recent Developments
- 16.2.6.5. Financials (Based on Availability)
- 16.2.7 Bristol-Myers Squibb Co
- 16.2.7.1. Overview
- 16.2.7.2. Products
- 16.2.7.3. SWOT Analysis
- 16.2.7.4. Recent Developments
- 16.2.7.5. Financials (Based on Availability)
- 16.2.8 Merck & Co Inc
- 16.2.8.1. Overview
- 16.2.8.2. Products
- 16.2.8.3. SWOT Analysis
- 16.2.8.4. Recent Developments
- 16.2.8.5. Financials (Based on Availability)
- 16.2.9 F Hoffmann-La Roche Ltd
- 16.2.9.1. Overview
- 16.2.9.2. Products
- 16.2.9.3. SWOT Analysis
- 16.2.9.4. Recent Developments
- 16.2.9.5. Financials (Based on Availability)
- 16.2.10 Takeda Pharmaceutical Company Limited
- 16.2.10.1. Overview
- 16.2.10.2. Products
- 16.2.10.3. SWOT Analysis
- 16.2.10.4. Recent Developments
- 16.2.10.5. Financials (Based on Availability)
- 16.2.11 Teva Pharmaceutical Industries Ltd
- 16.2.11.1. Overview
- 16.2.11.2. Products
- 16.2.11.3. SWOT Analysis
- 16.2.11.4. Recent Developments
- 16.2.11.5. Financials (Based on Availability)
- 16.2.12 Accord Healthcare Inc
- 16.2.12.1. Overview
- 16.2.12.2. Products
- 16.2.12.3. SWOT Analysis
- 16.2.12.4. Recent Developments
- 16.2.12.5. Financials (Based on Availability)
- 16.2.13 Amneal Pharmaceuticals LLC
- 16.2.13.1. Overview
- 16.2.13.2. Products
- 16.2.13.3. SWOT Analysis
- 16.2.13.4. Recent Developments
- 16.2.13.5. Financials (Based on Availability)
- 16.2.14 Pfizer Inc
- 16.2.14.1. Overview
- 16.2.14.2. Products
- 16.2.14.3. SWOT Analysis
- 16.2.14.4. Recent Developments
- 16.2.14.5. Financials (Based on Availability)
- 16.2.1 Fresenius Kabi AG*List Not Exhaustive
List of Figures
- Figure 1: Global Chronic Myelogenous Leukemia Treatment Industry Revenue Breakdown (Million, %) by Region 2024 & 2032
- Figure 2: North America Chronic Myelogenous Leukemia Treatment Industry Revenue (Million), by Country 2024 & 2032
- Figure 3: North America Chronic Myelogenous Leukemia Treatment Industry Revenue Share (%), by Country 2024 & 2032
- Figure 4: Europe Chronic Myelogenous Leukemia Treatment Industry Revenue (Million), by Country 2024 & 2032
- Figure 5: Europe Chronic Myelogenous Leukemia Treatment Industry Revenue Share (%), by Country 2024 & 2032
- Figure 6: Asia Pacific Chronic Myelogenous Leukemia Treatment Industry Revenue (Million), by Country 2024 & 2032
- Figure 7: Asia Pacific Chronic Myelogenous Leukemia Treatment Industry Revenue Share (%), by Country 2024 & 2032
- Figure 8: Middle East and Africa Chronic Myelogenous Leukemia Treatment Industry Revenue (Million), by Country 2024 & 2032
- Figure 9: Middle East and Africa Chronic Myelogenous Leukemia Treatment Industry Revenue Share (%), by Country 2024 & 2032
- Figure 10: South America Chronic Myelogenous Leukemia Treatment Industry Revenue (Million), by Country 2024 & 2032
- Figure 11: South America Chronic Myelogenous Leukemia Treatment Industry Revenue Share (%), by Country 2024 & 2032
- Figure 12: North America Chronic Myelogenous Leukemia Treatment Industry Revenue (Million), by Treatment Type 2024 & 2032
- Figure 13: North America Chronic Myelogenous Leukemia Treatment Industry Revenue Share (%), by Treatment Type 2024 & 2032
- Figure 14: North America Chronic Myelogenous Leukemia Treatment Industry Revenue (Million), by Country 2024 & 2032
- Figure 15: North America Chronic Myelogenous Leukemia Treatment Industry Revenue Share (%), by Country 2024 & 2032
- Figure 16: Europe Chronic Myelogenous Leukemia Treatment Industry Revenue (Million), by Treatment Type 2024 & 2032
- Figure 17: Europe Chronic Myelogenous Leukemia Treatment Industry Revenue Share (%), by Treatment Type 2024 & 2032
- Figure 18: Europe Chronic Myelogenous Leukemia Treatment Industry Revenue (Million), by Country 2024 & 2032
- Figure 19: Europe Chronic Myelogenous Leukemia Treatment Industry Revenue Share (%), by Country 2024 & 2032
- Figure 20: Asia Pacific Chronic Myelogenous Leukemia Treatment Industry Revenue (Million), by Treatment Type 2024 & 2032
- Figure 21: Asia Pacific Chronic Myelogenous Leukemia Treatment Industry Revenue Share (%), by Treatment Type 2024 & 2032
- Figure 22: Asia Pacific Chronic Myelogenous Leukemia Treatment Industry Revenue (Million), by Country 2024 & 2032
- Figure 23: Asia Pacific Chronic Myelogenous Leukemia Treatment Industry Revenue Share (%), by Country 2024 & 2032
- Figure 24: Middle East and Africa Chronic Myelogenous Leukemia Treatment Industry Revenue (Million), by Treatment Type 2024 & 2032
- Figure 25: Middle East and Africa Chronic Myelogenous Leukemia Treatment Industry Revenue Share (%), by Treatment Type 2024 & 2032
- Figure 26: Middle East and Africa Chronic Myelogenous Leukemia Treatment Industry Revenue (Million), by Country 2024 & 2032
- Figure 27: Middle East and Africa Chronic Myelogenous Leukemia Treatment Industry Revenue Share (%), by Country 2024 & 2032
- Figure 28: South America Chronic Myelogenous Leukemia Treatment Industry Revenue (Million), by Treatment Type 2024 & 2032
- Figure 29: South America Chronic Myelogenous Leukemia Treatment Industry Revenue Share (%), by Treatment Type 2024 & 2032
- Figure 30: South America Chronic Myelogenous Leukemia Treatment Industry Revenue (Million), by Country 2024 & 2032
- Figure 31: South America Chronic Myelogenous Leukemia Treatment Industry Revenue Share (%), by Country 2024 & 2032
List of Tables
- Table 1: Global Chronic Myelogenous Leukemia Treatment Industry Revenue Million Forecast, by Region 2019 & 2032
- Table 2: Global Chronic Myelogenous Leukemia Treatment Industry Revenue Million Forecast, by Treatment Type 2019 & 2032
- Table 3: Global Chronic Myelogenous Leukemia Treatment Industry Revenue Million Forecast, by Region 2019 & 2032
- Table 4: Global Chronic Myelogenous Leukemia Treatment Industry Revenue Million Forecast, by Country 2019 & 2032
- Table 5: United States Chronic Myelogenous Leukemia Treatment Industry Revenue (Million) Forecast, by Application 2019 & 2032
- Table 6: Canada Chronic Myelogenous Leukemia Treatment Industry Revenue (Million) Forecast, by Application 2019 & 2032
- Table 7: Mexico Chronic Myelogenous Leukemia Treatment Industry Revenue (Million) Forecast, by Application 2019 & 2032
- Table 8: Global Chronic Myelogenous Leukemia Treatment Industry Revenue Million Forecast, by Country 2019 & 2032
- Table 9: Germany Chronic Myelogenous Leukemia Treatment Industry Revenue (Million) Forecast, by Application 2019 & 2032
- Table 10: United Kingdom Chronic Myelogenous Leukemia Treatment Industry Revenue (Million) Forecast, by Application 2019 & 2032
- Table 11: France Chronic Myelogenous Leukemia Treatment Industry Revenue (Million) Forecast, by Application 2019 & 2032
- Table 12: Italy Chronic Myelogenous Leukemia Treatment Industry Revenue (Million) Forecast, by Application 2019 & 2032
- Table 13: Spain Chronic Myelogenous Leukemia Treatment Industry Revenue (Million) Forecast, by Application 2019 & 2032
- Table 14: Rest of Europe Chronic Myelogenous Leukemia Treatment Industry Revenue (Million) Forecast, by Application 2019 & 2032
- Table 15: Global Chronic Myelogenous Leukemia Treatment Industry Revenue Million Forecast, by Country 2019 & 2032
- Table 16: China Chronic Myelogenous Leukemia Treatment Industry Revenue (Million) Forecast, by Application 2019 & 2032
- Table 17: Japan Chronic Myelogenous Leukemia Treatment Industry Revenue (Million) Forecast, by Application 2019 & 2032
- Table 18: India Chronic Myelogenous Leukemia Treatment Industry Revenue (Million) Forecast, by Application 2019 & 2032
- Table 19: Australia Chronic Myelogenous Leukemia Treatment Industry Revenue (Million) Forecast, by Application 2019 & 2032
- Table 20: South Korea Chronic Myelogenous Leukemia Treatment Industry Revenue (Million) Forecast, by Application 2019 & 2032
- Table 21: Rest of Asia Pacific Chronic Myelogenous Leukemia Treatment Industry Revenue (Million) Forecast, by Application 2019 & 2032
- Table 22: Global Chronic Myelogenous Leukemia Treatment Industry Revenue Million Forecast, by Country 2019 & 2032
- Table 23: GCC Chronic Myelogenous Leukemia Treatment Industry Revenue (Million) Forecast, by Application 2019 & 2032
- Table 24: South Africa Chronic Myelogenous Leukemia Treatment Industry Revenue (Million) Forecast, by Application 2019 & 2032
- Table 25: Rest of Middle East and Africa Chronic Myelogenous Leukemia Treatment Industry Revenue (Million) Forecast, by Application 2019 & 2032
- Table 26: Global Chronic Myelogenous Leukemia Treatment Industry Revenue Million Forecast, by Country 2019 & 2032
- Table 27: Brazil Chronic Myelogenous Leukemia Treatment Industry Revenue (Million) Forecast, by Application 2019 & 2032
- Table 28: Argentina Chronic Myelogenous Leukemia Treatment Industry Revenue (Million) Forecast, by Application 2019 & 2032
- Table 29: Rest of South America Chronic Myelogenous Leukemia Treatment Industry Revenue (Million) Forecast, by Application 2019 & 2032
- Table 30: Global Chronic Myelogenous Leukemia Treatment Industry Revenue Million Forecast, by Treatment Type 2019 & 2032
- Table 31: Global Chronic Myelogenous Leukemia Treatment Industry Revenue Million Forecast, by Country 2019 & 2032
- Table 32: United States Chronic Myelogenous Leukemia Treatment Industry Revenue (Million) Forecast, by Application 2019 & 2032
- Table 33: Canada Chronic Myelogenous Leukemia Treatment Industry Revenue (Million) Forecast, by Application 2019 & 2032
- Table 34: Mexico Chronic Myelogenous Leukemia Treatment Industry Revenue (Million) Forecast, by Application 2019 & 2032
- Table 35: Global Chronic Myelogenous Leukemia Treatment Industry Revenue Million Forecast, by Treatment Type 2019 & 2032
- Table 36: Global Chronic Myelogenous Leukemia Treatment Industry Revenue Million Forecast, by Country 2019 & 2032
- Table 37: Germany Chronic Myelogenous Leukemia Treatment Industry Revenue (Million) Forecast, by Application 2019 & 2032
- Table 38: United Kingdom Chronic Myelogenous Leukemia Treatment Industry Revenue (Million) Forecast, by Application 2019 & 2032
- Table 39: France Chronic Myelogenous Leukemia Treatment Industry Revenue (Million) Forecast, by Application 2019 & 2032
- Table 40: Italy Chronic Myelogenous Leukemia Treatment Industry Revenue (Million) Forecast, by Application 2019 & 2032
- Table 41: Spain Chronic Myelogenous Leukemia Treatment Industry Revenue (Million) Forecast, by Application 2019 & 2032
- Table 42: Rest of Europe Chronic Myelogenous Leukemia Treatment Industry Revenue (Million) Forecast, by Application 2019 & 2032
- Table 43: Global Chronic Myelogenous Leukemia Treatment Industry Revenue Million Forecast, by Treatment Type 2019 & 2032
- Table 44: Global Chronic Myelogenous Leukemia Treatment Industry Revenue Million Forecast, by Country 2019 & 2032
- Table 45: China Chronic Myelogenous Leukemia Treatment Industry Revenue (Million) Forecast, by Application 2019 & 2032
- Table 46: Japan Chronic Myelogenous Leukemia Treatment Industry Revenue (Million) Forecast, by Application 2019 & 2032
- Table 47: India Chronic Myelogenous Leukemia Treatment Industry Revenue (Million) Forecast, by Application 2019 & 2032
- Table 48: Australia Chronic Myelogenous Leukemia Treatment Industry Revenue (Million) Forecast, by Application 2019 & 2032
- Table 49: South Korea Chronic Myelogenous Leukemia Treatment Industry Revenue (Million) Forecast, by Application 2019 & 2032
- Table 50: Rest of Asia Pacific Chronic Myelogenous Leukemia Treatment Industry Revenue (Million) Forecast, by Application 2019 & 2032
- Table 51: Global Chronic Myelogenous Leukemia Treatment Industry Revenue Million Forecast, by Treatment Type 2019 & 2032
- Table 52: Global Chronic Myelogenous Leukemia Treatment Industry Revenue Million Forecast, by Country 2019 & 2032
- Table 53: GCC Chronic Myelogenous Leukemia Treatment Industry Revenue (Million) Forecast, by Application 2019 & 2032
- Table 54: South Africa Chronic Myelogenous Leukemia Treatment Industry Revenue (Million) Forecast, by Application 2019 & 2032
- Table 55: Rest of Middle East and Africa Chronic Myelogenous Leukemia Treatment Industry Revenue (Million) Forecast, by Application 2019 & 2032
- Table 56: Global Chronic Myelogenous Leukemia Treatment Industry Revenue Million Forecast, by Treatment Type 2019 & 2032
- Table 57: Global Chronic Myelogenous Leukemia Treatment Industry Revenue Million Forecast, by Country 2019 & 2032
- Table 58: Brazil Chronic Myelogenous Leukemia Treatment Industry Revenue (Million) Forecast, by Application 2019 & 2032
- Table 59: Argentina Chronic Myelogenous Leukemia Treatment Industry Revenue (Million) Forecast, by Application 2019 & 2032
- Table 60: Rest of South America Chronic Myelogenous Leukemia Treatment Industry Revenue (Million) Forecast, by Application 2019 & 2032
Frequently Asked Questions
1. What is the projected Compound Annual Growth Rate (CAGR) of the Chronic Myelogenous Leukemia Treatment Industry?
The projected CAGR is approximately 5.30%.
2. Which companies are prominent players in the Chronic Myelogenous Leukemia Treatment Industry?
Key companies in the market include Fresenius Kabi AG*List Not Exhaustive, Viatris Inc (Mylan), Boehringer Ingelheim International GmbH, Sanofi, Novartis AG, Cipla Inc (Cipla USA Inc ), Bristol-Myers Squibb Co, Merck & Co Inc, F Hoffmann-La Roche Ltd, Takeda Pharmaceutical Company Limited, Teva Pharmaceutical Industries Ltd, Accord Healthcare Inc, Amneal Pharmaceuticals LLC, Pfizer Inc.
3. What are the main segments of the Chronic Myelogenous Leukemia Treatment Industry?
The market segments include Treatment Type.
4. Can you provide details about the market size?
The market size is estimated to be USD XX Million as of 2022.
5. What are some drivers contributing to market growth?
High Incidence and Prevalence of Chronic Myeloid Leukemia; Advancement in Drug Development; Increasing Investments in Research and Development.
6. What are the notable trends driving market growth?
The Chemotherapy Segment is Expected to Witness Significant Growth Over the Forecast Period.
7. Are there any restraints impacting market growth?
Side effects Associated with Chemotherapy; Stringent Regulations on Drugs.
8. Can you provide examples of recent developments in the market?
In July 2022, the Center for Drug Evaluation (CDE) of China of the National Medical Products Administration (NMPA) accepted and granted Priority Review designation to a New Drug Application (NDA) submitted by Innovent Biologics, Inc. and Ascentage Pharma that will support the full approval of olverembatinib in patients with chronic-phase chronic myeloid leukemia (CML-CP) who are resistant and/or intolerant of first- and second-generation tyrosine kinase inhibitors (TKIs).
9. What pricing options are available for accessing the report?
Pricing options include single-user, multi-user, and enterprise licenses priced at USD 4750, USD 5250, and USD 8750 respectively.
10. Is the market size provided in terms of value or volume?
The market size is provided in terms of value, measured in Million.
11. Are there any specific market keywords associated with the report?
Yes, the market keyword associated with the report is "Chronic Myelogenous Leukemia Treatment Industry," which aids in identifying and referencing the specific market segment covered.
12. How do I determine which pricing option suits my needs best?
The pricing options vary based on user requirements and access needs. Individual users may opt for single-user licenses, while businesses requiring broader access may choose multi-user or enterprise licenses for cost-effective access to the report.
13. Are there any additional resources or data provided in the Chronic Myelogenous Leukemia Treatment Industry report?
While the report offers comprehensive insights, it's advisable to review the specific contents or supplementary materials provided to ascertain if additional resources or data are available.
14. How can I stay updated on further developments or reports in the Chronic Myelogenous Leukemia Treatment Industry?
To stay informed about further developments, trends, and reports in the Chronic Myelogenous Leukemia Treatment Industry, consider subscribing to industry newsletters, following relevant companies and organizations, or regularly checking reputable industry news sources and publications.
Methodology
Step 1 - Identification of Relevant Samples Size from Population Database


Step 2 - Approaches for Defining Global Market Size (Value, Volume* & Price*)

Note*: In applicable scenarios
Step 3 - Data Sources
Primary Research
- Web Analytics
- Survey Reports
- Research Institute
- Latest Research Reports
- Opinion Leaders
Secondary Research
- Annual Reports
- White Paper
- Latest Press Release
- Industry Association
- Paid Database
- Investor Presentations

Step 4 - Data Triangulation
Involves using different sources of information in order to increase the validity of a study
These sources are likely to be stakeholders in a program - participants, other researchers, program staff, other community members, and so on.
Then we put all data in single framework & apply various statistical tools to find out the dynamic on the market.
During the analysis stage, feedback from the stakeholder groups would be compared to determine areas of agreement as well as areas of divergence


