
Key Insights
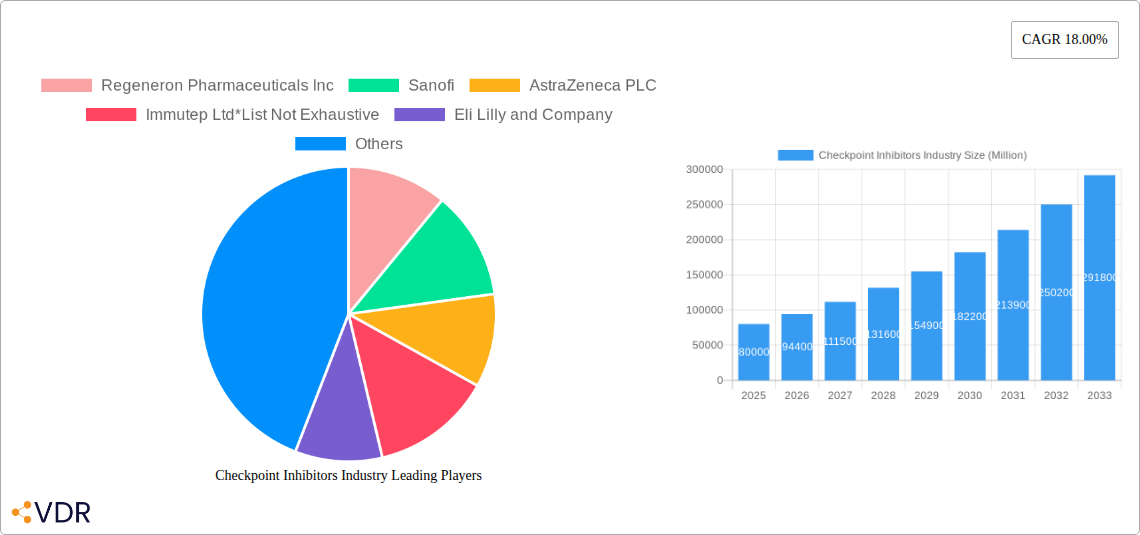
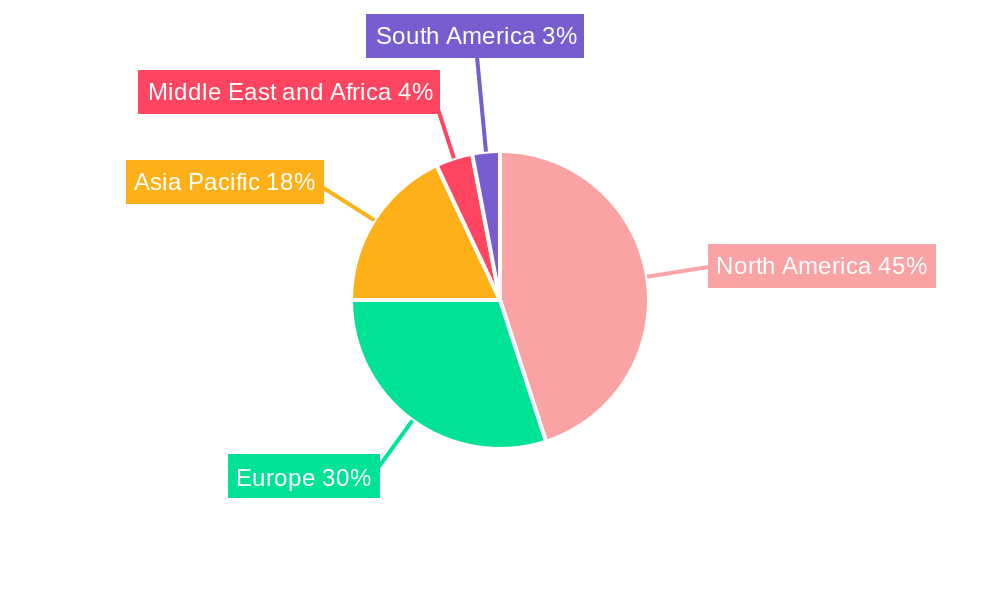
The global checkpoint inhibitors market is experiencing robust growth, driven by a rising prevalence of cancers like lung, kidney, and melanoma, coupled with increasing awareness and adoption of immunotherapy treatments. The market's Compound Annual Growth Rate (CAGR) of 18% from 2019 to 2024 suggests a significant expansion, and this trajectory is expected to continue through 2033. Key drivers include the ongoing development of novel checkpoint inhibitors targeting various cancer types, improved efficacy and safety profiles compared to traditional chemotherapy, and supportive regulatory landscapes facilitating market access. The market is segmented by inhibitor type (CTLA-4, PD-1, and others), application (Hodgkin lymphoma, kidney cancers, melanoma, non-small cell lung cancer, and others), and distribution channels (hospital, retail, and online pharmacies). North America currently dominates the market share due to high healthcare expenditure, advanced research infrastructure, and early adoption of innovative therapies. However, Asia-Pacific is anticipated to witness significant growth in the coming years, fueled by increasing cancer incidence, rising disposable incomes, and expanding healthcare infrastructure. Competition within the market is fierce, with major pharmaceutical companies like Regeneron, Sanofi, AstraZeneca, Eli Lilly, Roche, and Bristol-Myers Squibb leading the innovation and commercialization efforts.
Despite the positive outlook, certain restraints exist. High treatment costs remain a barrier to broader accessibility, particularly in developing nations. Additionally, the development of resistance to checkpoint inhibitors and potential adverse side effects necessitate ongoing research and development of more targeted and safer therapies. The market's future growth will depend on the success of ongoing clinical trials, the development of combination therapies, and strategies to address affordability and access challenges. This continued innovation, coupled with an expanding understanding of cancer immunology, positions the checkpoint inhibitors market for sustained, albeit potentially moderated, expansion in the forecast period. The increasing use of personalized medicine approaches, tailoring treatments to specific genetic profiles, is likely to further refine treatment outcomes and contribute to market growth.
Checkpoint Inhibitors Industry Market Report: 2019-2033
This comprehensive report provides a detailed analysis of the Checkpoint Inhibitors market, encompassing market dynamics, growth trends, regional dominance, product landscape, key players, and future outlook. The study period spans from 2019 to 2033, with 2025 serving as the base and estimated year. The report segments the market by inhibitor type (CTLA-4 Inhibitors, PD-1 Inhibitors, Other Types of Inhibitors), application (Hodgkin Lymphoma, Kidney Cancers, Melanoma, Non-small Cell Lung Cancer, Other Applications), and distribution channel (Hospital Pharmacies, Retail Pharmacies, Online Pharmacies). The report also includes a detailed competitive landscape of key players including Regeneron Pharmaceuticals Inc, Sanofi, AstraZeneca PLC, Immutep Ltd, Eli Lilly and Company, F Hoffmann-La Roche AG, BeiGene Ltd, Shanghai Jhunsi Biosciences Ltd, Merck & Co, Bristol-Myers Squibb Company, and GlaxoSmithKline PLC (list not exhaustive). The report’s findings provide invaluable insights for industry professionals, investors, and stakeholders seeking to understand and capitalize on opportunities within this rapidly evolving market. The total market size in 2025 is estimated at xx Million.
Checkpoint Inhibitors Industry Market Dynamics & Structure
The Checkpoint Inhibitors market is characterized by a moderately concentrated structure, with a few dominant players holding significant market share. Technological innovation, particularly in the development of novel inhibitors and combination therapies, is a key driver of market growth. Stringent regulatory frameworks influence product approvals and market access. Competitive pressures from emerging therapies and biosimilars impact the market landscape. The end-user demographics are primarily comprised of cancer patients, and M&A activity plays a crucial role in shaping market consolidation and expansion.
- Market Concentration: The top 5 players account for approximately xx% of the market share in 2025.
- Technological Innovation: Continuous R&D leads to improved efficacy, reduced side effects, and expansion into new cancer types.
- Regulatory Landscape: Stringent approval processes and post-market surveillance influence market entry and product lifecycle.
- Competitive Substitutes: Emerging immunotherapies and targeted therapies pose competition.
- End-User Demographics: The aging population and rising cancer incidence rates fuel market demand.
- M&A Activity: Consolidation through mergers and acquisitions is expected to increase in the forecast period. An estimated xx M&A deals are projected between 2025 and 2033.
Checkpoint Inhibitors Industry Growth Trends & Insights
The Checkpoint Inhibitors market has experienced significant growth over the historical period (2019-2024), driven by factors including increasing cancer prevalence, advancements in immunotherapy, and rising healthcare spending. The market is projected to witness continued expansion during the forecast period (2025-2033), with a CAGR of xx%. Adoption rates are increasing steadily across various cancer types, although variations exist based on treatment effectiveness and patient demographics. Technological disruptions, such as personalized medicine approaches and combination therapies, are reshaping the market landscape. Changes in consumer behavior, including increased awareness of immunotherapy and improved patient access, are driving market growth.

Dominant Regions, Countries, or Segments in Checkpoint Inhibitors Industry
North America currently holds the largest market share, driven by factors such as high healthcare expenditure, advanced healthcare infrastructure, and a significant number of cancer patients. However, Asia-Pacific is projected to exhibit the highest growth rate due to increasing healthcare investments, rising cancer incidence, and growing awareness of immunotherapy. Within the segments, PD-1 inhibitors dominate the market, owing to their superior efficacy and broader applicability. Non-small cell lung cancer represents a significant application segment, and hospital pharmacies constitute the leading distribution channel.
- North America: High healthcare expenditure and advanced medical infrastructure drive market dominance.
- Asia-Pacific: Rapid growth is fueled by rising cancer incidence, increasing healthcare investment, and growing awareness.
- PD-1 Inhibitors: This segment leads in terms of market share due to superior efficacy and broader application.
- Non-Small Cell Lung Cancer: This represents a key application area owing to high prevalence and responsiveness to PD-1/PD-L1 inhibitors.
- Hospital Pharmacies: This channel dominates due to its established distribution network and specialized handling capabilities.
Checkpoint Inhibitors Industry Product Landscape
The Checkpoint Inhibitors market features a diverse range of products, encompassing various inhibitor types (CTLA-4, PD-1, and others) with varying efficacy and safety profiles. Product innovation focuses on enhancing therapeutic effects, minimizing side effects, and expanding applications to a wider spectrum of cancers. Unique selling propositions involve superior efficacy, improved safety profiles, convenient administration methods, and targeted delivery mechanisms. Technological advancements, including combination therapies and personalized medicine approaches, significantly impact the market.
Key Drivers, Barriers & Challenges in Checkpoint Inhibitors Industry
Key Drivers:
- Rising cancer incidence and prevalence globally.
- Increasing healthcare expenditure and insurance coverage.
- Advancements in immunotherapy research and development.
- Growing awareness and acceptance of immunotherapy among patients and physicians.
Key Barriers & Challenges:
- High cost of treatment limiting accessibility for a significant portion of the patient population.
- Potential for severe adverse events.
- Emergence of resistance to therapy.
- Regulatory hurdles and lengthy approval processes.
Emerging Opportunities in Checkpoint Inhibitors Industry
- Expansion into new and emerging markets.
- Development of combination therapies with targeted agents.
- Personalized medicine approaches to optimize treatment selection.
- Exploration of novel inhibitor targets and mechanisms.
Growth Accelerators in the Checkpoint Inhibitors Industry Industry
Technological breakthroughs, particularly the development of next-generation inhibitors and combination regimens, are significant growth catalysts. Strategic partnerships between pharmaceutical companies and research institutions accelerate innovation. Market expansion strategies, including entry into new geographical regions and applications, further propel market growth.
Key Players Shaping the Checkpoint Inhibitors Industry Market
- Regeneron Pharmaceuticals Inc
- Sanofi
- AstraZeneca PLC
- Immutep Ltd
- Eli Lilly and Company
- F Hoffmann-La Roche AG
- BeiGene Ltd
- Shanghai Jhunsi Biosciences Ltd
- Merck & Co
- Bristol-Myers Squibb Company
- GlaxoSmithKline PLC
Notable Milestones in Checkpoint Inhibitors Industry Sector
- April 2022: Bristol Myers Squibb received European Commission approval for opdivo (nivolumab) with chemotherapy for unresectable advanced, recurrent or metastatic esophageal squamous cell carcinoma.
- March 2022: Merck announced FDA approval of KEYTRUDA (anti-PD-1 therapy) as a single agent for advanced endometrial carcinoma.
In-Depth Checkpoint Inhibitors Industry Market Outlook
The Checkpoint Inhibitors market is poised for sustained growth, driven by continuous innovation in immunotherapy, expansion into new indications, and growing global cancer burden. Strategic partnerships, personalized medicine approaches, and the development of next-generation inhibitors represent key opportunities for market players to further consolidate their position and capitalize on the significant market potential. The market is projected to reach xx Million by 2033.
Checkpoint Inhibitors Industry Segmentation
-
1. Type of Inhibitors
- 1.1. CTLA-4 Inhibitors
- 1.2. PD-1 Inhibitors
- 1.3. Other Types of Inhibitors
-
2. Application
- 2.1. Hodgkin Lymphoma
- 2.2. Kidney Cancers
- 2.3. Melanoma
- 2.4. Non-small Cell Lung Cancer
- 2.5. Other Applications
-
3. Distribution Channel
- 3.1. Hospital Pharmacies
- 3.2. Retail Pharmacies
- 3.3. Online Pharmacies
Checkpoint Inhibitors Industry Segmentation By Geography
-
1. North America
- 1.1. United states
- 1.2. Canada
- 1.3. Mexico
-
2. Europe
- 2.1. Germany
- 2.2. United Kingdom
- 2.3. France
- 2.4. Italy
- 2.5. Spain
- 2.6. Rest of Europe
-
3. Asia Pacific
- 3.1. China
- 3.2. Japan
- 3.3. India
- 3.4. Australia
- 3.5. South Korea
- 3.6. Rest of Asia Pacific
-
4. Middle East and Africa
- 4.1. GCC
- 4.2. South Africa
- 4.3. Rest of Middle East and Africa
-
5. South America
- 5.1. Brazil
- 5.2. Argentina
- 5.3. Rest of South America
Checkpoint Inhibitors Industry REPORT HIGHLIGHTS
| Aspects | Details |
|---|---|
| Study Period | 2019-2033 |
| Base Year | 2024 |
| Estimated Year | 2025 |
| Forecast Period | 2025-2033 |
| Historical Period | 2019-2024 |
| Growth Rate | CAGR of 18.00% from 2019-2033 |
| Segmentation |
|
Table of Contents
- 1. Introduction
- 1.1. Research Scope
- 1.2. Market Segmentation
- 1.3. Research Methodology
- 1.4. Definitions and Assumptions
- 2. Executive Summary
- 2.1. Introduction
- 3. Market Dynamics
- 3.1. Introduction
- 3.2. Market Drivers
- 3.2.1. Rising Investments in R&D and Clinical Trials by the Biopharmaceutical Industry to Develop these Products; Increased Product Approvals by Regulatory Authorities and Special Designations for New Drug Molecules
- 3.3. Market Restrains
- 3.3.1. Higher Risk of Complications Associated with the Expensive Oncology Treatment
- 3.4. Market Trends
- 3.4.1. The PD-1 Inhibitors Segment is Expected to Hold the Largest Market Share in the Immune Checkpoint Inhibitors Market
- 4. Market Factor Analysis
- 4.1. Porters Five Forces
- 4.2. Supply/Value Chain
- 4.3. PESTEL analysis
- 4.4. Market Entropy
- 4.5. Patent/Trademark Analysis
- 5. Global Checkpoint Inhibitors Industry Analysis, Insights and Forecast, 2019-2031
- 5.1. Market Analysis, Insights and Forecast - by Type of Inhibitors
- 5.1.1. CTLA-4 Inhibitors
- 5.1.2. PD-1 Inhibitors
- 5.1.3. Other Types of Inhibitors
- 5.2. Market Analysis, Insights and Forecast - by Application
- 5.2.1. Hodgkin Lymphoma
- 5.2.2. Kidney Cancers
- 5.2.3. Melanoma
- 5.2.4. Non-small Cell Lung Cancer
- 5.2.5. Other Applications
- 5.3. Market Analysis, Insights and Forecast - by Distribution Channel
- 5.3.1. Hospital Pharmacies
- 5.3.2. Retail Pharmacies
- 5.3.3. Online Pharmacies
- 5.4. Market Analysis, Insights and Forecast - by Region
- 5.4.1. North America
- 5.4.2. Europe
- 5.4.3. Asia Pacific
- 5.4.4. Middle East and Africa
- 5.4.5. South America
- 5.1. Market Analysis, Insights and Forecast - by Type of Inhibitors
- 6. North America Checkpoint Inhibitors Industry Analysis, Insights and Forecast, 2019-2031
- 6.1. Market Analysis, Insights and Forecast - by Type of Inhibitors
- 6.1.1. CTLA-4 Inhibitors
- 6.1.2. PD-1 Inhibitors
- 6.1.3. Other Types of Inhibitors
- 6.2. Market Analysis, Insights and Forecast - by Application
- 6.2.1. Hodgkin Lymphoma
- 6.2.2. Kidney Cancers
- 6.2.3. Melanoma
- 6.2.4. Non-small Cell Lung Cancer
- 6.2.5. Other Applications
- 6.3. Market Analysis, Insights and Forecast - by Distribution Channel
- 6.3.1. Hospital Pharmacies
- 6.3.2. Retail Pharmacies
- 6.3.3. Online Pharmacies
- 6.1. Market Analysis, Insights and Forecast - by Type of Inhibitors
- 7. Europe Checkpoint Inhibitors Industry Analysis, Insights and Forecast, 2019-2031
- 7.1. Market Analysis, Insights and Forecast - by Type of Inhibitors
- 7.1.1. CTLA-4 Inhibitors
- 7.1.2. PD-1 Inhibitors
- 7.1.3. Other Types of Inhibitors
- 7.2. Market Analysis, Insights and Forecast - by Application
- 7.2.1. Hodgkin Lymphoma
- 7.2.2. Kidney Cancers
- 7.2.3. Melanoma
- 7.2.4. Non-small Cell Lung Cancer
- 7.2.5. Other Applications
- 7.3. Market Analysis, Insights and Forecast - by Distribution Channel
- 7.3.1. Hospital Pharmacies
- 7.3.2. Retail Pharmacies
- 7.3.3. Online Pharmacies
- 7.1. Market Analysis, Insights and Forecast - by Type of Inhibitors
- 8. Asia Pacific Checkpoint Inhibitors Industry Analysis, Insights and Forecast, 2019-2031
- 8.1. Market Analysis, Insights and Forecast - by Type of Inhibitors
- 8.1.1. CTLA-4 Inhibitors
- 8.1.2. PD-1 Inhibitors
- 8.1.3. Other Types of Inhibitors
- 8.2. Market Analysis, Insights and Forecast - by Application
- 8.2.1. Hodgkin Lymphoma
- 8.2.2. Kidney Cancers
- 8.2.3. Melanoma
- 8.2.4. Non-small Cell Lung Cancer
- 8.2.5. Other Applications
- 8.3. Market Analysis, Insights and Forecast - by Distribution Channel
- 8.3.1. Hospital Pharmacies
- 8.3.2. Retail Pharmacies
- 8.3.3. Online Pharmacies
- 8.1. Market Analysis, Insights and Forecast - by Type of Inhibitors
- 9. Middle East and Africa Checkpoint Inhibitors Industry Analysis, Insights and Forecast, 2019-2031
- 9.1. Market Analysis, Insights and Forecast - by Type of Inhibitors
- 9.1.1. CTLA-4 Inhibitors
- 9.1.2. PD-1 Inhibitors
- 9.1.3. Other Types of Inhibitors
- 9.2. Market Analysis, Insights and Forecast - by Application
- 9.2.1. Hodgkin Lymphoma
- 9.2.2. Kidney Cancers
- 9.2.3. Melanoma
- 9.2.4. Non-small Cell Lung Cancer
- 9.2.5. Other Applications
- 9.3. Market Analysis, Insights and Forecast - by Distribution Channel
- 9.3.1. Hospital Pharmacies
- 9.3.2. Retail Pharmacies
- 9.3.3. Online Pharmacies
- 9.1. Market Analysis, Insights and Forecast - by Type of Inhibitors
- 10. South America Checkpoint Inhibitors Industry Analysis, Insights and Forecast, 2019-2031
- 10.1. Market Analysis, Insights and Forecast - by Type of Inhibitors
- 10.1.1. CTLA-4 Inhibitors
- 10.1.2. PD-1 Inhibitors
- 10.1.3. Other Types of Inhibitors
- 10.2. Market Analysis, Insights and Forecast - by Application
- 10.2.1. Hodgkin Lymphoma
- 10.2.2. Kidney Cancers
- 10.2.3. Melanoma
- 10.2.4. Non-small Cell Lung Cancer
- 10.2.5. Other Applications
- 10.3. Market Analysis, Insights and Forecast - by Distribution Channel
- 10.3.1. Hospital Pharmacies
- 10.3.2. Retail Pharmacies
- 10.3.3. Online Pharmacies
- 10.1. Market Analysis, Insights and Forecast - by Type of Inhibitors
- 11. North America Checkpoint Inhibitors Industry Analysis, Insights and Forecast, 2019-2031
- 11.1. Market Analysis, Insights and Forecast - By Country/Sub-region
- 11.1.1 United states
- 11.1.2 Canada
- 11.1.3 Mexico
- 12. Europe Checkpoint Inhibitors Industry Analysis, Insights and Forecast, 2019-2031
- 12.1. Market Analysis, Insights and Forecast - By Country/Sub-region
- 12.1.1 Germany
- 12.1.2 United Kingdom
- 12.1.3 France
- 12.1.4 Italy
- 12.1.5 Spain
- 12.1.6 Rest of Europe
- 13. Asia Pacific Checkpoint Inhibitors Industry Analysis, Insights and Forecast, 2019-2031
- 13.1. Market Analysis, Insights and Forecast - By Country/Sub-region
- 13.1.1 China
- 13.1.2 Japan
- 13.1.3 India
- 13.1.4 Australia
- 13.1.5 South Korea
- 13.1.6 Rest of Asia Pacific
- 14. Middle East and Africa Checkpoint Inhibitors Industry Analysis, Insights and Forecast, 2019-2031
- 14.1. Market Analysis, Insights and Forecast - By Country/Sub-region
- 14.1.1 GCC
- 14.1.2 South Africa
- 14.1.3 Rest of Middle East and Africa
- 15. South America Checkpoint Inhibitors Industry Analysis, Insights and Forecast, 2019-2031
- 15.1. Market Analysis, Insights and Forecast - By Country/Sub-region
- 15.1.1 Brazil
- 15.1.2 Argentina
- 15.1.3 Rest of South America
- 16. Competitive Analysis
- 16.1. Global Market Share Analysis 2024
- 16.2. Company Profiles
- 16.2.1 Regeneron Pharmaceuticals Inc
- 16.2.1.1. Overview
- 16.2.1.2. Products
- 16.2.1.3. SWOT Analysis
- 16.2.1.4. Recent Developments
- 16.2.1.5. Financials (Based on Availability)
- 16.2.2 Sanofi
- 16.2.2.1. Overview
- 16.2.2.2. Products
- 16.2.2.3. SWOT Analysis
- 16.2.2.4. Recent Developments
- 16.2.2.5. Financials (Based on Availability)
- 16.2.3 AstraZeneca PLC
- 16.2.3.1. Overview
- 16.2.3.2. Products
- 16.2.3.3. SWOT Analysis
- 16.2.3.4. Recent Developments
- 16.2.3.5. Financials (Based on Availability)
- 16.2.4 Immutep Ltd*List Not Exhaustive
- 16.2.4.1. Overview
- 16.2.4.2. Products
- 16.2.4.3. SWOT Analysis
- 16.2.4.4. Recent Developments
- 16.2.4.5. Financials (Based on Availability)
- 16.2.5 Eli Lilly and Company
- 16.2.5.1. Overview
- 16.2.5.2. Products
- 16.2.5.3. SWOT Analysis
- 16.2.5.4. Recent Developments
- 16.2.5.5. Financials (Based on Availability)
- 16.2.6 F Hoffmann-La Roche AG
- 16.2.6.1. Overview
- 16.2.6.2. Products
- 16.2.6.3. SWOT Analysis
- 16.2.6.4. Recent Developments
- 16.2.6.5. Financials (Based on Availability)
- 16.2.7 BeiGene Ltd
- 16.2.7.1. Overview
- 16.2.7.2. Products
- 16.2.7.3. SWOT Analysis
- 16.2.7.4. Recent Developments
- 16.2.7.5. Financials (Based on Availability)
- 16.2.8 Shanghai Jhunsi Biosciences Ltd
- 16.2.8.1. Overview
- 16.2.8.2. Products
- 16.2.8.3. SWOT Analysis
- 16.2.8.4. Recent Developments
- 16.2.8.5. Financials (Based on Availability)
- 16.2.9 Merck & Co
- 16.2.9.1. Overview
- 16.2.9.2. Products
- 16.2.9.3. SWOT Analysis
- 16.2.9.4. Recent Developments
- 16.2.9.5. Financials (Based on Availability)
- 16.2.10 Bristol-Myers Squibb Company
- 16.2.10.1. Overview
- 16.2.10.2. Products
- 16.2.10.3. SWOT Analysis
- 16.2.10.4. Recent Developments
- 16.2.10.5. Financials (Based on Availability)
- 16.2.11 GlaxoSmithKline PLC
- 16.2.11.1. Overview
- 16.2.11.2. Products
- 16.2.11.3. SWOT Analysis
- 16.2.11.4. Recent Developments
- 16.2.11.5. Financials (Based on Availability)
- 16.2.1 Regeneron Pharmaceuticals Inc
List of Figures
- Figure 1: Global Checkpoint Inhibitors Industry Revenue Breakdown (Million, %) by Region 2024 & 2032
- Figure 2: North America Checkpoint Inhibitors Industry Revenue (Million), by Country 2024 & 2032
- Figure 3: North America Checkpoint Inhibitors Industry Revenue Share (%), by Country 2024 & 2032
- Figure 4: Europe Checkpoint Inhibitors Industry Revenue (Million), by Country 2024 & 2032
- Figure 5: Europe Checkpoint Inhibitors Industry Revenue Share (%), by Country 2024 & 2032
- Figure 6: Asia Pacific Checkpoint Inhibitors Industry Revenue (Million), by Country 2024 & 2032
- Figure 7: Asia Pacific Checkpoint Inhibitors Industry Revenue Share (%), by Country 2024 & 2032
- Figure 8: Middle East and Africa Checkpoint Inhibitors Industry Revenue (Million), by Country 2024 & 2032
- Figure 9: Middle East and Africa Checkpoint Inhibitors Industry Revenue Share (%), by Country 2024 & 2032
- Figure 10: South America Checkpoint Inhibitors Industry Revenue (Million), by Country 2024 & 2032
- Figure 11: South America Checkpoint Inhibitors Industry Revenue Share (%), by Country 2024 & 2032
- Figure 12: North America Checkpoint Inhibitors Industry Revenue (Million), by Type of Inhibitors 2024 & 2032
- Figure 13: North America Checkpoint Inhibitors Industry Revenue Share (%), by Type of Inhibitors 2024 & 2032
- Figure 14: North America Checkpoint Inhibitors Industry Revenue (Million), by Application 2024 & 2032
- Figure 15: North America Checkpoint Inhibitors Industry Revenue Share (%), by Application 2024 & 2032
- Figure 16: North America Checkpoint Inhibitors Industry Revenue (Million), by Distribution Channel 2024 & 2032
- Figure 17: North America Checkpoint Inhibitors Industry Revenue Share (%), by Distribution Channel 2024 & 2032
- Figure 18: North America Checkpoint Inhibitors Industry Revenue (Million), by Country 2024 & 2032
- Figure 19: North America Checkpoint Inhibitors Industry Revenue Share (%), by Country 2024 & 2032
- Figure 20: Europe Checkpoint Inhibitors Industry Revenue (Million), by Type of Inhibitors 2024 & 2032
- Figure 21: Europe Checkpoint Inhibitors Industry Revenue Share (%), by Type of Inhibitors 2024 & 2032
- Figure 22: Europe Checkpoint Inhibitors Industry Revenue (Million), by Application 2024 & 2032
- Figure 23: Europe Checkpoint Inhibitors Industry Revenue Share (%), by Application 2024 & 2032
- Figure 24: Europe Checkpoint Inhibitors Industry Revenue (Million), by Distribution Channel 2024 & 2032
- Figure 25: Europe Checkpoint Inhibitors Industry Revenue Share (%), by Distribution Channel 2024 & 2032
- Figure 26: Europe Checkpoint Inhibitors Industry Revenue (Million), by Country 2024 & 2032
- Figure 27: Europe Checkpoint Inhibitors Industry Revenue Share (%), by Country 2024 & 2032
- Figure 28: Asia Pacific Checkpoint Inhibitors Industry Revenue (Million), by Type of Inhibitors 2024 & 2032
- Figure 29: Asia Pacific Checkpoint Inhibitors Industry Revenue Share (%), by Type of Inhibitors 2024 & 2032
- Figure 30: Asia Pacific Checkpoint Inhibitors Industry Revenue (Million), by Application 2024 & 2032
- Figure 31: Asia Pacific Checkpoint Inhibitors Industry Revenue Share (%), by Application 2024 & 2032
- Figure 32: Asia Pacific Checkpoint Inhibitors Industry Revenue (Million), by Distribution Channel 2024 & 2032
- Figure 33: Asia Pacific Checkpoint Inhibitors Industry Revenue Share (%), by Distribution Channel 2024 & 2032
- Figure 34: Asia Pacific Checkpoint Inhibitors Industry Revenue (Million), by Country 2024 & 2032
- Figure 35: Asia Pacific Checkpoint Inhibitors Industry Revenue Share (%), by Country 2024 & 2032
- Figure 36: Middle East and Africa Checkpoint Inhibitors Industry Revenue (Million), by Type of Inhibitors 2024 & 2032
- Figure 37: Middle East and Africa Checkpoint Inhibitors Industry Revenue Share (%), by Type of Inhibitors 2024 & 2032
- Figure 38: Middle East and Africa Checkpoint Inhibitors Industry Revenue (Million), by Application 2024 & 2032
- Figure 39: Middle East and Africa Checkpoint Inhibitors Industry Revenue Share (%), by Application 2024 & 2032
- Figure 40: Middle East and Africa Checkpoint Inhibitors Industry Revenue (Million), by Distribution Channel 2024 & 2032
- Figure 41: Middle East and Africa Checkpoint Inhibitors Industry Revenue Share (%), by Distribution Channel 2024 & 2032
- Figure 42: Middle East and Africa Checkpoint Inhibitors Industry Revenue (Million), by Country 2024 & 2032
- Figure 43: Middle East and Africa Checkpoint Inhibitors Industry Revenue Share (%), by Country 2024 & 2032
- Figure 44: South America Checkpoint Inhibitors Industry Revenue (Million), by Type of Inhibitors 2024 & 2032
- Figure 45: South America Checkpoint Inhibitors Industry Revenue Share (%), by Type of Inhibitors 2024 & 2032
- Figure 46: South America Checkpoint Inhibitors Industry Revenue (Million), by Application 2024 & 2032
- Figure 47: South America Checkpoint Inhibitors Industry Revenue Share (%), by Application 2024 & 2032
- Figure 48: South America Checkpoint Inhibitors Industry Revenue (Million), by Distribution Channel 2024 & 2032
- Figure 49: South America Checkpoint Inhibitors Industry Revenue Share (%), by Distribution Channel 2024 & 2032
- Figure 50: South America Checkpoint Inhibitors Industry Revenue (Million), by Country 2024 & 2032
- Figure 51: South America Checkpoint Inhibitors Industry Revenue Share (%), by Country 2024 & 2032
List of Tables
- Table 1: Global Checkpoint Inhibitors Industry Revenue Million Forecast, by Region 2019 & 2032
- Table 2: Global Checkpoint Inhibitors Industry Revenue Million Forecast, by Type of Inhibitors 2019 & 2032
- Table 3: Global Checkpoint Inhibitors Industry Revenue Million Forecast, by Application 2019 & 2032
- Table 4: Global Checkpoint Inhibitors Industry Revenue Million Forecast, by Distribution Channel 2019 & 2032
- Table 5: Global Checkpoint Inhibitors Industry Revenue Million Forecast, by Region 2019 & 2032
- Table 6: Global Checkpoint Inhibitors Industry Revenue Million Forecast, by Country 2019 & 2032
- Table 7: United states Checkpoint Inhibitors Industry Revenue (Million) Forecast, by Application 2019 & 2032
- Table 8: Canada Checkpoint Inhibitors Industry Revenue (Million) Forecast, by Application 2019 & 2032
- Table 9: Mexico Checkpoint Inhibitors Industry Revenue (Million) Forecast, by Application 2019 & 2032
- Table 10: Global Checkpoint Inhibitors Industry Revenue Million Forecast, by Country 2019 & 2032
- Table 11: Germany Checkpoint Inhibitors Industry Revenue (Million) Forecast, by Application 2019 & 2032
- Table 12: United Kingdom Checkpoint Inhibitors Industry Revenue (Million) Forecast, by Application 2019 & 2032
- Table 13: France Checkpoint Inhibitors Industry Revenue (Million) Forecast, by Application 2019 & 2032
- Table 14: Italy Checkpoint Inhibitors Industry Revenue (Million) Forecast, by Application 2019 & 2032
- Table 15: Spain Checkpoint Inhibitors Industry Revenue (Million) Forecast, by Application 2019 & 2032
- Table 16: Rest of Europe Checkpoint Inhibitors Industry Revenue (Million) Forecast, by Application 2019 & 2032
- Table 17: Global Checkpoint Inhibitors Industry Revenue Million Forecast, by Country 2019 & 2032
- Table 18: China Checkpoint Inhibitors Industry Revenue (Million) Forecast, by Application 2019 & 2032
- Table 19: Japan Checkpoint Inhibitors Industry Revenue (Million) Forecast, by Application 2019 & 2032
- Table 20: India Checkpoint Inhibitors Industry Revenue (Million) Forecast, by Application 2019 & 2032
- Table 21: Australia Checkpoint Inhibitors Industry Revenue (Million) Forecast, by Application 2019 & 2032
- Table 22: South Korea Checkpoint Inhibitors Industry Revenue (Million) Forecast, by Application 2019 & 2032
- Table 23: Rest of Asia Pacific Checkpoint Inhibitors Industry Revenue (Million) Forecast, by Application 2019 & 2032
- Table 24: Global Checkpoint Inhibitors Industry Revenue Million Forecast, by Country 2019 & 2032
- Table 25: GCC Checkpoint Inhibitors Industry Revenue (Million) Forecast, by Application 2019 & 2032
- Table 26: South Africa Checkpoint Inhibitors Industry Revenue (Million) Forecast, by Application 2019 & 2032
- Table 27: Rest of Middle East and Africa Checkpoint Inhibitors Industry Revenue (Million) Forecast, by Application 2019 & 2032
- Table 28: Global Checkpoint Inhibitors Industry Revenue Million Forecast, by Country 2019 & 2032
- Table 29: Brazil Checkpoint Inhibitors Industry Revenue (Million) Forecast, by Application 2019 & 2032
- Table 30: Argentina Checkpoint Inhibitors Industry Revenue (Million) Forecast, by Application 2019 & 2032
- Table 31: Rest of South America Checkpoint Inhibitors Industry Revenue (Million) Forecast, by Application 2019 & 2032
- Table 32: Global Checkpoint Inhibitors Industry Revenue Million Forecast, by Type of Inhibitors 2019 & 2032
- Table 33: Global Checkpoint Inhibitors Industry Revenue Million Forecast, by Application 2019 & 2032
- Table 34: Global Checkpoint Inhibitors Industry Revenue Million Forecast, by Distribution Channel 2019 & 2032
- Table 35: Global Checkpoint Inhibitors Industry Revenue Million Forecast, by Country 2019 & 2032
- Table 36: United states Checkpoint Inhibitors Industry Revenue (Million) Forecast, by Application 2019 & 2032
- Table 37: Canada Checkpoint Inhibitors Industry Revenue (Million) Forecast, by Application 2019 & 2032
- Table 38: Mexico Checkpoint Inhibitors Industry Revenue (Million) Forecast, by Application 2019 & 2032
- Table 39: Global Checkpoint Inhibitors Industry Revenue Million Forecast, by Type of Inhibitors 2019 & 2032
- Table 40: Global Checkpoint Inhibitors Industry Revenue Million Forecast, by Application 2019 & 2032
- Table 41: Global Checkpoint Inhibitors Industry Revenue Million Forecast, by Distribution Channel 2019 & 2032
- Table 42: Global Checkpoint Inhibitors Industry Revenue Million Forecast, by Country 2019 & 2032
- Table 43: Germany Checkpoint Inhibitors Industry Revenue (Million) Forecast, by Application 2019 & 2032
- Table 44: United Kingdom Checkpoint Inhibitors Industry Revenue (Million) Forecast, by Application 2019 & 2032
- Table 45: France Checkpoint Inhibitors Industry Revenue (Million) Forecast, by Application 2019 & 2032
- Table 46: Italy Checkpoint Inhibitors Industry Revenue (Million) Forecast, by Application 2019 & 2032
- Table 47: Spain Checkpoint Inhibitors Industry Revenue (Million) Forecast, by Application 2019 & 2032
- Table 48: Rest of Europe Checkpoint Inhibitors Industry Revenue (Million) Forecast, by Application 2019 & 2032
- Table 49: Global Checkpoint Inhibitors Industry Revenue Million Forecast, by Type of Inhibitors 2019 & 2032
- Table 50: Global Checkpoint Inhibitors Industry Revenue Million Forecast, by Application 2019 & 2032
- Table 51: Global Checkpoint Inhibitors Industry Revenue Million Forecast, by Distribution Channel 2019 & 2032
- Table 52: Global Checkpoint Inhibitors Industry Revenue Million Forecast, by Country 2019 & 2032
- Table 53: China Checkpoint Inhibitors Industry Revenue (Million) Forecast, by Application 2019 & 2032
- Table 54: Japan Checkpoint Inhibitors Industry Revenue (Million) Forecast, by Application 2019 & 2032
- Table 55: India Checkpoint Inhibitors Industry Revenue (Million) Forecast, by Application 2019 & 2032
- Table 56: Australia Checkpoint Inhibitors Industry Revenue (Million) Forecast, by Application 2019 & 2032
- Table 57: South Korea Checkpoint Inhibitors Industry Revenue (Million) Forecast, by Application 2019 & 2032
- Table 58: Rest of Asia Pacific Checkpoint Inhibitors Industry Revenue (Million) Forecast, by Application 2019 & 2032
- Table 59: Global Checkpoint Inhibitors Industry Revenue Million Forecast, by Type of Inhibitors 2019 & 2032
- Table 60: Global Checkpoint Inhibitors Industry Revenue Million Forecast, by Application 2019 & 2032
- Table 61: Global Checkpoint Inhibitors Industry Revenue Million Forecast, by Distribution Channel 2019 & 2032
- Table 62: Global Checkpoint Inhibitors Industry Revenue Million Forecast, by Country 2019 & 2032
- Table 63: GCC Checkpoint Inhibitors Industry Revenue (Million) Forecast, by Application 2019 & 2032
- Table 64: South Africa Checkpoint Inhibitors Industry Revenue (Million) Forecast, by Application 2019 & 2032
- Table 65: Rest of Middle East and Africa Checkpoint Inhibitors Industry Revenue (Million) Forecast, by Application 2019 & 2032
- Table 66: Global Checkpoint Inhibitors Industry Revenue Million Forecast, by Type of Inhibitors 2019 & 2032
- Table 67: Global Checkpoint Inhibitors Industry Revenue Million Forecast, by Application 2019 & 2032
- Table 68: Global Checkpoint Inhibitors Industry Revenue Million Forecast, by Distribution Channel 2019 & 2032
- Table 69: Global Checkpoint Inhibitors Industry Revenue Million Forecast, by Country 2019 & 2032
- Table 70: Brazil Checkpoint Inhibitors Industry Revenue (Million) Forecast, by Application 2019 & 2032
- Table 71: Argentina Checkpoint Inhibitors Industry Revenue (Million) Forecast, by Application 2019 & 2032
- Table 72: Rest of South America Checkpoint Inhibitors Industry Revenue (Million) Forecast, by Application 2019 & 2032
Frequently Asked Questions
1. What is the projected Compound Annual Growth Rate (CAGR) of the Checkpoint Inhibitors Industry?
The projected CAGR is approximately 18.00%.
2. Which companies are prominent players in the Checkpoint Inhibitors Industry?
Key companies in the market include Regeneron Pharmaceuticals Inc, Sanofi, AstraZeneca PLC, Immutep Ltd*List Not Exhaustive, Eli Lilly and Company, F Hoffmann-La Roche AG, BeiGene Ltd, Shanghai Jhunsi Biosciences Ltd, Merck & Co, Bristol-Myers Squibb Company, GlaxoSmithKline PLC.
3. What are the main segments of the Checkpoint Inhibitors Industry?
The market segments include Type of Inhibitors, Application, Distribution Channel.
4. Can you provide details about the market size?
The market size is estimated to be USD XX Million as of 2022.
5. What are some drivers contributing to market growth?
Rising Investments in R&D and Clinical Trials by the Biopharmaceutical Industry to Develop these Products; Increased Product Approvals by Regulatory Authorities and Special Designations for New Drug Molecules.
6. What are the notable trends driving market growth?
The PD-1 Inhibitors Segment is Expected to Hold the Largest Market Share in the Immune Checkpoint Inhibitors Market.
7. Are there any restraints impacting market growth?
Higher Risk of Complications Associated with the Expensive Oncology Treatment.
8. Can you provide examples of recent developments in the market?
April 2022: Bristol Myers Squibb received the European Commission approval for opdivo (nivolumab) with chemotherapy as first-line treatment for patients with unresectable advanced, recurrent or metastatic esophageal squamous cell carcinoma with tumor cell PD-L1 expression of 1%.
9. What pricing options are available for accessing the report?
Pricing options include single-user, multi-user, and enterprise licenses priced at USD 4750, USD 5250, and USD 8750 respectively.
10. Is the market size provided in terms of value or volume?
The market size is provided in terms of value, measured in Million.
11. Are there any specific market keywords associated with the report?
Yes, the market keyword associated with the report is "Checkpoint Inhibitors Industry," which aids in identifying and referencing the specific market segment covered.
12. How do I determine which pricing option suits my needs best?
The pricing options vary based on user requirements and access needs. Individual users may opt for single-user licenses, while businesses requiring broader access may choose multi-user or enterprise licenses for cost-effective access to the report.
13. Are there any additional resources or data provided in the Checkpoint Inhibitors Industry report?
While the report offers comprehensive insights, it's advisable to review the specific contents or supplementary materials provided to ascertain if additional resources or data are available.
14. How can I stay updated on further developments or reports in the Checkpoint Inhibitors Industry?
To stay informed about further developments, trends, and reports in the Checkpoint Inhibitors Industry, consider subscribing to industry newsletters, following relevant companies and organizations, or regularly checking reputable industry news sources and publications.
Methodology
Step 1 - Identification of Relevant Samples Size from Population Database


Step 2 - Approaches for Defining Global Market Size (Value, Volume* & Price*)

Note*: In applicable scenarios
Step 3 - Data Sources
Primary Research
- Web Analytics
- Survey Reports
- Research Institute
- Latest Research Reports
- Opinion Leaders
Secondary Research
- Annual Reports
- White Paper
- Latest Press Release
- Industry Association
- Paid Database
- Investor Presentations

Step 4 - Data Triangulation
Involves using different sources of information in order to increase the validity of a study
These sources are likely to be stakeholders in a program - participants, other researchers, program staff, other community members, and so on.
Then we put all data in single framework & apply various statistical tools to find out the dynamic on the market.
During the analysis stage, feedback from the stakeholder groups would be compared to determine areas of agreement as well as areas of divergence


