Drivers of Change in Cereal Bars Market in South America Market 2025-2033

Cereal Bars Market in South America by Production Analysis, by Consumption Analysis, by Import Market Analysis (Value & Volume), by Export Market Analysis (Value & Volume), by Price Trend Analysis, by North America (United States, Canada, Mexico), by South America (Brazil, Argentina, Rest of South America), by Europe (United Kingdom, Germany, France, Italy, Spain, Russia, Benelux, Nordics, Rest of Europe), by Middle East & Africa (Turkey, Israel, GCC, North Africa, South Africa, Rest of Middle East & Africa), by Asia Pacific (China, India, Japan, South Korea, ASEAN, Oceania, Rest of Asia Pacific) Forecast 2025-2033

Jun 27 2025
Base Year: 2024

210 Pages
Main Logo

Drivers of Change in Cereal Bars Market in South America Market 2025-2033


Home
Industries
Food & Beverage
sponsor image
sponsor image
sponsor image
sponsor image

Tailored for you

  • In-depth Analysis Tailored to Specified Regions or Segments
  • Company Profiles Customized to User Preferences
  • Comprehensive Insights Focused on Specific Segments or Regions
  • Customized Evaluation of Competitive Landscape to Meet Your Needs
  • Tailored Customization to Address Other Specific Requirements
Ask for customization


Key Insights

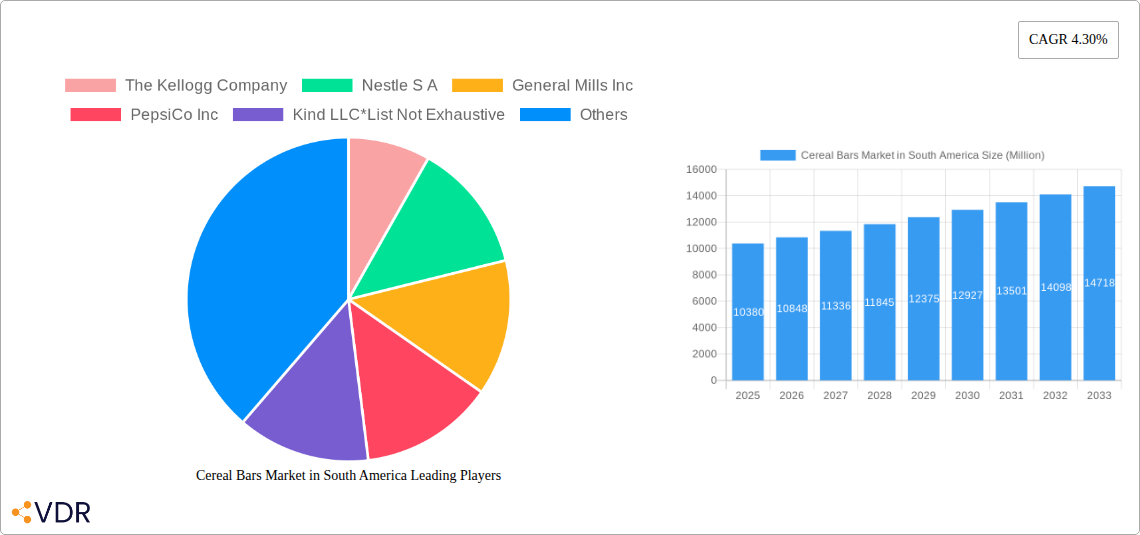
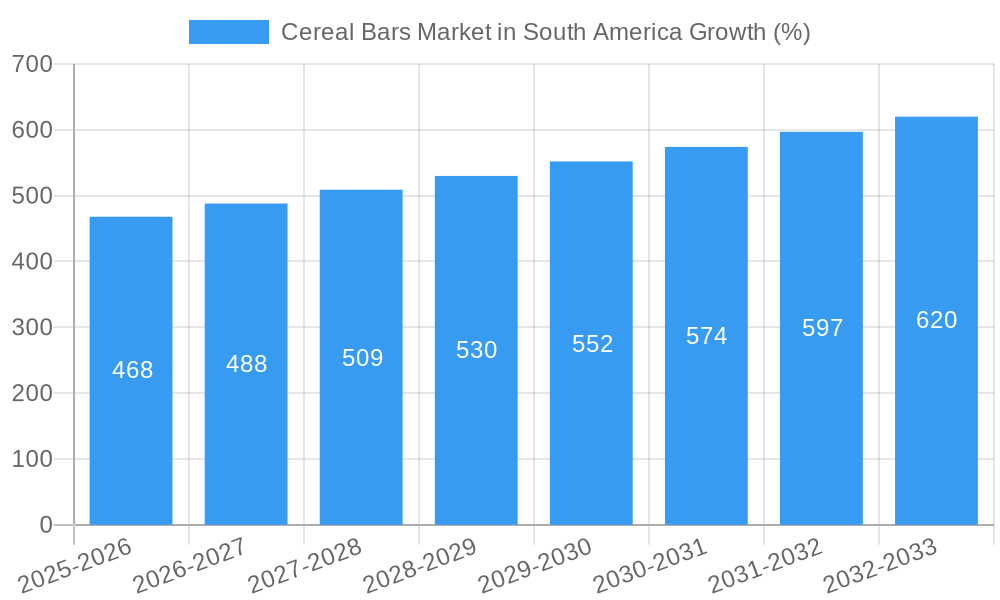
The South American cereal bar market, valued at $10,380 million in 2025, is projected to experience steady growth, driven by increasing health consciousness among consumers and the rising popularity of convenient, on-the-go snack options. The market's Compound Annual Growth Rate (CAGR) of 4.30% from 2025 to 2033 indicates a consistent expansion, with significant opportunities across various segments. Granola/Muesli bars are expected to dominate the product type segment due to their perceived health benefits and versatility, while supermarkets and hypermarkets will continue to be the primary distribution channels, although online retail is anticipated to witness substantial growth fueled by e-commerce penetration and increased smartphone usage across the region. Key players like Kellogg's, Nestlé, General Mills, and PepsiCo are already established in the market, competing with local and emerging brands. Growth will be particularly notable in countries like Brazil and Argentina, reflecting their larger populations and developing economies. However, factors such as fluctuating raw material prices and economic instability in some regions could pose challenges. The market will likely witness increasing product innovation, with manufacturers focusing on organic, gluten-free, and other specialized options catering to evolving consumer preferences. The continued expansion of health-focused initiatives and increasing disposable incomes will further propel market expansion throughout the forecast period.

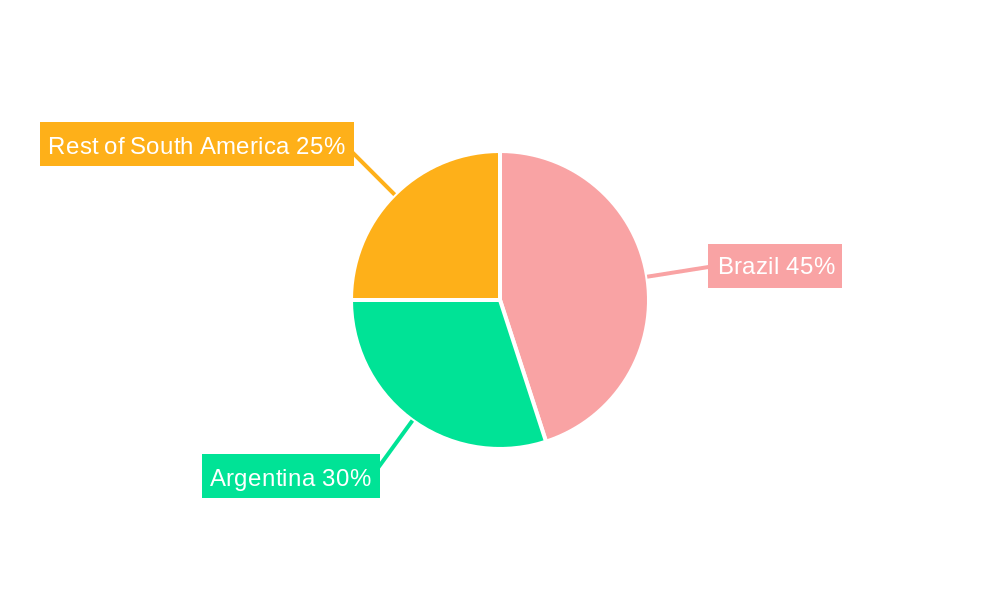
The South American cereal bar market is segmented by product type (Granola/Muesli Bars, Other Cereal Bars) and distribution channel (Supermarkets/Hypermarkets, Convenience Stores, Online Retail Stores, Other Distribution Channels). Brazil and Argentina represent the largest markets within South America, with growth expected across both countries, albeit at potentially different rates due to economic variations. Competitive intensity remains high, with established multinational corporations and smaller regional players vying for market share. Future growth will hinge on successful product diversification, strategic partnerships, and effective marketing campaigns that resonate with the evolving tastes and preferences of South American consumers, particularly highlighting health benefits and convenience. The sustained emphasis on product innovation, especially catering to dietary restrictions and preferences, will play a pivotal role in shaping the market's future trajectory.

Cereal Bars Market in South America Research Report - Market Size, Growth & Forecast

Cereal Bars Market in South America: A Comprehensive Market Report (2019-2033)

This in-depth report provides a comprehensive analysis of the Cereal Bars market in South America, covering market dynamics, growth trends, dominant segments, product landscape, key players, and future outlook. The study period spans from 2019 to 2033, with 2025 as the base and estimated year. The report utilizes a robust methodology incorporating both quantitative and qualitative data to deliver actionable insights for industry professionals. Market values are presented in million units.

Cereal Bars Market in South America Market Dynamics & Structure

This section analyzes the competitive landscape, technological advancements, regulatory environment, and market trends influencing the South American cereal bar market. The market is characterized by a moderately concentrated structure, with key players like The Kellogg Company, Nestle S.A., General Mills Inc., PepsiCo Inc., and Mondelez International Inc. holding significant market share. However, smaller, niche players focusing on organic or specialized bars are emerging.

  • Market Concentration: xx% market share held by top 5 players in 2024.
  • Technological Innovation: Focus on healthier ingredients, improved manufacturing processes, and sustainable packaging driving innovation. However, access to advanced technology remains a barrier for smaller companies.
  • Regulatory Framework: Varying regulations across South American countries regarding food labeling, ingredients, and health claims influencing product formulations and marketing strategies.
  • Competitive Substitutes: Other convenient breakfast and snack options such as yogurt, energy drinks, and fruit snacks exert competitive pressure.
  • End-User Demographics: Growing health consciousness and increasing demand for portable snacks among young professionals and health-conscious consumers fuels market growth.
  • M&A Trends: A moderate number of M&A deals (xx in the past 5 years) have been observed, primarily focused on expanding product portfolios and geographic reach.

Cereal Bars Market in South America Growth Trends & Insights

The South American cereal bar market has witnessed substantial growth during the historical period (2019-2024), driven by increasing disposable incomes, changing lifestyles, and growing demand for convenient and nutritious food options. The market size reached xx million units in 2024 and is projected to grow at a CAGR of xx% during the forecast period (2025-2033), reaching xx million units by 2033. This growth is further fueled by the rising adoption of online retail channels and increasing consumer awareness of health and wellness. Technological disruptions, such as the introduction of innovative ingredients and improved production technologies, are enhancing product quality and variety, further stimulating market expansion. Consumer behavior shifts towards healthier and more convenient snacking options are also contributing to market growth. Market penetration is expected to increase from xx% in 2024 to xx% by 2033.

Cereal Bars Market in South America Growth

Dominant Regions, Countries, or Segments in Cereal Bars Market in South America

Brazil and Argentina currently dominate the South American cereal bar market, accounting for the majority of market share due to their larger populations and higher purchasing power. Within product types, Granola/Muesli bars enjoy a larger market share than other cereal bars, driven by health and wellness trends. Supermarkets/Hypermarkets are the leading distribution channel, though convenience stores and online retail are experiencing rapid growth.

  • Key Drivers in Brazil & Argentina: Strong economic growth, expanding middle class, and increasing urbanization.
  • Granola/Muesli Bar Dominance: Perceived health benefits and versatile consumption occasions fuel this segment's growth.
  • Supermarket/Hypermarket Channel Dominance: Wider product availability and established distribution networks contribute to market leadership.
  • Growth Potential in Online Retail: Increased internet penetration and e-commerce adoption provide significant opportunities for market expansion.

Cereal Bars Market in South America Product Landscape

The South American cereal bar market showcases a diverse range of products, from traditional granola bars to specialized bars with added protein, fiber, or functional ingredients. Product innovation is focused on catering to specific dietary needs and preferences, with a growing emphasis on organic, gluten-free, and vegan options. Key performance indicators include shelf life, nutritional value, and consumer satisfaction. Unique selling propositions (USPs) include convenient packaging, taste, and health benefits. Technological advancements are improving manufacturing efficiency and enhancing product quality and nutritional content.

Key Drivers, Barriers & Challenges in Cereal Bars Market in South America

Key Drivers: Rising health consciousness, increasing demand for convenient snacks, growing urbanization, and rising disposable incomes are major drivers.

Challenges: Fluctuating raw material prices, stringent food safety regulations, intense competition from both established players and new entrants, and challenges in maintaining a consistent supply chain across diverse geographic locations. The impact of fluctuating raw material costs on profit margins is estimated to be xx%.

Emerging Opportunities in Cereal Bars Market in South America

Untapped markets in smaller South American countries present significant growth opportunities. The rising popularity of functional foods and customized nutrition creates potential for innovative product development. Evolving consumer preferences towards healthier and more sustainable products offer opportunities for brands emphasizing organic, natural, and locally sourced ingredients.

Growth Accelerators in the Cereal Bars Market in South America Industry

Strategic partnerships and collaborations between established players and local producers facilitate market expansion. Technological advancements such as improved manufacturing processes and innovative packaging contribute to cost optimization and enhanced product quality. Expansion into new geographic markets and diversification into new product categories, such as protein bars and energy bars, are also key growth accelerators.

Key Players Shaping the Cereal Bars Market in South America Market

  • The Kellogg Company
  • Nestle S.A.
  • General Mills Inc.
  • PepsiCo Inc.
  • Kind LLC
  • Clif Bar & Company
  • Mondelez International Inc.

Notable Milestones in Cereal Bars Market in South America Sector

  • 2021: Launch of a new line of organic cereal bars by Nestle S.A. in Brazil.
  • 2022: Acquisition of a local cereal bar manufacturer by General Mills Inc. in Argentina.
  • 2023: Introduction of a range of vegan cereal bars by a smaller, regional company in Chile.
  • 2024: Expansion of e-commerce channels for Kellogg's cereal bars across South America.

In-Depth Cereal Bars Market in South America Market Outlook

The South American cereal bar market is poised for sustained growth over the forecast period, driven by favorable demographic trends, increasing health awareness, and ongoing product innovation. Strategic investments in research and development, expansion of distribution networks, and targeted marketing campaigns are expected to fuel market expansion and open new opportunities for both established players and emerging companies. The market's future potential lies in capturing the growing demand for healthier and more convenient snacking options in a region with rapidly evolving consumer preferences.

Cereal Bars Market in South America Segmentation

  • 1. Production Analysis
  • 2. Consumption Analysis
  • 3. Import Market Analysis (Value & Volume)
  • 4. Export Market Analysis (Value & Volume)
  • 5. Price Trend Analysis

Cereal Bars Market in South America Segmentation By Geography

  • 1. North America
    • 1.1. United States
    • 1.2. Canada
    • 1.3. Mexico
  • 2. South America
    • 2.1. Brazil
    • 2.2. Argentina
    • 2.3. Rest of South America
  • 3. Europe
    • 3.1. United Kingdom
    • 3.2. Germany
    • 3.3. France
    • 3.4. Italy
    • 3.5. Spain
    • 3.6. Russia
    • 3.7. Benelux
    • 3.8. Nordics
    • 3.9. Rest of Europe
  • 4. Middle East & Africa
    • 4.1. Turkey
    • 4.2. Israel
    • 4.3. GCC
    • 4.4. North Africa
    • 4.5. South Africa
    • 4.6. Rest of Middle East & Africa
  • 5. Asia Pacific
    • 5.1. China
    • 5.2. India
    • 5.3. Japan
    • 5.4. South Korea
    • 5.5. ASEAN
    • 5.6. Oceania
    • 5.7. Rest of Asia Pacific
Cereal Bars Market in South America Regional Share


Cereal Bars Market in South America REPORT HIGHLIGHTS

AspectsDetails
Study Period 2019-2033
Base Year 2024
Estimated Year 2025
Forecast Period2025-2033
Historical Period2019-2024
Growth RateCAGR of 4.30% from 2019-2033
Segmentation
    • By Production Analysis
    • By Consumption Analysis
    • By Import Market Analysis (Value & Volume)
    • By Export Market Analysis (Value & Volume)
    • By Price Trend Analysis
  • By Geography
    • North America
      • United States
      • Canada
      • Mexico
    • South America
      • Brazil
      • Argentina
      • Rest of South America
    • Europe
      • United Kingdom
      • Germany
      • France
      • Italy
      • Spain
      • Russia
      • Benelux
      • Nordics
      • Rest of Europe
    • Middle East & Africa
      • Turkey
      • Israel
      • GCC
      • North Africa
      • South Africa
      • Rest of Middle East & Africa
    • Asia Pacific
      • China
      • India
      • Japan
      • South Korea
      • ASEAN
      • Oceania
      • Rest of Asia Pacific


Table of Contents

  1. 1. Introduction
    • 1.1. Research Scope
    • 1.2. Market Segmentation
    • 1.3. Research Methodology
    • 1.4. Definitions and Assumptions
  2. 2. Executive Summary
    • 2.1. Introduction
  3. 3. Market Dynamics
    • 3.1. Introduction
      • 3.2. Market Drivers
        • 3.2.1. Popularity of Convenient Food Products; Expansion of Cold Chain Logistics
      • 3.3. Market Restrains
        • 3.3.1. Concerns Over Food Safety and Quality
      • 3.4. Market Trends
        • 3.4.1. Surge In The Consumption Of Healthy Food
  4. 4. Market Factor Analysis
    • 4.1. Porters Five Forces
    • 4.2. Supply/Value Chain
    • 4.3. PESTEL analysis
    • 4.4. Market Entropy
    • 4.5. Patent/Trademark Analysis
  5. 5. Global Cereal Bars Market in South America Analysis, Insights and Forecast, 2019-2031
    • 5.1. Market Analysis, Insights and Forecast - by Production Analysis
      • 5.2. Market Analysis, Insights and Forecast - by Consumption Analysis
        • 5.3. Market Analysis, Insights and Forecast - by Import Market Analysis (Value & Volume)
          • 5.4. Market Analysis, Insights and Forecast - by Export Market Analysis (Value & Volume)
            • 5.5. Market Analysis, Insights and Forecast - by Price Trend Analysis
              • 5.6. Market Analysis, Insights and Forecast - by Region
                • 5.6.1. North America
                • 5.6.2. South America
                • 5.6.3. Europe
                • 5.6.4. Middle East & Africa
                • 5.6.5. Asia Pacific
            • 6. North America Cereal Bars Market in South America Analysis, Insights and Forecast, 2019-2031
              • 6.1. Market Analysis, Insights and Forecast - by Production Analysis
                • 6.2. Market Analysis, Insights and Forecast - by Consumption Analysis
                  • 6.3. Market Analysis, Insights and Forecast - by Import Market Analysis (Value & Volume)
                    • 6.4. Market Analysis, Insights and Forecast - by Export Market Analysis (Value & Volume)
                      • 6.5. Market Analysis, Insights and Forecast - by Price Trend Analysis
                      • 7. South America Cereal Bars Market in South America Analysis, Insights and Forecast, 2019-2031
                        • 7.1. Market Analysis, Insights and Forecast - by Production Analysis
                          • 7.2. Market Analysis, Insights and Forecast - by Consumption Analysis
                            • 7.3. Market Analysis, Insights and Forecast - by Import Market Analysis (Value & Volume)
                              • 7.4. Market Analysis, Insights and Forecast - by Export Market Analysis (Value & Volume)
                                • 7.5. Market Analysis, Insights and Forecast - by Price Trend Analysis
                                • 8. Europe Cereal Bars Market in South America Analysis, Insights and Forecast, 2019-2031
                                  • 8.1. Market Analysis, Insights and Forecast - by Production Analysis
                                    • 8.2. Market Analysis, Insights and Forecast - by Consumption Analysis
                                      • 8.3. Market Analysis, Insights and Forecast - by Import Market Analysis (Value & Volume)
                                        • 8.4. Market Analysis, Insights and Forecast - by Export Market Analysis (Value & Volume)
                                          • 8.5. Market Analysis, Insights and Forecast - by Price Trend Analysis
                                          • 9. Middle East & Africa Cereal Bars Market in South America Analysis, Insights and Forecast, 2019-2031
                                            • 9.1. Market Analysis, Insights and Forecast - by Production Analysis
                                              • 9.2. Market Analysis, Insights and Forecast - by Consumption Analysis
                                                • 9.3. Market Analysis, Insights and Forecast - by Import Market Analysis (Value & Volume)
                                                  • 9.4. Market Analysis, Insights and Forecast - by Export Market Analysis (Value & Volume)
                                                    • 9.5. Market Analysis, Insights and Forecast - by Price Trend Analysis
                                                    • 10. Asia Pacific Cereal Bars Market in South America Analysis, Insights and Forecast, 2019-2031
                                                      • 10.1. Market Analysis, Insights and Forecast - by Production Analysis
                                                        • 10.2. Market Analysis, Insights and Forecast - by Consumption Analysis
                                                          • 10.3. Market Analysis, Insights and Forecast - by Import Market Analysis (Value & Volume)
                                                            • 10.4. Market Analysis, Insights and Forecast - by Export Market Analysis (Value & Volume)
                                                              • 10.5. Market Analysis, Insights and Forecast - by Price Trend Analysis
                                                              • 11. Brazil Cereal Bars Market in South America Analysis, Insights and Forecast, 2019-2031
                                                                • 12. Argentina Cereal Bars Market in South America Analysis, Insights and Forecast, 2019-2031
                                                                  • 13. Rest of South America Cereal Bars Market in South America Analysis, Insights and Forecast, 2019-2031
                                                                    • 14. Competitive Analysis
                                                                      • 14.1. Global Market Share Analysis 2024
                                                                        • 14.2. Company Profiles
                                                                          • 14.2.1 The Kellogg Company
                                                                            • 14.2.1.1. Overview
                                                                            • 14.2.1.2. Products
                                                                            • 14.2.1.3. SWOT Analysis
                                                                            • 14.2.1.4. Recent Developments
                                                                            • 14.2.1.5. Financials (Based on Availability)
                                                                          • 14.2.2 Nestle S A
                                                                            • 14.2.2.1. Overview
                                                                            • 14.2.2.2. Products
                                                                            • 14.2.2.3. SWOT Analysis
                                                                            • 14.2.2.4. Recent Developments
                                                                            • 14.2.2.5. Financials (Based on Availability)
                                                                          • 14.2.3 General Mills Inc
                                                                            • 14.2.3.1. Overview
                                                                            • 14.2.3.2. Products
                                                                            • 14.2.3.3. SWOT Analysis
                                                                            • 14.2.3.4. Recent Developments
                                                                            • 14.2.3.5. Financials (Based on Availability)
                                                                          • 14.2.4 PepsiCo Inc
                                                                            • 14.2.4.1. Overview
                                                                            • 14.2.4.2. Products
                                                                            • 14.2.4.3. SWOT Analysis
                                                                            • 14.2.4.4. Recent Developments
                                                                            • 14.2.4.5. Financials (Based on Availability)
                                                                          • 14.2.5 Kind LLC*List Not Exhaustive
                                                                            • 14.2.5.1. Overview
                                                                            • 14.2.5.2. Products
                                                                            • 14.2.5.3. SWOT Analysis
                                                                            • 14.2.5.4. Recent Developments
                                                                            • 14.2.5.5. Financials (Based on Availability)
                                                                          • 14.2.6 Clif Bar & Company
                                                                            • 14.2.6.1. Overview
                                                                            • 14.2.6.2. Products
                                                                            • 14.2.6.3. SWOT Analysis
                                                                            • 14.2.6.4. Recent Developments
                                                                            • 14.2.6.5. Financials (Based on Availability)
                                                                          • 14.2.7 Mondelez International Inc
                                                                            • 14.2.7.1. Overview
                                                                            • 14.2.7.2. Products
                                                                            • 14.2.7.3. SWOT Analysis
                                                                            • 14.2.7.4. Recent Developments
                                                                            • 14.2.7.5. Financials (Based on Availability)

                                                                    List of Figures

                                                                    1. Figure 1: Global Cereal Bars Market in South America Revenue Breakdown (Million, %) by Region 2024 & 2032
                                                                    2. Figure 2: Global Cereal Bars Market in South America Volume Breakdown (K Units, %) by Region 2024 & 2032
                                                                    3. Figure 3: South America Cereal Bars Market in South America Revenue (Million), by Country 2024 & 2032
                                                                    4. Figure 4: South America Cereal Bars Market in South America Volume (K Units), by Country 2024 & 2032
                                                                    5. Figure 5: South America Cereal Bars Market in South America Revenue Share (%), by Country 2024 & 2032
                                                                    6. Figure 6: South America Cereal Bars Market in South America Volume Share (%), by Country 2024 & 2032
                                                                    7. Figure 7: North America Cereal Bars Market in South America Revenue (Million), by Production Analysis 2024 & 2032
                                                                    8. Figure 8: North America Cereal Bars Market in South America Volume (K Units), by Production Analysis 2024 & 2032
                                                                    9. Figure 9: North America Cereal Bars Market in South America Revenue Share (%), by Production Analysis 2024 & 2032
                                                                    10. Figure 10: North America Cereal Bars Market in South America Volume Share (%), by Production Analysis 2024 & 2032
                                                                    11. Figure 11: North America Cereal Bars Market in South America Revenue (Million), by Consumption Analysis 2024 & 2032
                                                                    12. Figure 12: North America Cereal Bars Market in South America Volume (K Units), by Consumption Analysis 2024 & 2032
                                                                    13. Figure 13: North America Cereal Bars Market in South America Revenue Share (%), by Consumption Analysis 2024 & 2032
                                                                    14. Figure 14: North America Cereal Bars Market in South America Volume Share (%), by Consumption Analysis 2024 & 2032
                                                                    15. Figure 15: North America Cereal Bars Market in South America Revenue (Million), by Import Market Analysis (Value & Volume) 2024 & 2032
                                                                    16. Figure 16: North America Cereal Bars Market in South America Volume (K Units), by Import Market Analysis (Value & Volume) 2024 & 2032
                                                                    17. Figure 17: North America Cereal Bars Market in South America Revenue Share (%), by Import Market Analysis (Value & Volume) 2024 & 2032
                                                                    18. Figure 18: North America Cereal Bars Market in South America Volume Share (%), by Import Market Analysis (Value & Volume) 2024 & 2032
                                                                    19. Figure 19: North America Cereal Bars Market in South America Revenue (Million), by Export Market Analysis (Value & Volume) 2024 & 2032
                                                                    20. Figure 20: North America Cereal Bars Market in South America Volume (K Units), by Export Market Analysis (Value & Volume) 2024 & 2032
                                                                    21. Figure 21: North America Cereal Bars Market in South America Revenue Share (%), by Export Market Analysis (Value & Volume) 2024 & 2032
                                                                    22. Figure 22: North America Cereal Bars Market in South America Volume Share (%), by Export Market Analysis (Value & Volume) 2024 & 2032
                                                                    23. Figure 23: North America Cereal Bars Market in South America Revenue (Million), by Price Trend Analysis 2024 & 2032
                                                                    24. Figure 24: North America Cereal Bars Market in South America Volume (K Units), by Price Trend Analysis 2024 & 2032
                                                                    25. Figure 25: North America Cereal Bars Market in South America Revenue Share (%), by Price Trend Analysis 2024 & 2032
                                                                    26. Figure 26: North America Cereal Bars Market in South America Volume Share (%), by Price Trend Analysis 2024 & 2032
                                                                    27. Figure 27: North America Cereal Bars Market in South America Revenue (Million), by Country 2024 & 2032
                                                                    28. Figure 28: North America Cereal Bars Market in South America Volume (K Units), by Country 2024 & 2032
                                                                    29. Figure 29: North America Cereal Bars Market in South America Revenue Share (%), by Country 2024 & 2032
                                                                    30. Figure 30: North America Cereal Bars Market in South America Volume Share (%), by Country 2024 & 2032
                                                                    31. Figure 31: South America Cereal Bars Market in South America Revenue (Million), by Production Analysis 2024 & 2032
                                                                    32. Figure 32: South America Cereal Bars Market in South America Volume (K Units), by Production Analysis 2024 & 2032
                                                                    33. Figure 33: South America Cereal Bars Market in South America Revenue Share (%), by Production Analysis 2024 & 2032
                                                                    34. Figure 34: South America Cereal Bars Market in South America Volume Share (%), by Production Analysis 2024 & 2032
                                                                    35. Figure 35: South America Cereal Bars Market in South America Revenue (Million), by Consumption Analysis 2024 & 2032
                                                                    36. Figure 36: South America Cereal Bars Market in South America Volume (K Units), by Consumption Analysis 2024 & 2032
                                                                    37. Figure 37: South America Cereal Bars Market in South America Revenue Share (%), by Consumption Analysis 2024 & 2032
                                                                    38. Figure 38: South America Cereal Bars Market in South America Volume Share (%), by Consumption Analysis 2024 & 2032
                                                                    39. Figure 39: South America Cereal Bars Market in South America Revenue (Million), by Import Market Analysis (Value & Volume) 2024 & 2032
                                                                    40. Figure 40: South America Cereal Bars Market in South America Volume (K Units), by Import Market Analysis (Value & Volume) 2024 & 2032
                                                                    41. Figure 41: South America Cereal Bars Market in South America Revenue Share (%), by Import Market Analysis (Value & Volume) 2024 & 2032
                                                                    42. Figure 42: South America Cereal Bars Market in South America Volume Share (%), by Import Market Analysis (Value & Volume) 2024 & 2032
                                                                    43. Figure 43: South America Cereal Bars Market in South America Revenue (Million), by Export Market Analysis (Value & Volume) 2024 & 2032
                                                                    44. Figure 44: South America Cereal Bars Market in South America Volume (K Units), by Export Market Analysis (Value & Volume) 2024 & 2032
                                                                    45. Figure 45: South America Cereal Bars Market in South America Revenue Share (%), by Export Market Analysis (Value & Volume) 2024 & 2032
                                                                    46. Figure 46: South America Cereal Bars Market in South America Volume Share (%), by Export Market Analysis (Value & Volume) 2024 & 2032
                                                                    47. Figure 47: South America Cereal Bars Market in South America Revenue (Million), by Price Trend Analysis 2024 & 2032
                                                                    48. Figure 48: South America Cereal Bars Market in South America Volume (K Units), by Price Trend Analysis 2024 & 2032
                                                                    49. Figure 49: South America Cereal Bars Market in South America Revenue Share (%), by Price Trend Analysis 2024 & 2032
                                                                    50. Figure 50: South America Cereal Bars Market in South America Volume Share (%), by Price Trend Analysis 2024 & 2032
                                                                    51. Figure 51: South America Cereal Bars Market in South America Revenue (Million), by Country 2024 & 2032
                                                                    52. Figure 52: South America Cereal Bars Market in South America Volume (K Units), by Country 2024 & 2032
                                                                    53. Figure 53: South America Cereal Bars Market in South America Revenue Share (%), by Country 2024 & 2032
                                                                    54. Figure 54: South America Cereal Bars Market in South America Volume Share (%), by Country 2024 & 2032
                                                                    55. Figure 55: Europe Cereal Bars Market in South America Revenue (Million), by Production Analysis 2024 & 2032
                                                                    56. Figure 56: Europe Cereal Bars Market in South America Volume (K Units), by Production Analysis 2024 & 2032
                                                                    57. Figure 57: Europe Cereal Bars Market in South America Revenue Share (%), by Production Analysis 2024 & 2032
                                                                    58. Figure 58: Europe Cereal Bars Market in South America Volume Share (%), by Production Analysis 2024 & 2032
                                                                    59. Figure 59: Europe Cereal Bars Market in South America Revenue (Million), by Consumption Analysis 2024 & 2032
                                                                    60. Figure 60: Europe Cereal Bars Market in South America Volume (K Units), by Consumption Analysis 2024 & 2032
                                                                    61. Figure 61: Europe Cereal Bars Market in South America Revenue Share (%), by Consumption Analysis 2024 & 2032
                                                                    62. Figure 62: Europe Cereal Bars Market in South America Volume Share (%), by Consumption Analysis 2024 & 2032
                                                                    63. Figure 63: Europe Cereal Bars Market in South America Revenue (Million), by Import Market Analysis (Value & Volume) 2024 & 2032
                                                                    64. Figure 64: Europe Cereal Bars Market in South America Volume (K Units), by Import Market Analysis (Value & Volume) 2024 & 2032
                                                                    65. Figure 65: Europe Cereal Bars Market in South America Revenue Share (%), by Import Market Analysis (Value & Volume) 2024 & 2032
                                                                    66. Figure 66: Europe Cereal Bars Market in South America Volume Share (%), by Import Market Analysis (Value & Volume) 2024 & 2032
                                                                    67. Figure 67: Europe Cereal Bars Market in South America Revenue (Million), by Export Market Analysis (Value & Volume) 2024 & 2032
                                                                    68. Figure 68: Europe Cereal Bars Market in South America Volume (K Units), by Export Market Analysis (Value & Volume) 2024 & 2032
                                                                    69. Figure 69: Europe Cereal Bars Market in South America Revenue Share (%), by Export Market Analysis (Value & Volume) 2024 & 2032
                                                                    70. Figure 70: Europe Cereal Bars Market in South America Volume Share (%), by Export Market Analysis (Value & Volume) 2024 & 2032
                                                                    71. Figure 71: Europe Cereal Bars Market in South America Revenue (Million), by Price Trend Analysis 2024 & 2032
                                                                    72. Figure 72: Europe Cereal Bars Market in South America Volume (K Units), by Price Trend Analysis 2024 & 2032
                                                                    73. Figure 73: Europe Cereal Bars Market in South America Revenue Share (%), by Price Trend Analysis 2024 & 2032
                                                                    74. Figure 74: Europe Cereal Bars Market in South America Volume Share (%), by Price Trend Analysis 2024 & 2032
                                                                    75. Figure 75: Europe Cereal Bars Market in South America Revenue (Million), by Country 2024 & 2032
                                                                    76. Figure 76: Europe Cereal Bars Market in South America Volume (K Units), by Country 2024 & 2032
                                                                    77. Figure 77: Europe Cereal Bars Market in South America Revenue Share (%), by Country 2024 & 2032
                                                                    78. Figure 78: Europe Cereal Bars Market in South America Volume Share (%), by Country 2024 & 2032
                                                                    79. Figure 79: Middle East & Africa Cereal Bars Market in South America Revenue (Million), by Production Analysis 2024 & 2032
                                                                    80. Figure 80: Middle East & Africa Cereal Bars Market in South America Volume (K Units), by Production Analysis 2024 & 2032
                                                                    81. Figure 81: Middle East & Africa Cereal Bars Market in South America Revenue Share (%), by Production Analysis 2024 & 2032
                                                                    82. Figure 82: Middle East & Africa Cereal Bars Market in South America Volume Share (%), by Production Analysis 2024 & 2032
                                                                    83. Figure 83: Middle East & Africa Cereal Bars Market in South America Revenue (Million), by Consumption Analysis 2024 & 2032
                                                                    84. Figure 84: Middle East & Africa Cereal Bars Market in South America Volume (K Units), by Consumption Analysis 2024 & 2032
                                                                    85. Figure 85: Middle East & Africa Cereal Bars Market in South America Revenue Share (%), by Consumption Analysis 2024 & 2032
                                                                    86. Figure 86: Middle East & Africa Cereal Bars Market in South America Volume Share (%), by Consumption Analysis 2024 & 2032
                                                                    87. Figure 87: Middle East & Africa Cereal Bars Market in South America Revenue (Million), by Import Market Analysis (Value & Volume) 2024 & 2032
                                                                    88. Figure 88: Middle East & Africa Cereal Bars Market in South America Volume (K Units), by Import Market Analysis (Value & Volume) 2024 & 2032
                                                                    89. Figure 89: Middle East & Africa Cereal Bars Market in South America Revenue Share (%), by Import Market Analysis (Value & Volume) 2024 & 2032
                                                                    90. Figure 90: Middle East & Africa Cereal Bars Market in South America Volume Share (%), by Import Market Analysis (Value & Volume) 2024 & 2032
                                                                    91. Figure 91: Middle East & Africa Cereal Bars Market in South America Revenue (Million), by Export Market Analysis (Value & Volume) 2024 & 2032
                                                                    92. Figure 92: Middle East & Africa Cereal Bars Market in South America Volume (K Units), by Export Market Analysis (Value & Volume) 2024 & 2032
                                                                    93. Figure 93: Middle East & Africa Cereal Bars Market in South America Revenue Share (%), by Export Market Analysis (Value & Volume) 2024 & 2032
                                                                    94. Figure 94: Middle East & Africa Cereal Bars Market in South America Volume Share (%), by Export Market Analysis (Value & Volume) 2024 & 2032
                                                                    95. Figure 95: Middle East & Africa Cereal Bars Market in South America Revenue (Million), by Price Trend Analysis 2024 & 2032
                                                                    96. Figure 96: Middle East & Africa Cereal Bars Market in South America Volume (K Units), by Price Trend Analysis 2024 & 2032
                                                                    97. Figure 97: Middle East & Africa Cereal Bars Market in South America Revenue Share (%), by Price Trend Analysis 2024 & 2032
                                                                    98. Figure 98: Middle East & Africa Cereal Bars Market in South America Volume Share (%), by Price Trend Analysis 2024 & 2032
                                                                    99. Figure 99: Middle East & Africa Cereal Bars Market in South America Revenue (Million), by Country 2024 & 2032
                                                                    100. Figure 100: Middle East & Africa Cereal Bars Market in South America Volume (K Units), by Country 2024 & 2032
                                                                    101. Figure 101: Middle East & Africa Cereal Bars Market in South America Revenue Share (%), by Country 2024 & 2032
                                                                    102. Figure 102: Middle East & Africa Cereal Bars Market in South America Volume Share (%), by Country 2024 & 2032
                                                                    103. Figure 103: Asia Pacific Cereal Bars Market in South America Revenue (Million), by Production Analysis 2024 & 2032
                                                                    104. Figure 104: Asia Pacific Cereal Bars Market in South America Volume (K Units), by Production Analysis 2024 & 2032
                                                                    105. Figure 105: Asia Pacific Cereal Bars Market in South America Revenue Share (%), by Production Analysis 2024 & 2032
                                                                    106. Figure 106: Asia Pacific Cereal Bars Market in South America Volume Share (%), by Production Analysis 2024 & 2032
                                                                    107. Figure 107: Asia Pacific Cereal Bars Market in South America Revenue (Million), by Consumption Analysis 2024 & 2032
                                                                    108. Figure 108: Asia Pacific Cereal Bars Market in South America Volume (K Units), by Consumption Analysis 2024 & 2032
                                                                    109. Figure 109: Asia Pacific Cereal Bars Market in South America Revenue Share (%), by Consumption Analysis 2024 & 2032
                                                                    110. Figure 110: Asia Pacific Cereal Bars Market in South America Volume Share (%), by Consumption Analysis 2024 & 2032
                                                                    111. Figure 111: Asia Pacific Cereal Bars Market in South America Revenue (Million), by Import Market Analysis (Value & Volume) 2024 & 2032
                                                                    112. Figure 112: Asia Pacific Cereal Bars Market in South America Volume (K Units), by Import Market Analysis (Value & Volume) 2024 & 2032
                                                                    113. Figure 113: Asia Pacific Cereal Bars Market in South America Revenue Share (%), by Import Market Analysis (Value & Volume) 2024 & 2032
                                                                    114. Figure 114: Asia Pacific Cereal Bars Market in South America Volume Share (%), by Import Market Analysis (Value & Volume) 2024 & 2032
                                                                    115. Figure 115: Asia Pacific Cereal Bars Market in South America Revenue (Million), by Export Market Analysis (Value & Volume) 2024 & 2032
                                                                    116. Figure 116: Asia Pacific Cereal Bars Market in South America Volume (K Units), by Export Market Analysis (Value & Volume) 2024 & 2032
                                                                    117. Figure 117: Asia Pacific Cereal Bars Market in South America Revenue Share (%), by Export Market Analysis (Value & Volume) 2024 & 2032
                                                                    118. Figure 118: Asia Pacific Cereal Bars Market in South America Volume Share (%), by Export Market Analysis (Value & Volume) 2024 & 2032
                                                                    119. Figure 119: Asia Pacific Cereal Bars Market in South America Revenue (Million), by Price Trend Analysis 2024 & 2032
                                                                    120. Figure 120: Asia Pacific Cereal Bars Market in South America Volume (K Units), by Price Trend Analysis 2024 & 2032
                                                                    121. Figure 121: Asia Pacific Cereal Bars Market in South America Revenue Share (%), by Price Trend Analysis 2024 & 2032
                                                                    122. Figure 122: Asia Pacific Cereal Bars Market in South America Volume Share (%), by Price Trend Analysis 2024 & 2032
                                                                    123. Figure 123: Asia Pacific Cereal Bars Market in South America Revenue (Million), by Country 2024 & 2032
                                                                    124. Figure 124: Asia Pacific Cereal Bars Market in South America Volume (K Units), by Country 2024 & 2032
                                                                    125. Figure 125: Asia Pacific Cereal Bars Market in South America Revenue Share (%), by Country 2024 & 2032
                                                                    126. Figure 126: Asia Pacific Cereal Bars Market in South America Volume Share (%), by Country 2024 & 2032

                                                                    List of Tables

                                                                    1. Table 1: Global Cereal Bars Market in South America Revenue Million Forecast, by Region 2019 & 2032
                                                                    2. Table 2: Global Cereal Bars Market in South America Volume K Units Forecast, by Region 2019 & 2032
                                                                    3. Table 3: Global Cereal Bars Market in South America Revenue Million Forecast, by Production Analysis 2019 & 2032
                                                                    4. Table 4: Global Cereal Bars Market in South America Volume K Units Forecast, by Production Analysis 2019 & 2032
                                                                    5. Table 5: Global Cereal Bars Market in South America Revenue Million Forecast, by Consumption Analysis 2019 & 2032
                                                                    6. Table 6: Global Cereal Bars Market in South America Volume K Units Forecast, by Consumption Analysis 2019 & 2032
                                                                    7. Table 7: Global Cereal Bars Market in South America Revenue Million Forecast, by Import Market Analysis (Value & Volume) 2019 & 2032
                                                                    8. Table 8: Global Cereal Bars Market in South America Volume K Units Forecast, by Import Market Analysis (Value & Volume) 2019 & 2032
                                                                    9. Table 9: Global Cereal Bars Market in South America Revenue Million Forecast, by Export Market Analysis (Value & Volume) 2019 & 2032
                                                                    10. Table 10: Global Cereal Bars Market in South America Volume K Units Forecast, by Export Market Analysis (Value & Volume) 2019 & 2032
                                                                    11. Table 11: Global Cereal Bars Market in South America Revenue Million Forecast, by Price Trend Analysis 2019 & 2032
                                                                    12. Table 12: Global Cereal Bars Market in South America Volume K Units Forecast, by Price Trend Analysis 2019 & 2032
                                                                    13. Table 13: Global Cereal Bars Market in South America Revenue Million Forecast, by Region 2019 & 2032
                                                                    14. Table 14: Global Cereal Bars Market in South America Volume K Units Forecast, by Region 2019 & 2032
                                                                    15. Table 15: Global Cereal Bars Market in South America Revenue Million Forecast, by Country 2019 & 2032
                                                                    16. Table 16: Global Cereal Bars Market in South America Volume K Units Forecast, by Country 2019 & 2032
                                                                    17. Table 17: Brazil Cereal Bars Market in South America Revenue (Million) Forecast, by Application 2019 & 2032
                                                                    18. Table 18: Brazil Cereal Bars Market in South America Volume (K Units) Forecast, by Application 2019 & 2032
                                                                    19. Table 19: Argentina Cereal Bars Market in South America Revenue (Million) Forecast, by Application 2019 & 2032
                                                                    20. Table 20: Argentina Cereal Bars Market in South America Volume (K Units) Forecast, by Application 2019 & 2032
                                                                    21. Table 21: Rest of South America Cereal Bars Market in South America Revenue (Million) Forecast, by Application 2019 & 2032
                                                                    22. Table 22: Rest of South America Cereal Bars Market in South America Volume (K Units) Forecast, by Application 2019 & 2032
                                                                    23. Table 23: Global Cereal Bars Market in South America Revenue Million Forecast, by Production Analysis 2019 & 2032
                                                                    24. Table 24: Global Cereal Bars Market in South America Volume K Units Forecast, by Production Analysis 2019 & 2032
                                                                    25. Table 25: Global Cereal Bars Market in South America Revenue Million Forecast, by Consumption Analysis 2019 & 2032
                                                                    26. Table 26: Global Cereal Bars Market in South America Volume K Units Forecast, by Consumption Analysis 2019 & 2032
                                                                    27. Table 27: Global Cereal Bars Market in South America Revenue Million Forecast, by Import Market Analysis (Value & Volume) 2019 & 2032
                                                                    28. Table 28: Global Cereal Bars Market in South America Volume K Units Forecast, by Import Market Analysis (Value & Volume) 2019 & 2032
                                                                    29. Table 29: Global Cereal Bars Market in South America Revenue Million Forecast, by Export Market Analysis (Value & Volume) 2019 & 2032
                                                                    30. Table 30: Global Cereal Bars Market in South America Volume K Units Forecast, by Export Market Analysis (Value & Volume) 2019 & 2032
                                                                    31. Table 31: Global Cereal Bars Market in South America Revenue Million Forecast, by Price Trend Analysis 2019 & 2032
                                                                    32. Table 32: Global Cereal Bars Market in South America Volume K Units Forecast, by Price Trend Analysis 2019 & 2032
                                                                    33. Table 33: Global Cereal Bars Market in South America Revenue Million Forecast, by Country 2019 & 2032
                                                                    34. Table 34: Global Cereal Bars Market in South America Volume K Units Forecast, by Country 2019 & 2032
                                                                    35. Table 35: United States Cereal Bars Market in South America Revenue (Million) Forecast, by Application 2019 & 2032
                                                                    36. Table 36: United States Cereal Bars Market in South America Volume (K Units) Forecast, by Application 2019 & 2032
                                                                    37. Table 37: Canada Cereal Bars Market in South America Revenue (Million) Forecast, by Application 2019 & 2032
                                                                    38. Table 38: Canada Cereal Bars Market in South America Volume (K Units) Forecast, by Application 2019 & 2032
                                                                    39. Table 39: Mexico Cereal Bars Market in South America Revenue (Million) Forecast, by Application 2019 & 2032
                                                                    40. Table 40: Mexico Cereal Bars Market in South America Volume (K Units) Forecast, by Application 2019 & 2032
                                                                    41. Table 41: Global Cereal Bars Market in South America Revenue Million Forecast, by Production Analysis 2019 & 2032
                                                                    42. Table 42: Global Cereal Bars Market in South America Volume K Units Forecast, by Production Analysis 2019 & 2032
                                                                    43. Table 43: Global Cereal Bars Market in South America Revenue Million Forecast, by Consumption Analysis 2019 & 2032
                                                                    44. Table 44: Global Cereal Bars Market in South America Volume K Units Forecast, by Consumption Analysis 2019 & 2032
                                                                    45. Table 45: Global Cereal Bars Market in South America Revenue Million Forecast, by Import Market Analysis (Value & Volume) 2019 & 2032
                                                                    46. Table 46: Global Cereal Bars Market in South America Volume K Units Forecast, by Import Market Analysis (Value & Volume) 2019 & 2032
                                                                    47. Table 47: Global Cereal Bars Market in South America Revenue Million Forecast, by Export Market Analysis (Value & Volume) 2019 & 2032
                                                                    48. Table 48: Global Cereal Bars Market in South America Volume K Units Forecast, by Export Market Analysis (Value & Volume) 2019 & 2032
                                                                    49. Table 49: Global Cereal Bars Market in South America Revenue Million Forecast, by Price Trend Analysis 2019 & 2032
                                                                    50. Table 50: Global Cereal Bars Market in South America Volume K Units Forecast, by Price Trend Analysis 2019 & 2032
                                                                    51. Table 51: Global Cereal Bars Market in South America Revenue Million Forecast, by Country 2019 & 2032
                                                                    52. Table 52: Global Cereal Bars Market in South America Volume K Units Forecast, by Country 2019 & 2032
                                                                    53. Table 53: Brazil Cereal Bars Market in South America Revenue (Million) Forecast, by Application 2019 & 2032
                                                                    54. Table 54: Brazil Cereal Bars Market in South America Volume (K Units) Forecast, by Application 2019 & 2032
                                                                    55. Table 55: Argentina Cereal Bars Market in South America Revenue (Million) Forecast, by Application 2019 & 2032
                                                                    56. Table 56: Argentina Cereal Bars Market in South America Volume (K Units) Forecast, by Application 2019 & 2032
                                                                    57. Table 57: Rest of South America Cereal Bars Market in South America Revenue (Million) Forecast, by Application 2019 & 2032
                                                                    58. Table 58: Rest of South America Cereal Bars Market in South America Volume (K Units) Forecast, by Application 2019 & 2032
                                                                    59. Table 59: Global Cereal Bars Market in South America Revenue Million Forecast, by Production Analysis 2019 & 2032
                                                                    60. Table 60: Global Cereal Bars Market in South America Volume K Units Forecast, by Production Analysis 2019 & 2032
                                                                    61. Table 61: Global Cereal Bars Market in South America Revenue Million Forecast, by Consumption Analysis 2019 & 2032
                                                                    62. Table 62: Global Cereal Bars Market in South America Volume K Units Forecast, by Consumption Analysis 2019 & 2032
                                                                    63. Table 63: Global Cereal Bars Market in South America Revenue Million Forecast, by Import Market Analysis (Value & Volume) 2019 & 2032
                                                                    64. Table 64: Global Cereal Bars Market in South America Volume K Units Forecast, by Import Market Analysis (Value & Volume) 2019 & 2032
                                                                    65. Table 65: Global Cereal Bars Market in South America Revenue Million Forecast, by Export Market Analysis (Value & Volume) 2019 & 2032
                                                                    66. Table 66: Global Cereal Bars Market in South America Volume K Units Forecast, by Export Market Analysis (Value & Volume) 2019 & 2032
                                                                    67. Table 67: Global Cereal Bars Market in South America Revenue Million Forecast, by Price Trend Analysis 2019 & 2032
                                                                    68. Table 68: Global Cereal Bars Market in South America Volume K Units Forecast, by Price Trend Analysis 2019 & 2032
                                                                    69. Table 69: Global Cereal Bars Market in South America Revenue Million Forecast, by Country 2019 & 2032
                                                                    70. Table 70: Global Cereal Bars Market in South America Volume K Units Forecast, by Country 2019 & 2032
                                                                    71. Table 71: United Kingdom Cereal Bars Market in South America Revenue (Million) Forecast, by Application 2019 & 2032
                                                                    72. Table 72: United Kingdom Cereal Bars Market in South America Volume (K Units) Forecast, by Application 2019 & 2032
                                                                    73. Table 73: Germany Cereal Bars Market in South America Revenue (Million) Forecast, by Application 2019 & 2032
                                                                    74. Table 74: Germany Cereal Bars Market in South America Volume (K Units) Forecast, by Application 2019 & 2032
                                                                    75. Table 75: France Cereal Bars Market in South America Revenue (Million) Forecast, by Application 2019 & 2032
                                                                    76. Table 76: France Cereal Bars Market in South America Volume (K Units) Forecast, by Application 2019 & 2032
                                                                    77. Table 77: Italy Cereal Bars Market in South America Revenue (Million) Forecast, by Application 2019 & 2032
                                                                    78. Table 78: Italy Cereal Bars Market in South America Volume (K Units) Forecast, by Application 2019 & 2032
                                                                    79. Table 79: Spain Cereal Bars Market in South America Revenue (Million) Forecast, by Application 2019 & 2032
                                                                    80. Table 80: Spain Cereal Bars Market in South America Volume (K Units) Forecast, by Application 2019 & 2032
                                                                    81. Table 81: Russia Cereal Bars Market in South America Revenue (Million) Forecast, by Application 2019 & 2032
                                                                    82. Table 82: Russia Cereal Bars Market in South America Volume (K Units) Forecast, by Application 2019 & 2032
                                                                    83. Table 83: Benelux Cereal Bars Market in South America Revenue (Million) Forecast, by Application 2019 & 2032
                                                                    84. Table 84: Benelux Cereal Bars Market in South America Volume (K Units) Forecast, by Application 2019 & 2032
                                                                    85. Table 85: Nordics Cereal Bars Market in South America Revenue (Million) Forecast, by Application 2019 & 2032
                                                                    86. Table 86: Nordics Cereal Bars Market in South America Volume (K Units) Forecast, by Application 2019 & 2032
                                                                    87. Table 87: Rest of Europe Cereal Bars Market in South America Revenue (Million) Forecast, by Application 2019 & 2032
                                                                    88. Table 88: Rest of Europe Cereal Bars Market in South America Volume (K Units) Forecast, by Application 2019 & 2032
                                                                    89. Table 89: Global Cereal Bars Market in South America Revenue Million Forecast, by Production Analysis 2019 & 2032
                                                                    90. Table 90: Global Cereal Bars Market in South America Volume K Units Forecast, by Production Analysis 2019 & 2032
                                                                    91. Table 91: Global Cereal Bars Market in South America Revenue Million Forecast, by Consumption Analysis 2019 & 2032
                                                                    92. Table 92: Global Cereal Bars Market in South America Volume K Units Forecast, by Consumption Analysis 2019 & 2032
                                                                    93. Table 93: Global Cereal Bars Market in South America Revenue Million Forecast, by Import Market Analysis (Value & Volume) 2019 & 2032
                                                                    94. Table 94: Global Cereal Bars Market in South America Volume K Units Forecast, by Import Market Analysis (Value & Volume) 2019 & 2032
                                                                    95. Table 95: Global Cereal Bars Market in South America Revenue Million Forecast, by Export Market Analysis (Value & Volume) 2019 & 2032
                                                                    96. Table 96: Global Cereal Bars Market in South America Volume K Units Forecast, by Export Market Analysis (Value & Volume) 2019 & 2032
                                                                    97. Table 97: Global Cereal Bars Market in South America Revenue Million Forecast, by Price Trend Analysis 2019 & 2032
                                                                    98. Table 98: Global Cereal Bars Market in South America Volume K Units Forecast, by Price Trend Analysis 2019 & 2032
                                                                    99. Table 99: Global Cereal Bars Market in South America Revenue Million Forecast, by Country 2019 & 2032
                                                                    100. Table 100: Global Cereal Bars Market in South America Volume K Units Forecast, by Country 2019 & 2032
                                                                    101. Table 101: Turkey Cereal Bars Market in South America Revenue (Million) Forecast, by Application 2019 & 2032
                                                                    102. Table 102: Turkey Cereal Bars Market in South America Volume (K Units) Forecast, by Application 2019 & 2032
                                                                    103. Table 103: Israel Cereal Bars Market in South America Revenue (Million) Forecast, by Application 2019 & 2032
                                                                    104. Table 104: Israel Cereal Bars Market in South America Volume (K Units) Forecast, by Application 2019 & 2032
                                                                    105. Table 105: GCC Cereal Bars Market in South America Revenue (Million) Forecast, by Application 2019 & 2032
                                                                    106. Table 106: GCC Cereal Bars Market in South America Volume (K Units) Forecast, by Application 2019 & 2032
                                                                    107. Table 107: North Africa Cereal Bars Market in South America Revenue (Million) Forecast, by Application 2019 & 2032
                                                                    108. Table 108: North Africa Cereal Bars Market in South America Volume (K Units) Forecast, by Application 2019 & 2032
                                                                    109. Table 109: South Africa Cereal Bars Market in South America Revenue (Million) Forecast, by Application 2019 & 2032
                                                                    110. Table 110: South Africa Cereal Bars Market in South America Volume (K Units) Forecast, by Application 2019 & 2032
                                                                    111. Table 111: Rest of Middle East & Africa Cereal Bars Market in South America Revenue (Million) Forecast, by Application 2019 & 2032
                                                                    112. Table 112: Rest of Middle East & Africa Cereal Bars Market in South America Volume (K Units) Forecast, by Application 2019 & 2032
                                                                    113. Table 113: Global Cereal Bars Market in South America Revenue Million Forecast, by Production Analysis 2019 & 2032
                                                                    114. Table 114: Global Cereal Bars Market in South America Volume K Units Forecast, by Production Analysis 2019 & 2032
                                                                    115. Table 115: Global Cereal Bars Market in South America Revenue Million Forecast, by Consumption Analysis 2019 & 2032
                                                                    116. Table 116: Global Cereal Bars Market in South America Volume K Units Forecast, by Consumption Analysis 2019 & 2032
                                                                    117. Table 117: Global Cereal Bars Market in South America Revenue Million Forecast, by Import Market Analysis (Value & Volume) 2019 & 2032
                                                                    118. Table 118: Global Cereal Bars Market in South America Volume K Units Forecast, by Import Market Analysis (Value & Volume) 2019 & 2032
                                                                    119. Table 119: Global Cereal Bars Market in South America Revenue Million Forecast, by Export Market Analysis (Value & Volume) 2019 & 2032
                                                                    120. Table 120: Global Cereal Bars Market in South America Volume K Units Forecast, by Export Market Analysis (Value & Volume) 2019 & 2032
                                                                    121. Table 121: Global Cereal Bars Market in South America Revenue Million Forecast, by Price Trend Analysis 2019 & 2032
                                                                    122. Table 122: Global Cereal Bars Market in South America Volume K Units Forecast, by Price Trend Analysis 2019 & 2032
                                                                    123. Table 123: Global Cereal Bars Market in South America Revenue Million Forecast, by Country 2019 & 2032
                                                                    124. Table 124: Global Cereal Bars Market in South America Volume K Units Forecast, by Country 2019 & 2032
                                                                    125. Table 125: China Cereal Bars Market in South America Revenue (Million) Forecast, by Application 2019 & 2032
                                                                    126. Table 126: China Cereal Bars Market in South America Volume (K Units) Forecast, by Application 2019 & 2032
                                                                    127. Table 127: India Cereal Bars Market in South America Revenue (Million) Forecast, by Application 2019 & 2032
                                                                    128. Table 128: India Cereal Bars Market in South America Volume (K Units) Forecast, by Application 2019 & 2032
                                                                    129. Table 129: Japan Cereal Bars Market in South America Revenue (Million) Forecast, by Application 2019 & 2032
                                                                    130. Table 130: Japan Cereal Bars Market in South America Volume (K Units) Forecast, by Application 2019 & 2032
                                                                    131. Table 131: South Korea Cereal Bars Market in South America Revenue (Million) Forecast, by Application 2019 & 2032
                                                                    132. Table 132: South Korea Cereal Bars Market in South America Volume (K Units) Forecast, by Application 2019 & 2032
                                                                    133. Table 133: ASEAN Cereal Bars Market in South America Revenue (Million) Forecast, by Application 2019 & 2032
                                                                    134. Table 134: ASEAN Cereal Bars Market in South America Volume (K Units) Forecast, by Application 2019 & 2032
                                                                    135. Table 135: Oceania Cereal Bars Market in South America Revenue (Million) Forecast, by Application 2019 & 2032
                                                                    136. Table 136: Oceania Cereal Bars Market in South America Volume (K Units) Forecast, by Application 2019 & 2032
                                                                    137. Table 137: Rest of Asia Pacific Cereal Bars Market in South America Revenue (Million) Forecast, by Application 2019 & 2032
                                                                    138. Table 138: Rest of Asia Pacific Cereal Bars Market in South America Volume (K Units) Forecast, by Application 2019 & 2032


                                                                    Frequently Asked Questions

                                                                    1. What is the projected Compound Annual Growth Rate (CAGR) of the Cereal Bars Market in South America?

                                                                    The projected CAGR is approximately 4.30%.

                                                                    2. Which companies are prominent players in the Cereal Bars Market in South America?

                                                                    Key companies in the market include The Kellogg Company, Nestle S A, General Mills Inc, PepsiCo Inc, Kind LLC*List Not Exhaustive, Clif Bar & Company, Mondelez International Inc.

                                                                    3. What are the main segments of the Cereal Bars Market in South America?

                                                                    The market segments include Production Analysis, Consumption Analysis, Import Market Analysis (Value & Volume), Export Market Analysis (Value & Volume), Price Trend Analysis.

                                                                    4. Can you provide details about the market size?

                                                                    The market size is estimated to be USD 10380 Million as of 2022.

                                                                    5. What are some drivers contributing to market growth?

                                                                    Popularity of Convenient Food Products; Expansion of Cold Chain Logistics.

                                                                    6. What are the notable trends driving market growth?

                                                                    Surge In The Consumption Of Healthy Food.

                                                                    7. Are there any restraints impacting market growth?

                                                                    Concerns Over Food Safety and Quality.

                                                                    8. Can you provide examples of recent developments in the market?

                                                                    N/A

                                                                    9. What pricing options are available for accessing the report?

                                                                    Pricing options include single-user, multi-user, and enterprise licenses priced at USD 4750, USD 4950, and USD 6800 respectively.

                                                                    10. Is the market size provided in terms of value or volume?

                                                                    The market size is provided in terms of value, measured in Million and volume, measured in K Units.

                                                                    11. Are there any specific market keywords associated with the report?

                                                                    Yes, the market keyword associated with the report is "Cereal Bars Market in South America," which aids in identifying and referencing the specific market segment covered.

                                                                    12. How do I determine which pricing option suits my needs best?

                                                                    The pricing options vary based on user requirements and access needs. Individual users may opt for single-user licenses, while businesses requiring broader access may choose multi-user or enterprise licenses for cost-effective access to the report.

                                                                    13. Are there any additional resources or data provided in the Cereal Bars Market in South America report?

                                                                    While the report offers comprehensive insights, it's advisable to review the specific contents or supplementary materials provided to ascertain if additional resources or data are available.

                                                                    14. How can I stay updated on further developments or reports in the Cereal Bars Market in South America?

                                                                    To stay informed about further developments, trends, and reports in the Cereal Bars Market in South America, consider subscribing to industry newsletters, following relevant companies and organizations, or regularly checking reputable industry news sources and publications.


                                                                    Methodology

                                                                    Step 1 - Identification of Relevant Samples Size from Population Database

                                                                    Step Chart
                                                                    Bar Chart
                                                                    Method Chart

                                                                    Step 2 - Approaches for Defining Global Market Size (Value, Volume* & Price*)

                                                                    Approach Chart
                                                                    Top-down and bottom-up approaches are used to validate the global market size and estimate the market size for manufactures, regional segments, product, and application.

                                                                    Note*: In applicable scenarios

                                                                    Step 3 - Data Sources

                                                                    Primary Research

                                                                    • Web Analytics
                                                                    • Survey Reports
                                                                    • Research Institute
                                                                    • Latest Research Reports
                                                                    • Opinion Leaders

                                                                    Secondary Research

                                                                    • Annual Reports
                                                                    • White Paper
                                                                    • Latest Press Release
                                                                    • Industry Association
                                                                    • Paid Database
                                                                    • Investor Presentations
                                                                    Analyst Chart

                                                                    Step 4 - Data Triangulation

                                                                    Involves using different sources of information in order to increase the validity of a study

                                                                    These sources are likely to be stakeholders in a program - participants, other researchers, program staff, other community members, and so on.

                                                                    Then we put all data in single framework & apply various statistical tools to find out the dynamic on the market.

                                                                    During the analysis stage, feedback from the stakeholder groups would be compared to determine areas of agreement as well as areas of divergence

                                                                    Additionally, after gathering mixed and scattered data from a wide range of sources, data is triangulated and correlated to come up with estimated figures which are further validated through primary mediums or industry experts, opinion leaders.

                                                                    About Visionary Data Reports

                                                                    Visionary Data Reports provides future-focused market research, advanced analytics, and strategic insights for technology, healthcare, green energy, and finance. Our reports help you anticipate trends, innovate, and lead in your industry. Our expert team combines primary research, data science, and industry knowledge to deliver actionable intelligence. We offer syndicated reports, custom analytics, and consulting services tailored to your business needs. At Visionary Data Reports, we are committed to quality, transparency, and client satisfaction. Every report is rigorously validated to ensure accuracy and relevance. Our global perspective and forward-thinking approach help you understand both current and emerging market dynamics.

                                                                    Stay ahead with Visionary Data Reports. Subscribe to our newsletter for the latest insights and research highlights, and follow us on social media for real-time updates. Visionary Data Reports – Your Guide to Tomorrow’s Opportunities.

                                                                    artwork spiralartwork spiralRelated Reports
                                                                    artwork underline

                                                                    Gluten Free Pasta Market: Growth Opportunities and Competitive Landscape Overview 2025-2033

                                                                    Discover the booming gluten-free pasta market! This comprehensive analysis reveals a CAGR of 9.78% driven by rising health consciousness and the increasing prevalence of celiac disease. Explore market size, key players (Barilla, Dr. Schar, Hain Celestial), regional trends, and future projections through 2033.

                                                                    July 2025
                                                                    Base Year: 2024
                                                                    No Of Pages: 234
                                                                    Price: $4750

                                                                    Argentina Food Additives Market XX CAGR Growth Outlook 2025-2033

                                                                    Discover the booming Argentina food additives market! This comprehensive analysis reveals key trends, growth drivers, and leading companies shaping the future of food processing in Argentina (2019-2033). Explore market size, CAGR, and segment-wise insights.

                                                                    July 2025
                                                                    Base Year: 2024
                                                                    No Of Pages: 197
                                                                    Price: $3800

                                                                    Strategic Trends in South America Meal Replacement Products Market Market 2025-2033

                                                                    Discover the booming South American meal replacement market! This comprehensive analysis reveals a $25.02 million market in 2025, projected to grow at a 6.11% CAGR through 2033. Explore key trends, leading companies (Herbalife, Glanbia), and regional insights for Brazil and Argentina. Learn about market segmentation by product type and distribution channel.

                                                                    July 2025
                                                                    Base Year: 2024
                                                                    No Of Pages: 234
                                                                    Price: $4750

                                                                    Strategic Planning for UK Chocolate Industry Industry Expansion

                                                                    Discover the booming UK chocolate market! Our in-depth analysis reveals key trends, growth drivers, and challenges impacting chocolate manufacturers, from premium dark chocolate to confectionery applications. Explore market size, segmentation, and top players in this lucrative sector.

                                                                    July 2025
                                                                    Base Year: 2024
                                                                    No Of Pages: 197
                                                                    Price: $3800

                                                                    United Kingdom Dairy Market Market Report: Strategic Insights

                                                                    Discover the latest insights into the thriving UK dairy market. This comprehensive analysis reveals key trends, growth drivers, and challenges impacting major players like Unilever and Arla Foods. Explore market segmentation, forecast data (2025-2033), and discover lucrative investment opportunities in this dynamic sector.

                                                                    July 2025
                                                                    Base Year: 2024
                                                                    No Of Pages: 180
                                                                    Price: $3800

                                                                    Australia Animal Protein Market Is Set To Reach XXX Million By 2033, Growing At A CAGR Of XX

                                                                    Discover the booming Australian animal protein market! This in-depth analysis reveals a CAGR of 4.01%, driven by health-conscious consumers and expanding applications across food, supplements, and cosmetics. Explore market size, key segments (whey, collagen, insect protein), leading companies, and future growth projections for 2025-2033.

                                                                    July 2025
                                                                    Base Year: 2024
                                                                    No Of Pages: 197
                                                                    Price: $3800

                                                                    Strategic Vision for South American Algae Protein Market Market Expansion

                                                                    Discover the booming South American algae protein market! This comprehensive analysis reveals key trends, drivers, and restraints for 2025-2033, including spirulina, chlorella, and regional market shares in Brazil, Argentina, and more. Learn about leading companies and unlock growth opportunities in this sustainable protein sector.

                                                                    July 2025
                                                                    Base Year: 2024
                                                                    No Of Pages: 234
                                                                    Price: $4750

                                                                    Strategic Vision for Egg Proteins Market Industry Trends

                                                                    Discover the booming egg proteins market! Explore key trends, drivers, and restraints shaping this $XX billion industry. Learn about the leading companies and regional growth projections (2025-2033) for whole egg powder, egg white powder, and egg yolk powder across bakery, meat, and dietary supplement sectors. Download our comprehensive market report today!

                                                                    July 2025
                                                                    Base Year: 2024
                                                                    No Of Pages: 234
                                                                    Price: $4750

                                                                    Lecithin Market Unlocking Growth Potential: 2025-2033 Analysis and Forecasts

                                                                    Discover the booming lecithin market! This comprehensive analysis reveals a $1.02B market in 2025, poised for 6.15% CAGR growth through 2033, driven by food & beverage, pharmaceuticals, and supplements. Explore key trends, regional insights, and leading companies shaping this dynamic sector.

                                                                    July 2025
                                                                    Base Year: 2024
                                                                    No Of Pages: 234
                                                                    Price: $4750

                                                                    Fruit & Vegetable Juice Market 2025-2033 Overview: Trends, Dynamics, and Growth Opportunities

                                                                    Discover the booming fruit & vegetable juice market! This comprehensive analysis reveals key trends, growth drivers, regional insights (North America, Europe, Asia-Pacific), and leading players (PepsiCo, Coca-Cola, Ocean Spray) shaping the $150 billion market through 2033. Learn about CAGR, market segmentation, and future opportunities.

                                                                    July 2025
                                                                    Base Year: 2024
                                                                    No Of Pages: 234
                                                                    Price: $4750

                                                                    Chlorella Market Soars to XXX Million, witnessing a CAGR of XX during the forecast period 2025-2033

                                                                    Discover the booming chlorella market! Explore its 10.25% CAGR, key drivers, regional trends (North America, Europe, Asia-Pacific), top players (Seagrass Tech, Parry Nutraceuticals, Roquette), and future projections to 2033. Invest in this lucrative health & wellness sector.

                                                                    July 2025
                                                                    Base Year: 2024
                                                                    No Of Pages: 234
                                                                    Price: $4750

                                                                    Asia-Pacific Pasta and Noodles Market Unlocking Growth Opportunities: Analysis and Forecast 2025-2033

                                                                    Discover the booming Asia-Pacific pasta and noodles market! This comprehensive analysis reveals key trends, growth drivers, and challenges, with forecasts to 2033, covering major players and regional breakdowns. Learn about market segmentation, CAGR, and future opportunities in this dynamic sector.

                                                                    July 2025
                                                                    Base Year: 2024
                                                                    No Of Pages: 234
                                                                    Price: $4750

                                                                    Exploring Innovations in Energy Drinks Market: Market Dynamics 2025-2033

                                                                    The global energy drink market is booming, projected to reach [estimated market size in 2033] by 2033, with a CAGR of 12.5%. Discover key market trends, driving forces, and the leading players shaping this dynamic industry. Explore segmentation by type (energy shots, organic, sugar-free), packaging, and distribution.

                                                                    July 2025
                                                                    Base Year: 2024
                                                                    No Of Pages: 197
                                                                    Price: $3800

                                                                    South America Soup Market Market’s Evolutionary Trends 2025-2033

                                                                    Discover the booming South American soup market! This comprehensive analysis reveals key trends, growth drivers, and challenges impacting canned, pouch, and other soup packaging formats across supermarkets, convenience stores, and online retail. Explore market size, CAGR, leading brands, and regional insights for Brazil, Argentina, and beyond – forecast to 2033.

                                                                    July 2025
                                                                    Base Year: 2024
                                                                    No Of Pages: 234
                                                                    Price: $4750

                                                                    Middle East and Africa Plant-based Meat Market Innovations Shaping Market Growth 2025-2033

                                                                    The Middle East & Africa plant-based meat market is booming, projected to reach $302.26M in 2025 with a 6.44% CAGR. Discover key trends, drivers, and leading companies shaping this rapidly growing sector. Explore market segmentation, regional analysis, and future forecasts for plant-based meat, dairy, and online retail channels.

                                                                    July 2025
                                                                    Base Year: 2024
                                                                    No Of Pages: 234
                                                                    Price: $4750

                                                                    South Africa Beverages Market Market Consumption Trends: Growth Analysis 2025-2033

                                                                    Discover the booming South African beverage market! This in-depth analysis reveals key trends, growth drivers (e.g., rising incomes, health & wellness), and major players (Coca-Cola, Red Bull, etc.) impacting the $XX million market from 2025-2033. Explore market segmentation, CAGR projections, and regional insights for strategic planning.

                                                                    July 2025
                                                                    Base Year: 2024
                                                                    No Of Pages: 197
                                                                    Price: $3800

                                                                    Challenges to Overcome in Japan Dairy Alternatives Market Market Growth: Analysis 2025-2033

                                                                    Discover the booming Japan dairy alternatives market! This comprehensive analysis reveals a CAGR of 5.35% and explores key drivers (health, sustainability), trends (product innovation), and restraints impacting non-dairy milk, cheese, and butter sales across Kanto, Kansai, and other regions. Learn about leading companies and future growth projections (2025-2033).

                                                                    July 2025
                                                                    Base Year: 2024
                                                                    No Of Pages: 197
                                                                    Price: $3800

                                                                    Flatbread Market Strategic Insights: Analysis 2025 and Forecasts 2033

                                                                    The global flatbread market is booming, projected to reach \$74 billion by 2033, driven by health trends and culinary versatility. Discover key market drivers, restraints, and leading companies shaping this \$43.78 billion (2025) industry. Explore regional market shares and future growth projections.

                                                                    July 2025
                                                                    Base Year: 2024
                                                                    No Of Pages: 234
                                                                    Price: $4750

                                                                    Exploring Key Dynamics of MEA Vegetable Oil Market Industry

                                                                    Discover the booming MEA vegetable oil market! This comprehensive analysis reveals a CAGR of 4.31% driven by population growth and changing diets. Explore market segmentation, key players (Wilmar, Cargill, ADM), and regional insights for UAE, Saudi Arabia, and South Africa. Invest wisely with our data-driven forecast to 2033.

                                                                    July 2025
                                                                    Base Year: 2024
                                                                    No Of Pages: 234
                                                                    Price: $4750

                                                                    Brazil Food Service Industry 2025-2033 Trends: Unveiling Growth Opportunities and Competitor Dynamics

                                                                    Discover the thriving Brazilian food service industry! Our in-depth analysis reveals a market size of $16.32B in 2025, projected to grow at a CAGR of 1.5% until 2033. Explore key drivers, trends, and challenges impacting major players like Grupo Madero and Domino's Pizza. Get insights into market segmentation and regional growth opportunities.

                                                                    July 2025
                                                                    Base Year: 2024
                                                                    No Of Pages: 180
                                                                    Price: $3800
                                                                    • Home
                                                                    • About Us
                                                                    • Industries
                                                                      • Aerospace & Defense
                                                                      • Agriculture
                                                                      • Animal Nutrition & Wellness
                                                                      • Automotive
                                                                      • Chemicals & Materials
                                                                      • Consumer Goods and Services
                                                                      • Energy & Power
                                                                      • Financial Services and Investment Intelligence
                                                                      • Food & Beverage
                                                                      • Home and Property Improvement
                                                                      • Hospitality and Tourism
                                                                      • Logistics
                                                                      • Manufacturing Products and Services
                                                                      • Packaging
                                                                      • Professional and Commercial Services
                                                                      • Real Estate and Construction
                                                                      • Retail
                                                                      • Technology, Media and Telecom
                                                                      • Healthcare
                                                                    • Services
                                                                    • Contact
                                                                    Main Logo
                                                                    • Home
                                                                    • About Us
                                                                    • Industries
                                                                      • Aerospace & Defense
                                                                      • Agriculture
                                                                      • Animal Nutrition & Wellness
                                                                      • Automotive
                                                                      • Chemicals & Materials
                                                                      • Consumer Goods and Services
                                                                      • Energy & Power
                                                                      • Financial Services and Investment Intelligence
                                                                      • Food & Beverage
                                                                      • Home and Property Improvement
                                                                      • Hospitality and Tourism
                                                                      • Logistics
                                                                      • Manufacturing Products and Services
                                                                      • Packaging
                                                                      • Professional and Commercial Services
                                                                      • Real Estate and Construction
                                                                      • Retail
                                                                      • Technology, Media and Telecom
                                                                      • Healthcare
                                                                    • Services
                                                                    • Contact
                                                                    +17162654855
                                                                    [email protected]

                                                                    +17162654855

                                                                    [email protected]

                                                                    Business Address

                                                                    Head Office

                                                                    Office no. A 5010, fifth floor, Solitaire Business Hub, Near Phoenix mall, Pune, Maharashtra 411014

                                                                    Contact Information

                                                                    Craig Francis

                                                                    Business Development Head

                                                                    +17162654855

                                                                    [email protected]

                                                                    Connect With Us

                                                                    Secure Payment Partners

                                                                    payment image
                                                                    RetailLogisticsPackagingAutomotiveHealthcareAgricultureEnergy & PowerFood & BeverageAerospace & DefenseChemicals & MaterialsHospitality and TourismAnimal Nutrition & WellnessConsumer Goods and ServicesReal Estate and ConstructionHome and Property ImprovementTechnology, Media and TelecomManufacturing Products and ServicesFinancial Services and Investment Intelligence

                                                                    © 2025 All rights reserved


                                                                    Privacy Policy
                                                                    Terms and Conditions
                                                                    FAQ