
Key Insights
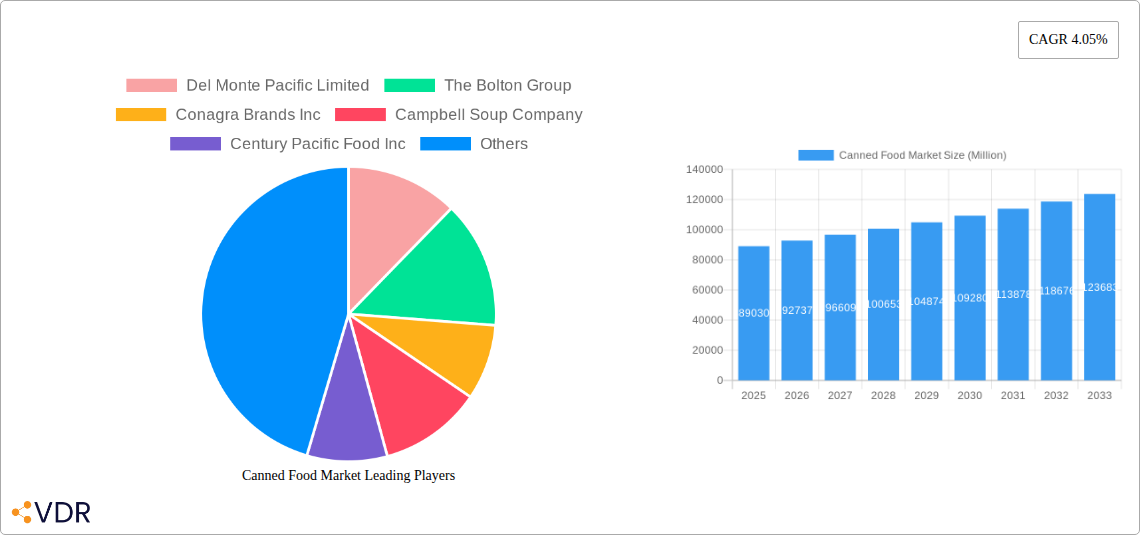
The global canned food market, valued at $89.03 billion in 2025, is projected to experience steady growth, exhibiting a Compound Annual Growth Rate (CAGR) of 4.05% from 2025 to 2033. This growth is driven by several key factors. Firstly, the increasing demand for convenient and shelf-stable food products, particularly among busy consumers and singles, fuels market expansion. Secondly, advancements in canning technology, leading to improved product quality and extended shelf life, contribute significantly. Furthermore, the rising popularity of canned goods in developing economies, where they offer an affordable and nutritious food source, is a major driver. The canned food market's segmentation reveals varied performance across product types. Canned vegetables and fruits are expected to maintain strong growth, driven by health-conscious consumers seeking convenient options rich in vitamins and minerals. Conversely, canned meat products, while a significant segment, may see slower growth due to rising concerns about sodium content and processed meat consumption. Distribution channels also impact market dynamics, with supermarkets/hypermarkets dominating, while online retail channels demonstrate promising growth potential, reflecting changing consumer purchasing habits. Competitive landscape analysis indicates that established players like Del Monte, Conagra Brands, and Campbell Soup Company maintain significant market share through established brand recognition and distribution networks. However, emerging regional players are increasingly challenging the dominance of multinational corporations.
Geographic distribution shows North America and Europe as mature markets, with growth largely driven by product innovation and premiumization. In contrast, Asia Pacific and South America exhibit higher growth rates, fuelled by expanding middle classes and rising disposable incomes. This necessitates customized marketing strategies targeting regional preferences and dietary habits. Factors restraining market growth include fluctuating raw material prices and increased competition from fresh and frozen food alternatives. However, the industry's ongoing efforts in developing sustainable packaging and reducing its environmental impact contribute to mitigating these restraints. Overall, the canned food market presents a resilient and expanding landscape offering promising investment opportunities for players who can adapt to evolving consumer preferences and technological advancements.
Canned Food Market: A Comprehensive Report (2019-2033)
This in-depth report provides a comprehensive analysis of the Canned Food Market, encompassing market dynamics, growth trends, regional analysis, competitive landscape, and future outlook. The study period covers 2019-2033, with 2025 as the base year and forecast period extending to 2033. The report utilizes a robust methodology, incorporating both qualitative and quantitative data to provide actionable insights for industry professionals, investors, and stakeholders. The market is segmented by type (Canned Meat Products, Canned Fish/Seafood, Canned Vegetables, Canned Fruits, Other Types) and distribution channel (Supermarkets/Hypermarkets, Convenience/Grocery Stores, Online Retail Stores, Other Distribution Channels). Key players analyzed include Del Monte Pacific Limited, The Bolton Group, Conagra Brands Inc, Campbell Soup Company, Century Pacific Food Inc, Thai Union Group PCL, Dole Holding Company LLC, JBS S A (SAMPCO), Bonduelle SA, and Kraft Heinz Company. The market size is presented in million units.
Canned Food Market Dynamics & Structure
The canned food market is characterized by a moderately concentrated structure, with several large multinational companies holding significant market share. Technological innovations, such as improved packaging materials and enhanced preservation techniques, are driving market growth. Stringent regulatory frameworks concerning food safety and labeling influence market dynamics. Competitive pressure from fresh and frozen food substitutes exists, impacting market penetration. End-user demographics, particularly changing consumer preferences towards healthier and convenient options, shape demand. The market has witnessed a notable number of M&A activities in recent years, xx million deals recorded between 2019 and 2024, aiming to expand product portfolios and geographic reach.
- Market Concentration: Moderately concentrated, with top 10 players holding approximately xx% market share in 2024.
- Technological Innovation: Focus on extended shelf life, sustainable packaging, and innovative product formulations.
- Regulatory Framework: Stringent food safety regulations and labeling requirements impacting production costs and market access.
- Competitive Substitutes: Fresh produce, frozen foods, and ready-to-eat meals pose significant competition.
- End-User Demographics: Growing demand for convenient, healthy, and ethically sourced canned food products.
- M&A Trends: Significant increase in M&A activity, primarily driven by expansion strategies and portfolio diversification. xx million deals predicted for 2025-2033.
Canned Food Market Growth Trends & Insights
The global canned food market experienced substantial growth during the historical period (2019-2024), exhibiting a CAGR of xx%. This growth is attributed to several factors including increasing urbanization, rising disposable incomes, and the growing popularity of convenient food options. Technological disruptions, such as advanced packaging technologies and improved preservation methods, have enhanced product quality and extended shelf life. Shifting consumer behavior towards health-conscious choices is driving demand for low-sodium, organic, and sustainably sourced canned foods. Market penetration is projected to reach xx% by 2033, driven by the increasing adoption of canned food across emerging markets. The forecast period (2025-2033) anticipates a CAGR of xx%, driven by continued consumer demand and product innovation. Factors such as fluctuating raw material prices and changing consumer preferences will however significantly impact growth in specific segments.

Dominant Regions, Countries, or Segments in Canned Food Market
The North American region currently dominates the canned food market, holding the largest market share in 2024, owing to high consumption rates and established distribution networks. Within product segments, Canned Vegetables and Canned Fruits exhibit the highest market share, reflecting strong consumer preferences for these categories. Supermarkets/Hypermarkets represent the leading distribution channel, driven by their wide reach and strong brand presence.
- Leading Region: North America (xx% market share in 2024).
- Dominant Segment (Type): Canned Vegetables and Canned Fruits.
- Primary Distribution Channel: Supermarkets/Hypermarkets.
- Key Drivers: High consumer spending, robust retail infrastructure, established distribution networks.
- Growth Potential: Emerging markets in Asia and Africa offer significant growth opportunities due to rising urbanization and increasing disposable incomes.
Canned Food Market Product Landscape
The canned food market showcases continuous product innovation, encompassing new flavor profiles, organic options, and functional ingredients (e.g., added vitamins, minerals). Focus remains on improving product quality, shelf life, and packaging sustainability. Unique selling propositions (USPs) frequently highlight convenience, affordability, and long shelf-life. Technological advancements in preservation methods (e.g., high-pressure processing) are enhancing product safety and quality while reducing reliance on chemical preservatives.
Key Drivers, Barriers & Challenges in Canned Food Market
Key Drivers: Growing urbanization and rising disposable incomes are boosting demand. Technological advancements are improving product quality and extending shelf life. Government initiatives promoting food security and nutritional awareness drive consumption.
Key Challenges: Fluctuating raw material prices impact production costs. Stringent food safety regulations increase compliance burdens. Intense competition from fresh and frozen food alternatives exerts pressure on market share. Supply chain disruptions can significantly affect product availability and lead to price volatility.
Emerging Opportunities in Canned Food Market
Emerging opportunities lie in expanding into untapped markets, especially in developing economies. The increasing demand for convenient, healthy, and sustainable food options presents a significant opportunity for innovation. Developing functional canned foods with added health benefits or catering to specific dietary needs (vegetarian, vegan) offers high growth potential. E-commerce platforms represent a significant opportunity for expanding distribution channels.
Growth Accelerators in the Canned Food Market Industry
Technological breakthroughs in preservation and packaging are pivotal growth accelerators. Strategic partnerships between food producers and retailers enhance distribution efficiency and market reach. Market expansion into emerging markets with burgeoning middle classes offers substantial growth potential. Initiatives promoting sustainable and ethical sourcing further bolster market growth.
Key Players Shaping the Canned Food Market Market
- Del Monte Pacific Limited
- The Bolton Group
- Conagra Brands Inc
- Campbell Soup Company
- Century Pacific Food Inc
- Thai Union Group PCL
- Dole Holding Company LLC
- JBS S A (SAMPCO)
- Bonduelle SA
- Kraft Heinz Company
Notable Milestones in Canned Food Market Sector
- October 2022: Campbell Soup Company launches four new spicy Chunky Soup flavors.
- September 2022: Campbell's Pacific Foods introduces 14 new organic ready-to-serve soups and plant-based chills.
- August 2021: The Bolton Group acquires Wild Planet Foods.
In-Depth Canned Food Market Market Outlook
The canned food market is poised for sustained growth in the coming years, driven by robust consumer demand and ongoing product innovation. Strategic partnerships, focused on enhancing supply chain efficiency and expanding distribution networks, will further enhance market penetration. Opportunities abound in exploring emerging markets and developing value-added, health-conscious products that cater to evolving consumer preferences. The market's future trajectory will be shaped by technological breakthroughs, changing consumer behavior, and the evolving regulatory landscape.
Canned Food Market Segmentation
-
1. Type
- 1.1. Canned Meat Products
- 1.2. Canned Fish/Seafood
- 1.3. Canned Vegetables
- 1.4. Canned Fruits
- 1.5. Other Types
-
2. Distribution Channel
- 2.1. Supermarkets/Hypermarkets
- 2.2. Convenience/Grocery Stores
- 2.3. Online Retail Stores
- 2.4. Other Distribution Channels
Canned Food Market Segmentation By Geography
-
1. North America
- 1.1. United States
- 1.2. Canada
- 1.3. Mexico
- 1.4. Rest of North America
-
2. Europe
- 2.1. Spain
- 2.2. United Kingdom
- 2.3. Germany
- 2.4. France
- 2.5. Italy
- 2.6. Netherlands
- 2.7. Rest of Europe
-
3. Asia Pacific
- 3.1. China
- 3.2. Japan
- 3.3. India
- 3.4. Australia
- 3.5. Rest of Asia Pacific
-
4. South America
- 4.1. Brazil
- 4.2. Argentina
- 4.3. Rest of South America
-
5. Middle East and Africa
- 5.1. South Africa
- 5.2. Saudi Arabia
- 5.3. Rest of Middle East and Africa

Canned Food Market REPORT HIGHLIGHTS
| Aspects | Details |
|---|---|
| Study Period | 2019-2033 |
| Base Year | 2024 |
| Estimated Year | 2025 |
| Forecast Period | 2025-2033 |
| Historical Period | 2019-2024 |
| Growth Rate | CAGR of 4.05% from 2019-2033 |
| Segmentation |
|
Table of Contents
- 1. Introduction
- 1.1. Research Scope
- 1.2. Market Segmentation
- 1.3. Research Methodology
- 1.4. Definitions and Assumptions
- 2. Executive Summary
- 2.1. Introduction
- 3. Market Dynamics
- 3.1. Introduction
- 3.2. Market Drivers
- 3.2.1. Increasing urbanization and globalization contribute to changing dietary habits and a greater demand for convenient food options
- 3.3. Market Restrains
- 3.3.1. Shelf Life Limitations and Changing Consumer Preferences
- 3.4. Market Trends
- 3.4.1. Increasing variety of canned foods including gourmet and premium options
- 4. Market Factor Analysis
- 4.1. Porters Five Forces
- 4.2. Supply/Value Chain
- 4.3. PESTEL analysis
- 4.4. Market Entropy
- 4.5. Patent/Trademark Analysis
- 5. Global Canned Food Market Analysis, Insights and Forecast, 2019-2031
- 5.1. Market Analysis, Insights and Forecast - by Type
- 5.1.1. Canned Meat Products
- 5.1.2. Canned Fish/Seafood
- 5.1.3. Canned Vegetables
- 5.1.4. Canned Fruits
- 5.1.5. Other Types
- 5.2. Market Analysis, Insights and Forecast - by Distribution Channel
- 5.2.1. Supermarkets/Hypermarkets
- 5.2.2. Convenience/Grocery Stores
- 5.2.3. Online Retail Stores
- 5.2.4. Other Distribution Channels
- 5.3. Market Analysis, Insights and Forecast - by Region
- 5.3.1. North America
- 5.3.2. Europe
- 5.3.3. Asia Pacific
- 5.3.4. South America
- 5.3.5. Middle East and Africa
- 5.1. Market Analysis, Insights and Forecast - by Type
- 6. North America Canned Food Market Analysis, Insights and Forecast, 2019-2031
- 6.1. Market Analysis, Insights and Forecast - by Type
- 6.1.1. Canned Meat Products
- 6.1.2. Canned Fish/Seafood
- 6.1.3. Canned Vegetables
- 6.1.4. Canned Fruits
- 6.1.5. Other Types
- 6.2. Market Analysis, Insights and Forecast - by Distribution Channel
- 6.2.1. Supermarkets/Hypermarkets
- 6.2.2. Convenience/Grocery Stores
- 6.2.3. Online Retail Stores
- 6.2.4. Other Distribution Channels
- 6.1. Market Analysis, Insights and Forecast - by Type
- 7. Europe Canned Food Market Analysis, Insights and Forecast, 2019-2031
- 7.1. Market Analysis, Insights and Forecast - by Type
- 7.1.1. Canned Meat Products
- 7.1.2. Canned Fish/Seafood
- 7.1.3. Canned Vegetables
- 7.1.4. Canned Fruits
- 7.1.5. Other Types
- 7.2. Market Analysis, Insights and Forecast - by Distribution Channel
- 7.2.1. Supermarkets/Hypermarkets
- 7.2.2. Convenience/Grocery Stores
- 7.2.3. Online Retail Stores
- 7.2.4. Other Distribution Channels
- 7.1. Market Analysis, Insights and Forecast - by Type
- 8. Asia Pacific Canned Food Market Analysis, Insights and Forecast, 2019-2031
- 8.1. Market Analysis, Insights and Forecast - by Type
- 8.1.1. Canned Meat Products
- 8.1.2. Canned Fish/Seafood
- 8.1.3. Canned Vegetables
- 8.1.4. Canned Fruits
- 8.1.5. Other Types
- 8.2. Market Analysis, Insights and Forecast - by Distribution Channel
- 8.2.1. Supermarkets/Hypermarkets
- 8.2.2. Convenience/Grocery Stores
- 8.2.3. Online Retail Stores
- 8.2.4. Other Distribution Channels
- 8.1. Market Analysis, Insights and Forecast - by Type
- 9. South America Canned Food Market Analysis, Insights and Forecast, 2019-2031
- 9.1. Market Analysis, Insights and Forecast - by Type
- 9.1.1. Canned Meat Products
- 9.1.2. Canned Fish/Seafood
- 9.1.3. Canned Vegetables
- 9.1.4. Canned Fruits
- 9.1.5. Other Types
- 9.2. Market Analysis, Insights and Forecast - by Distribution Channel
- 9.2.1. Supermarkets/Hypermarkets
- 9.2.2. Convenience/Grocery Stores
- 9.2.3. Online Retail Stores
- 9.2.4. Other Distribution Channels
- 9.1. Market Analysis, Insights and Forecast - by Type
- 10. Middle East and Africa Canned Food Market Analysis, Insights and Forecast, 2019-2031
- 10.1. Market Analysis, Insights and Forecast - by Type
- 10.1.1. Canned Meat Products
- 10.1.2. Canned Fish/Seafood
- 10.1.3. Canned Vegetables
- 10.1.4. Canned Fruits
- 10.1.5. Other Types
- 10.2. Market Analysis, Insights and Forecast - by Distribution Channel
- 10.2.1. Supermarkets/Hypermarkets
- 10.2.2. Convenience/Grocery Stores
- 10.2.3. Online Retail Stores
- 10.2.4. Other Distribution Channels
- 10.1. Market Analysis, Insights and Forecast - by Type
- 11. North America Canned Food Market Analysis, Insights and Forecast, 2019-2031
- 11.1. Market Analysis, Insights and Forecast - By Country/Sub-region
- 11.1.1 United States
- 11.1.2 Canada
- 11.1.3 Mexico
- 11.1.4 Rest of North America
- 12. Europe Canned Food Market Analysis, Insights and Forecast, 2019-2031
- 12.1. Market Analysis, Insights and Forecast - By Country/Sub-region
- 12.1.1 Spain
- 12.1.2 United Kingdom
- 12.1.3 Germany
- 12.1.4 France
- 12.1.5 Italy
- 12.1.6 Russia
- 12.1.7 Rest of Europe
- 13. Asia Pacific Canned Food Market Analysis, Insights and Forecast, 2019-2031
- 13.1. Market Analysis, Insights and Forecast - By Country/Sub-region
- 13.1.1 China
- 13.1.2 Japan
- 13.1.3 India
- 13.1.4 Australia
- 13.1.5 Rest of Asia Pacific
- 14. South America Canned Food Market Analysis, Insights and Forecast, 2019-2031
- 14.1. Market Analysis, Insights and Forecast - By Country/Sub-region
- 14.1.1 Brazil
- 14.1.2 Argentina
- 14.1.3 Rest of South America
- 15. Middle East and Africa Canned Food Market Analysis, Insights and Forecast, 2019-2031
- 15.1. Market Analysis, Insights and Forecast - By Country/Sub-region
- 15.1.1 South Africa
- 15.1.2 Saudi Arabia
- 15.1.3 Rest of Middle East and Africa
- 16. Competitive Analysis
- 16.1. Global Market Share Analysis 2024
- 16.2. Company Profiles
- 16.2.1 Del Monte Pacific Limited
- 16.2.1.1. Overview
- 16.2.1.2. Products
- 16.2.1.3. SWOT Analysis
- 16.2.1.4. Recent Developments
- 16.2.1.5. Financials (Based on Availability)
- 16.2.2 The Bolton Group
- 16.2.2.1. Overview
- 16.2.2.2. Products
- 16.2.2.3. SWOT Analysis
- 16.2.2.4. Recent Developments
- 16.2.2.5. Financials (Based on Availability)
- 16.2.3 Conagra Brands Inc
- 16.2.3.1. Overview
- 16.2.3.2. Products
- 16.2.3.3. SWOT Analysis
- 16.2.3.4. Recent Developments
- 16.2.3.5. Financials (Based on Availability)
- 16.2.4 Campbell Soup Company
- 16.2.4.1. Overview
- 16.2.4.2. Products
- 16.2.4.3. SWOT Analysis
- 16.2.4.4. Recent Developments
- 16.2.4.5. Financials (Based on Availability)
- 16.2.5 Century Pacific Food Inc
- 16.2.5.1. Overview
- 16.2.5.2. Products
- 16.2.5.3. SWOT Analysis
- 16.2.5.4. Recent Developments
- 16.2.5.5. Financials (Based on Availability)
- 16.2.6 Thai Union Group PCL
- 16.2.6.1. Overview
- 16.2.6.2. Products
- 16.2.6.3. SWOT Analysis
- 16.2.6.4. Recent Developments
- 16.2.6.5. Financials (Based on Availability)
- 16.2.7 Dole Holding Company LLC
- 16.2.7.1. Overview
- 16.2.7.2. Products
- 16.2.7.3. SWOT Analysis
- 16.2.7.4. Recent Developments
- 16.2.7.5. Financials (Based on Availability)
- 16.2.8 JBS S A (SAMPCO)
- 16.2.8.1. Overview
- 16.2.8.2. Products
- 16.2.8.3. SWOT Analysis
- 16.2.8.4. Recent Developments
- 16.2.8.5. Financials (Based on Availability)
- 16.2.9 Bonduelle SA
- 16.2.9.1. Overview
- 16.2.9.2. Products
- 16.2.9.3. SWOT Analysis
- 16.2.9.4. Recent Developments
- 16.2.9.5. Financials (Based on Availability)
- 16.2.10 Kraft Heinz Company
- 16.2.10.1. Overview
- 16.2.10.2. Products
- 16.2.10.3. SWOT Analysis
- 16.2.10.4. Recent Developments
- 16.2.10.5. Financials (Based on Availability)
- 16.2.1 Del Monte Pacific Limited
List of Figures
- Figure 1: Global Canned Food Market Revenue Breakdown (Million, %) by Region 2024 & 2032
- Figure 2: Global Canned Food Market Volume Breakdown (K Tons, %) by Region 2024 & 2032
- Figure 3: North America Canned Food Market Revenue (Million), by Country 2024 & 2032
- Figure 4: North America Canned Food Market Volume (K Tons), by Country 2024 & 2032
- Figure 5: North America Canned Food Market Revenue Share (%), by Country 2024 & 2032
- Figure 6: North America Canned Food Market Volume Share (%), by Country 2024 & 2032
- Figure 7: Europe Canned Food Market Revenue (Million), by Country 2024 & 2032
- Figure 8: Europe Canned Food Market Volume (K Tons), by Country 2024 & 2032
- Figure 9: Europe Canned Food Market Revenue Share (%), by Country 2024 & 2032
- Figure 10: Europe Canned Food Market Volume Share (%), by Country 2024 & 2032
- Figure 11: Asia Pacific Canned Food Market Revenue (Million), by Country 2024 & 2032
- Figure 12: Asia Pacific Canned Food Market Volume (K Tons), by Country 2024 & 2032
- Figure 13: Asia Pacific Canned Food Market Revenue Share (%), by Country 2024 & 2032
- Figure 14: Asia Pacific Canned Food Market Volume Share (%), by Country 2024 & 2032
- Figure 15: South America Canned Food Market Revenue (Million), by Country 2024 & 2032
- Figure 16: South America Canned Food Market Volume (K Tons), by Country 2024 & 2032
- Figure 17: South America Canned Food Market Revenue Share (%), by Country 2024 & 2032
- Figure 18: South America Canned Food Market Volume Share (%), by Country 2024 & 2032
- Figure 19: Middle East and Africa Canned Food Market Revenue (Million), by Country 2024 & 2032
- Figure 20: Middle East and Africa Canned Food Market Volume (K Tons), by Country 2024 & 2032
- Figure 21: Middle East and Africa Canned Food Market Revenue Share (%), by Country 2024 & 2032
- Figure 22: Middle East and Africa Canned Food Market Volume Share (%), by Country 2024 & 2032
- Figure 23: North America Canned Food Market Revenue (Million), by Type 2024 & 2032
- Figure 24: North America Canned Food Market Volume (K Tons), by Type 2024 & 2032
- Figure 25: North America Canned Food Market Revenue Share (%), by Type 2024 & 2032
- Figure 26: North America Canned Food Market Volume Share (%), by Type 2024 & 2032
- Figure 27: North America Canned Food Market Revenue (Million), by Distribution Channel 2024 & 2032
- Figure 28: North America Canned Food Market Volume (K Tons), by Distribution Channel 2024 & 2032
- Figure 29: North America Canned Food Market Revenue Share (%), by Distribution Channel 2024 & 2032
- Figure 30: North America Canned Food Market Volume Share (%), by Distribution Channel 2024 & 2032
- Figure 31: North America Canned Food Market Revenue (Million), by Country 2024 & 2032
- Figure 32: North America Canned Food Market Volume (K Tons), by Country 2024 & 2032
- Figure 33: North America Canned Food Market Revenue Share (%), by Country 2024 & 2032
- Figure 34: North America Canned Food Market Volume Share (%), by Country 2024 & 2032
- Figure 35: Europe Canned Food Market Revenue (Million), by Type 2024 & 2032
- Figure 36: Europe Canned Food Market Volume (K Tons), by Type 2024 & 2032
- Figure 37: Europe Canned Food Market Revenue Share (%), by Type 2024 & 2032
- Figure 38: Europe Canned Food Market Volume Share (%), by Type 2024 & 2032
- Figure 39: Europe Canned Food Market Revenue (Million), by Distribution Channel 2024 & 2032
- Figure 40: Europe Canned Food Market Volume (K Tons), by Distribution Channel 2024 & 2032
- Figure 41: Europe Canned Food Market Revenue Share (%), by Distribution Channel 2024 & 2032
- Figure 42: Europe Canned Food Market Volume Share (%), by Distribution Channel 2024 & 2032
- Figure 43: Europe Canned Food Market Revenue (Million), by Country 2024 & 2032
- Figure 44: Europe Canned Food Market Volume (K Tons), by Country 2024 & 2032
- Figure 45: Europe Canned Food Market Revenue Share (%), by Country 2024 & 2032
- Figure 46: Europe Canned Food Market Volume Share (%), by Country 2024 & 2032
- Figure 47: Asia Pacific Canned Food Market Revenue (Million), by Type 2024 & 2032
- Figure 48: Asia Pacific Canned Food Market Volume (K Tons), by Type 2024 & 2032
- Figure 49: Asia Pacific Canned Food Market Revenue Share (%), by Type 2024 & 2032
- Figure 50: Asia Pacific Canned Food Market Volume Share (%), by Type 2024 & 2032
- Figure 51: Asia Pacific Canned Food Market Revenue (Million), by Distribution Channel 2024 & 2032
- Figure 52: Asia Pacific Canned Food Market Volume (K Tons), by Distribution Channel 2024 & 2032
- Figure 53: Asia Pacific Canned Food Market Revenue Share (%), by Distribution Channel 2024 & 2032
- Figure 54: Asia Pacific Canned Food Market Volume Share (%), by Distribution Channel 2024 & 2032
- Figure 55: Asia Pacific Canned Food Market Revenue (Million), by Country 2024 & 2032
- Figure 56: Asia Pacific Canned Food Market Volume (K Tons), by Country 2024 & 2032
- Figure 57: Asia Pacific Canned Food Market Revenue Share (%), by Country 2024 & 2032
- Figure 58: Asia Pacific Canned Food Market Volume Share (%), by Country 2024 & 2032
- Figure 59: South America Canned Food Market Revenue (Million), by Type 2024 & 2032
- Figure 60: South America Canned Food Market Volume (K Tons), by Type 2024 & 2032
- Figure 61: South America Canned Food Market Revenue Share (%), by Type 2024 & 2032
- Figure 62: South America Canned Food Market Volume Share (%), by Type 2024 & 2032
- Figure 63: South America Canned Food Market Revenue (Million), by Distribution Channel 2024 & 2032
- Figure 64: South America Canned Food Market Volume (K Tons), by Distribution Channel 2024 & 2032
- Figure 65: South America Canned Food Market Revenue Share (%), by Distribution Channel 2024 & 2032
- Figure 66: South America Canned Food Market Volume Share (%), by Distribution Channel 2024 & 2032
- Figure 67: South America Canned Food Market Revenue (Million), by Country 2024 & 2032
- Figure 68: South America Canned Food Market Volume (K Tons), by Country 2024 & 2032
- Figure 69: South America Canned Food Market Revenue Share (%), by Country 2024 & 2032
- Figure 70: South America Canned Food Market Volume Share (%), by Country 2024 & 2032
- Figure 71: Middle East and Africa Canned Food Market Revenue (Million), by Type 2024 & 2032
- Figure 72: Middle East and Africa Canned Food Market Volume (K Tons), by Type 2024 & 2032
- Figure 73: Middle East and Africa Canned Food Market Revenue Share (%), by Type 2024 & 2032
- Figure 74: Middle East and Africa Canned Food Market Volume Share (%), by Type 2024 & 2032
- Figure 75: Middle East and Africa Canned Food Market Revenue (Million), by Distribution Channel 2024 & 2032
- Figure 76: Middle East and Africa Canned Food Market Volume (K Tons), by Distribution Channel 2024 & 2032
- Figure 77: Middle East and Africa Canned Food Market Revenue Share (%), by Distribution Channel 2024 & 2032
- Figure 78: Middle East and Africa Canned Food Market Volume Share (%), by Distribution Channel 2024 & 2032
- Figure 79: Middle East and Africa Canned Food Market Revenue (Million), by Country 2024 & 2032
- Figure 80: Middle East and Africa Canned Food Market Volume (K Tons), by Country 2024 & 2032
- Figure 81: Middle East and Africa Canned Food Market Revenue Share (%), by Country 2024 & 2032
- Figure 82: Middle East and Africa Canned Food Market Volume Share (%), by Country 2024 & 2032
List of Tables
- Table 1: Global Canned Food Market Revenue Million Forecast, by Region 2019 & 2032
- Table 2: Global Canned Food Market Volume K Tons Forecast, by Region 2019 & 2032
- Table 3: Global Canned Food Market Revenue Million Forecast, by Type 2019 & 2032
- Table 4: Global Canned Food Market Volume K Tons Forecast, by Type 2019 & 2032
- Table 5: Global Canned Food Market Revenue Million Forecast, by Distribution Channel 2019 & 2032
- Table 6: Global Canned Food Market Volume K Tons Forecast, by Distribution Channel 2019 & 2032
- Table 7: Global Canned Food Market Revenue Million Forecast, by Region 2019 & 2032
- Table 8: Global Canned Food Market Volume K Tons Forecast, by Region 2019 & 2032
- Table 9: Global Canned Food Market Revenue Million Forecast, by Country 2019 & 2032
- Table 10: Global Canned Food Market Volume K Tons Forecast, by Country 2019 & 2032
- Table 11: United States Canned Food Market Revenue (Million) Forecast, by Application 2019 & 2032
- Table 12: United States Canned Food Market Volume (K Tons) Forecast, by Application 2019 & 2032
- Table 13: Canada Canned Food Market Revenue (Million) Forecast, by Application 2019 & 2032
- Table 14: Canada Canned Food Market Volume (K Tons) Forecast, by Application 2019 & 2032
- Table 15: Mexico Canned Food Market Revenue (Million) Forecast, by Application 2019 & 2032
- Table 16: Mexico Canned Food Market Volume (K Tons) Forecast, by Application 2019 & 2032
- Table 17: Rest of North America Canned Food Market Revenue (Million) Forecast, by Application 2019 & 2032
- Table 18: Rest of North America Canned Food Market Volume (K Tons) Forecast, by Application 2019 & 2032
- Table 19: Global Canned Food Market Revenue Million Forecast, by Country 2019 & 2032
- Table 20: Global Canned Food Market Volume K Tons Forecast, by Country 2019 & 2032
- Table 21: Spain Canned Food Market Revenue (Million) Forecast, by Application 2019 & 2032
- Table 22: Spain Canned Food Market Volume (K Tons) Forecast, by Application 2019 & 2032
- Table 23: United Kingdom Canned Food Market Revenue (Million) Forecast, by Application 2019 & 2032
- Table 24: United Kingdom Canned Food Market Volume (K Tons) Forecast, by Application 2019 & 2032
- Table 25: Germany Canned Food Market Revenue (Million) Forecast, by Application 2019 & 2032
- Table 26: Germany Canned Food Market Volume (K Tons) Forecast, by Application 2019 & 2032
- Table 27: France Canned Food Market Revenue (Million) Forecast, by Application 2019 & 2032
- Table 28: France Canned Food Market Volume (K Tons) Forecast, by Application 2019 & 2032
- Table 29: Italy Canned Food Market Revenue (Million) Forecast, by Application 2019 & 2032
- Table 30: Italy Canned Food Market Volume (K Tons) Forecast, by Application 2019 & 2032
- Table 31: Russia Canned Food Market Revenue (Million) Forecast, by Application 2019 & 2032
- Table 32: Russia Canned Food Market Volume (K Tons) Forecast, by Application 2019 & 2032
- Table 33: Rest of Europe Canned Food Market Revenue (Million) Forecast, by Application 2019 & 2032
- Table 34: Rest of Europe Canned Food Market Volume (K Tons) Forecast, by Application 2019 & 2032
- Table 35: Global Canned Food Market Revenue Million Forecast, by Country 2019 & 2032
- Table 36: Global Canned Food Market Volume K Tons Forecast, by Country 2019 & 2032
- Table 37: China Canned Food Market Revenue (Million) Forecast, by Application 2019 & 2032
- Table 38: China Canned Food Market Volume (K Tons) Forecast, by Application 2019 & 2032
- Table 39: Japan Canned Food Market Revenue (Million) Forecast, by Application 2019 & 2032
- Table 40: Japan Canned Food Market Volume (K Tons) Forecast, by Application 2019 & 2032
- Table 41: India Canned Food Market Revenue (Million) Forecast, by Application 2019 & 2032
- Table 42: India Canned Food Market Volume (K Tons) Forecast, by Application 2019 & 2032
- Table 43: Australia Canned Food Market Revenue (Million) Forecast, by Application 2019 & 2032
- Table 44: Australia Canned Food Market Volume (K Tons) Forecast, by Application 2019 & 2032
- Table 45: Rest of Asia Pacific Canned Food Market Revenue (Million) Forecast, by Application 2019 & 2032
- Table 46: Rest of Asia Pacific Canned Food Market Volume (K Tons) Forecast, by Application 2019 & 2032
- Table 47: Global Canned Food Market Revenue Million Forecast, by Country 2019 & 2032
- Table 48: Global Canned Food Market Volume K Tons Forecast, by Country 2019 & 2032
- Table 49: Brazil Canned Food Market Revenue (Million) Forecast, by Application 2019 & 2032
- Table 50: Brazil Canned Food Market Volume (K Tons) Forecast, by Application 2019 & 2032
- Table 51: Argentina Canned Food Market Revenue (Million) Forecast, by Application 2019 & 2032
- Table 52: Argentina Canned Food Market Volume (K Tons) Forecast, by Application 2019 & 2032
- Table 53: Rest of South America Canned Food Market Revenue (Million) Forecast, by Application 2019 & 2032
- Table 54: Rest of South America Canned Food Market Volume (K Tons) Forecast, by Application 2019 & 2032
- Table 55: Global Canned Food Market Revenue Million Forecast, by Country 2019 & 2032
- Table 56: Global Canned Food Market Volume K Tons Forecast, by Country 2019 & 2032
- Table 57: South Africa Canned Food Market Revenue (Million) Forecast, by Application 2019 & 2032
- Table 58: South Africa Canned Food Market Volume (K Tons) Forecast, by Application 2019 & 2032
- Table 59: Saudi Arabia Canned Food Market Revenue (Million) Forecast, by Application 2019 & 2032
- Table 60: Saudi Arabia Canned Food Market Volume (K Tons) Forecast, by Application 2019 & 2032
- Table 61: Rest of Middle East and Africa Canned Food Market Revenue (Million) Forecast, by Application 2019 & 2032
- Table 62: Rest of Middle East and Africa Canned Food Market Volume (K Tons) Forecast, by Application 2019 & 2032
- Table 63: Global Canned Food Market Revenue Million Forecast, by Type 2019 & 2032
- Table 64: Global Canned Food Market Volume K Tons Forecast, by Type 2019 & 2032
- Table 65: Global Canned Food Market Revenue Million Forecast, by Distribution Channel 2019 & 2032
- Table 66: Global Canned Food Market Volume K Tons Forecast, by Distribution Channel 2019 & 2032
- Table 67: Global Canned Food Market Revenue Million Forecast, by Country 2019 & 2032
- Table 68: Global Canned Food Market Volume K Tons Forecast, by Country 2019 & 2032
- Table 69: United States Canned Food Market Revenue (Million) Forecast, by Application 2019 & 2032
- Table 70: United States Canned Food Market Volume (K Tons) Forecast, by Application 2019 & 2032
- Table 71: Canada Canned Food Market Revenue (Million) Forecast, by Application 2019 & 2032
- Table 72: Canada Canned Food Market Volume (K Tons) Forecast, by Application 2019 & 2032
- Table 73: Mexico Canned Food Market Revenue (Million) Forecast, by Application 2019 & 2032
- Table 74: Mexico Canned Food Market Volume (K Tons) Forecast, by Application 2019 & 2032
- Table 75: Rest of North America Canned Food Market Revenue (Million) Forecast, by Application 2019 & 2032
- Table 76: Rest of North America Canned Food Market Volume (K Tons) Forecast, by Application 2019 & 2032
- Table 77: Global Canned Food Market Revenue Million Forecast, by Type 2019 & 2032
- Table 78: Global Canned Food Market Volume K Tons Forecast, by Type 2019 & 2032
- Table 79: Global Canned Food Market Revenue Million Forecast, by Distribution Channel 2019 & 2032
- Table 80: Global Canned Food Market Volume K Tons Forecast, by Distribution Channel 2019 & 2032
- Table 81: Global Canned Food Market Revenue Million Forecast, by Country 2019 & 2032
- Table 82: Global Canned Food Market Volume K Tons Forecast, by Country 2019 & 2032
- Table 83: Spain Canned Food Market Revenue (Million) Forecast, by Application 2019 & 2032
- Table 84: Spain Canned Food Market Volume (K Tons) Forecast, by Application 2019 & 2032
- Table 85: United Kingdom Canned Food Market Revenue (Million) Forecast, by Application 2019 & 2032
- Table 86: United Kingdom Canned Food Market Volume (K Tons) Forecast, by Application 2019 & 2032
- Table 87: Germany Canned Food Market Revenue (Million) Forecast, by Application 2019 & 2032
- Table 88: Germany Canned Food Market Volume (K Tons) Forecast, by Application 2019 & 2032
- Table 89: France Canned Food Market Revenue (Million) Forecast, by Application 2019 & 2032
- Table 90: France Canned Food Market Volume (K Tons) Forecast, by Application 2019 & 2032
- Table 91: Italy Canned Food Market Revenue (Million) Forecast, by Application 2019 & 2032
- Table 92: Italy Canned Food Market Volume (K Tons) Forecast, by Application 2019 & 2032
- Table 93: Netherlands Canned Food Market Revenue (Million) Forecast, by Application 2019 & 2032
- Table 94: Netherlands Canned Food Market Volume (K Tons) Forecast, by Application 2019 & 2032
- Table 95: Rest of Europe Canned Food Market Revenue (Million) Forecast, by Application 2019 & 2032
- Table 96: Rest of Europe Canned Food Market Volume (K Tons) Forecast, by Application 2019 & 2032
- Table 97: Global Canned Food Market Revenue Million Forecast, by Type 2019 & 2032
- Table 98: Global Canned Food Market Volume K Tons Forecast, by Type 2019 & 2032
- Table 99: Global Canned Food Market Revenue Million Forecast, by Distribution Channel 2019 & 2032
- Table 100: Global Canned Food Market Volume K Tons Forecast, by Distribution Channel 2019 & 2032
- Table 101: Global Canned Food Market Revenue Million Forecast, by Country 2019 & 2032
- Table 102: Global Canned Food Market Volume K Tons Forecast, by Country 2019 & 2032
- Table 103: China Canned Food Market Revenue (Million) Forecast, by Application 2019 & 2032
- Table 104: China Canned Food Market Volume (K Tons) Forecast, by Application 2019 & 2032
- Table 105: Japan Canned Food Market Revenue (Million) Forecast, by Application 2019 & 2032
- Table 106: Japan Canned Food Market Volume (K Tons) Forecast, by Application 2019 & 2032
- Table 107: India Canned Food Market Revenue (Million) Forecast, by Application 2019 & 2032
- Table 108: India Canned Food Market Volume (K Tons) Forecast, by Application 2019 & 2032
- Table 109: Australia Canned Food Market Revenue (Million) Forecast, by Application 2019 & 2032
- Table 110: Australia Canned Food Market Volume (K Tons) Forecast, by Application 2019 & 2032
- Table 111: Rest of Asia Pacific Canned Food Market Revenue (Million) Forecast, by Application 2019 & 2032
- Table 112: Rest of Asia Pacific Canned Food Market Volume (K Tons) Forecast, by Application 2019 & 2032
- Table 113: Global Canned Food Market Revenue Million Forecast, by Type 2019 & 2032
- Table 114: Global Canned Food Market Volume K Tons Forecast, by Type 2019 & 2032
- Table 115: Global Canned Food Market Revenue Million Forecast, by Distribution Channel 2019 & 2032
- Table 116: Global Canned Food Market Volume K Tons Forecast, by Distribution Channel 2019 & 2032
- Table 117: Global Canned Food Market Revenue Million Forecast, by Country 2019 & 2032
- Table 118: Global Canned Food Market Volume K Tons Forecast, by Country 2019 & 2032
- Table 119: Brazil Canned Food Market Revenue (Million) Forecast, by Application 2019 & 2032
- Table 120: Brazil Canned Food Market Volume (K Tons) Forecast, by Application 2019 & 2032
- Table 121: Argentina Canned Food Market Revenue (Million) Forecast, by Application 2019 & 2032
- Table 122: Argentina Canned Food Market Volume (K Tons) Forecast, by Application 2019 & 2032
- Table 123: Rest of South America Canned Food Market Revenue (Million) Forecast, by Application 2019 & 2032
- Table 124: Rest of South America Canned Food Market Volume (K Tons) Forecast, by Application 2019 & 2032
- Table 125: Global Canned Food Market Revenue Million Forecast, by Type 2019 & 2032
- Table 126: Global Canned Food Market Volume K Tons Forecast, by Type 2019 & 2032
- Table 127: Global Canned Food Market Revenue Million Forecast, by Distribution Channel 2019 & 2032
- Table 128: Global Canned Food Market Volume K Tons Forecast, by Distribution Channel 2019 & 2032
- Table 129: Global Canned Food Market Revenue Million Forecast, by Country 2019 & 2032
- Table 130: Global Canned Food Market Volume K Tons Forecast, by Country 2019 & 2032
- Table 131: South Africa Canned Food Market Revenue (Million) Forecast, by Application 2019 & 2032
- Table 132: South Africa Canned Food Market Volume (K Tons) Forecast, by Application 2019 & 2032
- Table 133: Saudi Arabia Canned Food Market Revenue (Million) Forecast, by Application 2019 & 2032
- Table 134: Saudi Arabia Canned Food Market Volume (K Tons) Forecast, by Application 2019 & 2032
- Table 135: Rest of Middle East and Africa Canned Food Market Revenue (Million) Forecast, by Application 2019 & 2032
- Table 136: Rest of Middle East and Africa Canned Food Market Volume (K Tons) Forecast, by Application 2019 & 2032
Frequently Asked Questions
1. What is the projected Compound Annual Growth Rate (CAGR) of the Canned Food Market?
The projected CAGR is approximately 4.05%.
2. Which companies are prominent players in the Canned Food Market?
Key companies in the market include Del Monte Pacific Limited, The Bolton Group, Conagra Brands Inc, Campbell Soup Company, Century Pacific Food Inc, Thai Union Group PCL, Dole Holding Company LLC, JBS S A (SAMPCO), Bonduelle SA, Kraft Heinz Company.
3. What are the main segments of the Canned Food Market?
The market segments include Type, Distribution Channel.
4. Can you provide details about the market size?
The market size is estimated to be USD 89.03 Million as of 2022.
5. What are some drivers contributing to market growth?
Increasing urbanization and globalization contribute to changing dietary habits and a greater demand for convenient food options.
6. What are the notable trends driving market growth?
Increasing variety of canned foods including gourmet and premium options.
7. Are there any restraints impacting market growth?
Shelf Life Limitations and Changing Consumer Preferences.
8. Can you provide examples of recent developments in the market?
In October 2022, Campbell Soup Company's Chunky Soup launched four new flavors named Spicy Chicken Noodle, Spicy Steak n' Potato, Spicy Sirloin Burger, and Spicy Chicken and Sausage Gumbo.
9. What pricing options are available for accessing the report?
Pricing options include single-user, multi-user, and enterprise licenses priced at USD 4750, USD 5250, and USD 8750 respectively.
10. Is the market size provided in terms of value or volume?
The market size is provided in terms of value, measured in Million and volume, measured in K Tons.
11. Are there any specific market keywords associated with the report?
Yes, the market keyword associated with the report is "Canned Food Market," which aids in identifying and referencing the specific market segment covered.
12. How do I determine which pricing option suits my needs best?
The pricing options vary based on user requirements and access needs. Individual users may opt for single-user licenses, while businesses requiring broader access may choose multi-user or enterprise licenses for cost-effective access to the report.
13. Are there any additional resources or data provided in the Canned Food Market report?
While the report offers comprehensive insights, it's advisable to review the specific contents or supplementary materials provided to ascertain if additional resources or data are available.
14. How can I stay updated on further developments or reports in the Canned Food Market?
To stay informed about further developments, trends, and reports in the Canned Food Market, consider subscribing to industry newsletters, following relevant companies and organizations, or regularly checking reputable industry news sources and publications.
Methodology
Step 1 - Identification of Relevant Samples Size from Population Database


Step 2 - Approaches for Defining Global Market Size (Value, Volume* & Price*)

Note*: In applicable scenarios
Step 3 - Data Sources
Primary Research
- Web Analytics
- Survey Reports
- Research Institute
- Latest Research Reports
- Opinion Leaders
Secondary Research
- Annual Reports
- White Paper
- Latest Press Release
- Industry Association
- Paid Database
- Investor Presentations

Step 4 - Data Triangulation
Involves using different sources of information in order to increase the validity of a study
These sources are likely to be stakeholders in a program - participants, other researchers, program staff, other community members, and so on.
Then we put all data in single framework & apply various statistical tools to find out the dynamic on the market.
During the analysis stage, feedback from the stakeholder groups would be compared to determine areas of agreement as well as areas of divergence


