
Key Insights
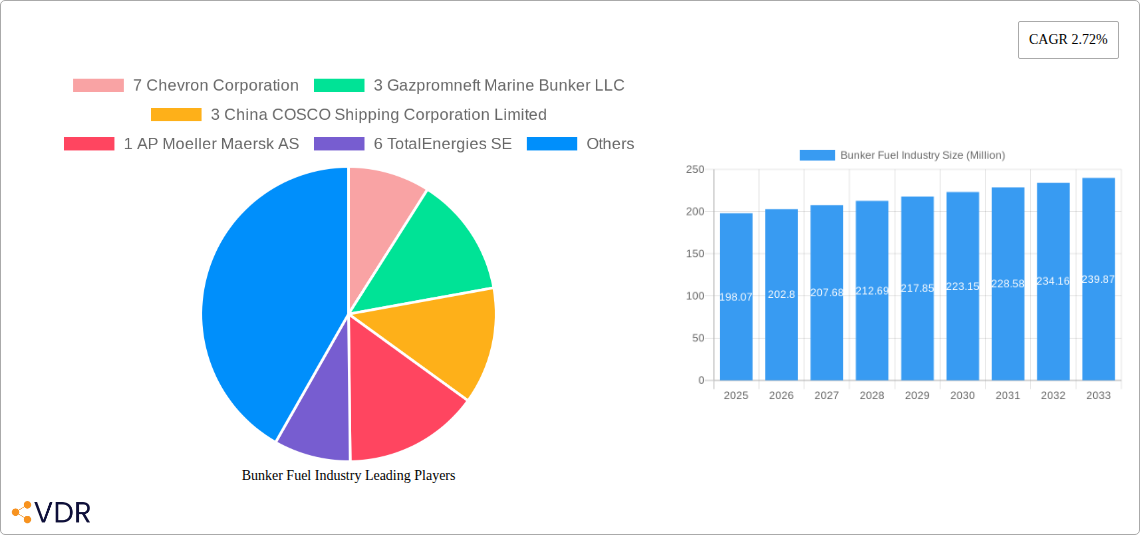
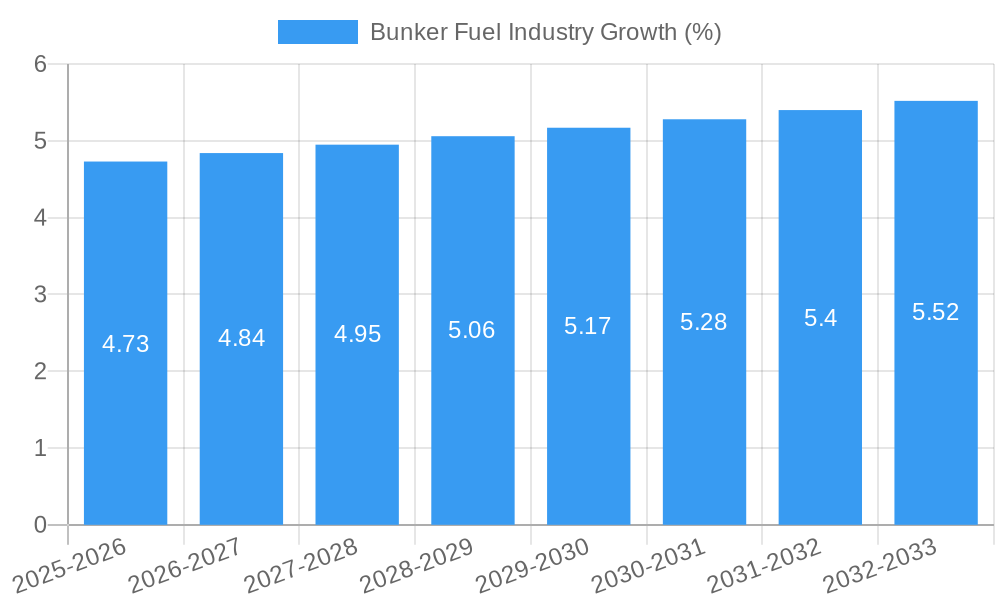
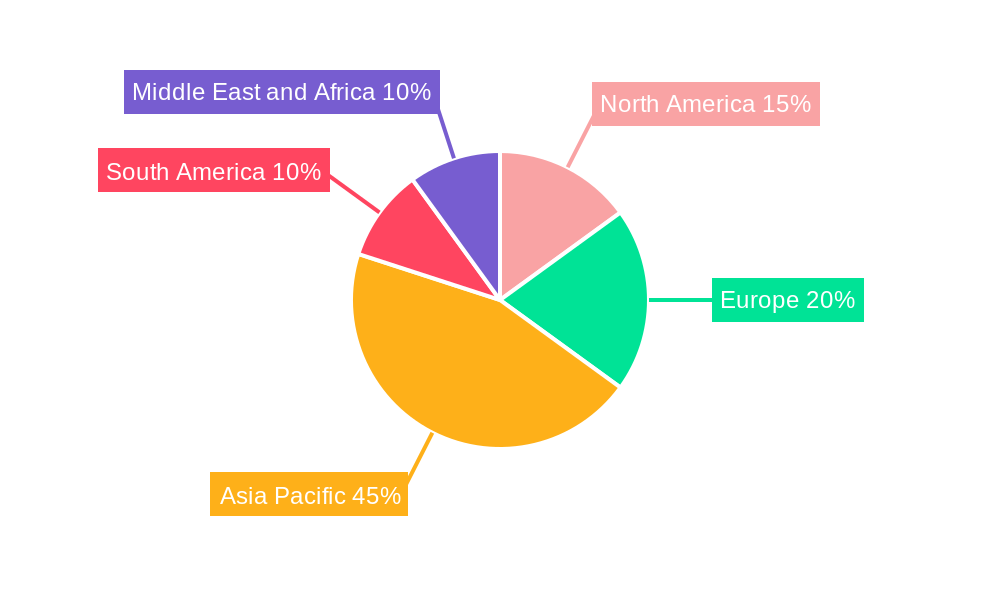
The global bunker fuel market, valued at $198.07 million in 2025, is projected to experience steady growth with a compound annual growth rate (CAGR) of 2.72% from 2025 to 2033. This growth is driven by the increasing global maritime trade volume, necessitating a larger fuel supply for diverse vessel types, including containerships, tankers, and bulk carriers. The shift towards cleaner fuels, such as Very Low Sulfur Fuel Oil (VLSFO) and Liquefied Natural Gas (LNG), is a significant trend, fueled by stricter environmental regulations aimed at reducing sulfur oxide (SOx) and greenhouse gas (GHG) emissions. While the transition to cleaner alternatives presents opportunities, it also creates challenges for fuel suppliers needing to adapt infrastructure and logistics. The market is fragmented, with numerous major players like Chevron, TotalEnergies, Shell, and numerous regional bunker fuel suppliers. Competition is fierce, particularly among fuel suppliers, influencing pricing and market share. Regional variations in regulations and fuel demand contribute to an uneven distribution of market share, with Asia Pacific likely holding the largest share given its high concentration of shipping activity. The continued growth of e-commerce and global trade will likely support market expansion, although fluctuations in global oil prices and economic downturns pose potential restraints.
The market segmentation reveals significant opportunities within specific fuel types and vessel categories. VLSFO is expected to dominate the fuel type segment due to its compliance with stricter emission regulations, while the LNG segment is poised for significant growth driven by its environmental benefits and increasing adoption by large shipping companies. Similarly, containerships and tankers will remain dominant in the vessel type segment due to their large fuel consumption. The strategic partnerships and investments by major energy companies and shipping lines in LNG bunkering infrastructure and alternative fuels will significantly influence future market trends. Navigating the evolving regulatory landscape, including the implementation of the International Maritime Organization (IMO) 2020 sulfur cap and future carbon reduction targets, will be crucial for market players to sustain growth and maintain profitability. Detailed regional analysis will help identify high-growth areas where investments and expansion can be strategically focused.
Bunker Fuel Industry Market Report: 2019-2033
This comprehensive report provides a detailed analysis of the global bunker fuel industry, covering market dynamics, growth trends, key players, and future outlook. The study period spans from 2019 to 2033, with a base year of 2025 and a forecast period from 2025 to 2033. The report offers invaluable insights for industry professionals, investors, and stakeholders seeking to understand and capitalize on opportunities within this dynamic sector. Parent market: Maritime Industry. Child markets: Ship Fueling, LNG Bunkering, Marine Lubricants.
Bunker Fuel Industry Market Dynamics & Structure
The global bunker fuel market exhibits a complex interplay of factors shaping its structure and growth trajectory. Market concentration is moderately high, with several major players holding significant market share (see Key Players section). Technological innovation, driven by stricter environmental regulations (e.g., IMO 2020), is a key driver, pushing the adoption of cleaner fuels like LNG and VLSFO. Regulatory frameworks, including emission control areas (ECAs) and global sulfur cap mandates, significantly influence fuel demand and consumption patterns. The rise of LNG as a fuel alternative is transforming the landscape. Competitive product substitutes, like biofuels and hydrogen-derived fuels, are emerging, impacting the future market share of traditional fuels. M&A activity within the industry has been moderate in recent years, with approximately xx million USD worth of deals recorded between 2019 and 2024. This relatively low activity reflects the relatively stable nature of the market as well as the high capital expenditures required to develop and supply alternative fuels.
- Market Concentration: Moderately high, with top 10 players accounting for approximately 60% of market share in 2024.
- Technological Innovation: Driven by environmental regulations and the pursuit of fuel efficiency.
- Regulatory Framework: IMO 2020, ECA regulations are major drivers and create significant market disruption.
- Competitive Substitutes: Biofuels, hydrogen are emerging as competitive alternatives to traditional fuels.
- End-User Demographics: Primarily comprises large shipping companies and fuel suppliers catering to diverse vessel types.
- M&A Trends: Moderate activity, with xx million USD in deal volume (2019-2024), reflecting consolidation and diversification strategies.
Bunker Fuel Industry Growth Trends & Insights
The bunker fuel market experienced a period of moderate growth from 2019-2024, driven by increasing global shipping volumes. However, the market is characterized by significant fluctuations due to global economic conditions and oil price volatility. The adoption rate of cleaner fuels, particularly VLSFO and LNG, is increasing rapidly, driven by stringent environmental regulations. Technological disruptions in fuel production and delivery, including the introduction of LNG bunkering infrastructure, are reshaping the supply chain. Shifts in consumer behavior, with an increasing emphasis on sustainability and environmental responsibility, are influencing fuel choices. The CAGR for the market during the historical period (2019-2024) was approximately xx%, while the projected CAGR for the forecast period (2025-2033) is estimated at xx%. Market penetration of LNG as a bunker fuel is expected to increase from xx% in 2024 to xx% by 2033.
Dominant Regions, Countries, or Segments in Bunker Fuel Industry
The Asia-Pacific region, specifically East and Southeast Asia, currently holds the largest market share in the bunker fuel industry due to high shipping traffic volume within the region. Europe is another major market due to its stringent environmental regulations which accelerate the adoption of cleaner fuels. Within fuel types, VLSFO has witnessed the most significant growth, driven by IMO 2020. Among vessel types, the container segment dominates fuel consumption owing to its significant share of the global shipping fleet.
- Key Drivers (Asia-Pacific): High shipping volume, rapid economic growth, significant port infrastructure.
- Key Drivers (Europe): Stringent environmental regulations, growing adoption of alternative fuels.
- Dominant Fuel Type: VLSFO (due to IMO 2020 regulations).
- Dominant Vessel Type: Containers (due to high global trade volume).
- Growth Potential: LNG fueled vessels in all regions, biofuels in Europe and North America.
Bunker Fuel Industry Product Landscape
The bunker fuel product landscape is evolving rapidly with increased focus on low-sulfur fuels and alternative fuels like LNG. Significant innovations include improved fuel efficiency through additives, enhanced storage and handling technologies for LNG, and the development of biofuels as sustainable alternatives. Key performance metrics center around sulfur content, energy density, and environmental impact. Unique selling propositions often involve cost-effectiveness, lower emissions, and compliance with environmental regulations.
Key Drivers, Barriers & Challenges in Bunker Fuel Industry
Key Drivers: Increasing global trade, stringent environmental regulations (IMO 2020 and beyond), growing demand for cleaner fuels, technological advancements in alternative fuel production and delivery infrastructure.
Key Challenges: High initial investment costs associated with LNG infrastructure, volatility in fuel prices, supply chain disruptions, regulatory uncertainty in different regions, competition from emerging fuel alternatives (biofuels, hydrogen). The impact of these challenges on the market is estimated to be a reduction in market growth by xx% by 2033 if not addressed effectively.
Emerging Opportunities in Bunker Fuel Industry
Emerging opportunities include the expansion of LNG bunkering infrastructure, the growth of biofuel production and use, the exploration of hydrogen as a potential bunker fuel, and the development of innovative fuel blending technologies to reduce emissions. Untapped markets exist in developing economies with growing shipping activity. The evolution of digital technologies and smart bunkering solutions offer opportunities for improved efficiency and cost optimization within the industry.
Growth Accelerators in the Bunker Fuel Industry
Technological advancements in fuel cell technology and battery technology for ships are paving the way for alternative energy sources to drive the industry's long-term growth. The formation of strategic partnerships between fuel suppliers, ship owners, and technology providers fosters collaborative innovation and market expansion. Investments in LNG bunkering infrastructure and the development of green ports enhance the feasibility of cleaner fuels. Government incentives and policies promoting the adoption of sustainable shipping practices serve as additional growth catalysts.
Key Players Shaping the Bunker Fuel Industry Market
- Chevron Corporation
- Gazpromneft Marine Bunker LLC
- China COSCO Shipping Corporation Limited
- AP Moeller Maersk AS
- TotalEnergies SE
- Shell PLC
- Evergreen Marine Corp Taiwan Ltd
- Mediterranean Shipping Company SA
- Ship Owners
- Clipper Oil
- Yang Ming Marine Transport Corporation
- Fuel Suppliers
- Ocean Network Express
- Gulf Agency Company Ltd
- Pacific International Lines Pte Ltd
- HMM Co Ltd
- CMA CGM Group
- ExxonMobil Corporation
- Bomin Bunker Holding GmbH & Co KG
- PJSC Lukoil Oil Company
- Hapag-Lloyd AG
- BP PLC
Notable Milestones in Bunker Fuel Industry Sector
- January 2022: Titan LNG secures LNG delivery tender in Port of Marseille for Corsica Linea's ferry, expanding LNG availability in the Mediterranean.
- November 2022: Nimofast Brasil S.A. partners with KanferShipping AS to provide LNG shipping and bunkering solutions in Brazil.
In-Depth Bunker Fuel Industry Market Outlook
The future of the bunker fuel industry is characterized by a transition towards cleaner fuels, driven by stringent environmental regulations and a growing focus on sustainability. The market is poised for significant growth, with LNG and biofuels expected to gain substantial market share. Strategic partnerships and technological advancements will be critical in driving this transition, shaping the competitive landscape and unlocking lucrative opportunities for businesses capable of adapting to the evolving market dynamics. The long-term potential of the market is considerable, with continued expansion of global trade and the increasing demand for efficient and environmentally friendly shipping solutions.
Bunker Fuel Industry Segmentation
-
1. Fuel Type
- 1.1. High Sulfur Fuel Oil (HSFO)
- 1.2. Very Low Sulfur Fuel Oil (VLSFO)
- 1.3. Marine Gas Oil (MGO)
- 1.4. Liquefied Natural Gas (LNG)
- 1.5. Other Fuel Types
-
2. Vessel Type
- 2.1. Containers
- 2.2. Tankers
- 2.3. General Cargo
- 2.4. Bulk Carriers
- 2.5. Other Vessel Types
Bunker Fuel Industry Segmentation By Geography
-
1. North America
- 1.1. United States
- 1.2. Canada
- 1.3. Rest of North America
-
2. Europe
- 2.1. Germany
- 2.2. France
- 2.3. United Kingdom
- 2.4. Spain
- 2.5. NORDIC
- 2.6. Turkey
- 2.7. Russia
- 2.8. Rest of Europe
-
3. Asia Pacific
- 3.1. China
- 3.2. India
- 3.3. Japan
- 3.4. South Korea
- 3.5. Malaysia
- 3.6. Thailand
- 3.7. Indonesia
- 3.8. Vietnam
- 3.9. Rest of Asia Pacific
-
4. South America
- 4.1. Brazil
- 4.2. Argentina
- 4.3. Colombia
- 4.4. Rest of South America
-
5. Middle East and Africa
- 5.1. Saudi Arabia
- 5.2. United Arab Emirates
- 5.3. South Africa
- 5.4. Nigeria
- 5.5. Qatar
- 5.6. Egypt
- 5.7. Rest of Middle East and Africa
Bunker Fuel Industry REPORT HIGHLIGHTS
| Aspects | Details |
|---|---|
| Study Period | 2019-2033 |
| Base Year | 2024 |
| Estimated Year | 2025 |
| Forecast Period | 2025-2033 |
| Historical Period | 2019-2024 |
| Growth Rate | CAGR of 2.72% from 2019-2033 |
| Segmentation |
|
Table of Contents
- 1. Introduction
- 1.1. Research Scope
- 1.2. Market Segmentation
- 1.3. Research Methodology
- 1.4. Definitions and Assumptions
- 2. Executive Summary
- 2.1. Introduction
- 3. Market Dynamics
- 3.1. Introduction
- 3.2. Market Drivers
- 3.2.1. 4.; Increased LNG Trade Worldwide4.; Increasing Dependecies over Natural Gas for Power Generation
- 3.3. Market Restrains
- 3.3.1. 4.; Environmental Concerns and the Strict Regulations Related to Emissions from Maritime Industry
- 3.4. Market Trends
- 3.4.1. LNG as a Bunker Fuel is Likely to Witness Significant Growth
- 4. Market Factor Analysis
- 4.1. Porters Five Forces
- 4.2. Supply/Value Chain
- 4.3. PESTEL analysis
- 4.4. Market Entropy
- 4.5. Patent/Trademark Analysis
- 5. Global Bunker Fuel Industry Analysis, Insights and Forecast, 2019-2031
- 5.1. Market Analysis, Insights and Forecast - by Fuel Type
- 5.1.1. High Sulfur Fuel Oil (HSFO)
- 5.1.2. Very Low Sulfur Fuel Oil (VLSFO)
- 5.1.3. Marine Gas Oil (MGO)
- 5.1.4. Liquefied Natural Gas (LNG)
- 5.1.5. Other Fuel Types
- 5.2. Market Analysis, Insights and Forecast - by Vessel Type
- 5.2.1. Containers
- 5.2.2. Tankers
- 5.2.3. General Cargo
- 5.2.4. Bulk Carriers
- 5.2.5. Other Vessel Types
- 5.3. Market Analysis, Insights and Forecast - by Region
- 5.3.1. North America
- 5.3.2. Europe
- 5.3.3. Asia Pacific
- 5.3.4. South America
- 5.3.5. Middle East and Africa
- 5.1. Market Analysis, Insights and Forecast - by Fuel Type
- 6. North America Bunker Fuel Industry Analysis, Insights and Forecast, 2019-2031
- 6.1. Market Analysis, Insights and Forecast - by Fuel Type
- 6.1.1. High Sulfur Fuel Oil (HSFO)
- 6.1.2. Very Low Sulfur Fuel Oil (VLSFO)
- 6.1.3. Marine Gas Oil (MGO)
- 6.1.4. Liquefied Natural Gas (LNG)
- 6.1.5. Other Fuel Types
- 6.2. Market Analysis, Insights and Forecast - by Vessel Type
- 6.2.1. Containers
- 6.2.2. Tankers
- 6.2.3. General Cargo
- 6.2.4. Bulk Carriers
- 6.2.5. Other Vessel Types
- 6.1. Market Analysis, Insights and Forecast - by Fuel Type
- 7. Europe Bunker Fuel Industry Analysis, Insights and Forecast, 2019-2031
- 7.1. Market Analysis, Insights and Forecast - by Fuel Type
- 7.1.1. High Sulfur Fuel Oil (HSFO)
- 7.1.2. Very Low Sulfur Fuel Oil (VLSFO)
- 7.1.3. Marine Gas Oil (MGO)
- 7.1.4. Liquefied Natural Gas (LNG)
- 7.1.5. Other Fuel Types
- 7.2. Market Analysis, Insights and Forecast - by Vessel Type
- 7.2.1. Containers
- 7.2.2. Tankers
- 7.2.3. General Cargo
- 7.2.4. Bulk Carriers
- 7.2.5. Other Vessel Types
- 7.1. Market Analysis, Insights and Forecast - by Fuel Type
- 8. Asia Pacific Bunker Fuel Industry Analysis, Insights and Forecast, 2019-2031
- 8.1. Market Analysis, Insights and Forecast - by Fuel Type
- 8.1.1. High Sulfur Fuel Oil (HSFO)
- 8.1.2. Very Low Sulfur Fuel Oil (VLSFO)
- 8.1.3. Marine Gas Oil (MGO)
- 8.1.4. Liquefied Natural Gas (LNG)
- 8.1.5. Other Fuel Types
- 8.2. Market Analysis, Insights and Forecast - by Vessel Type
- 8.2.1. Containers
- 8.2.2. Tankers
- 8.2.3. General Cargo
- 8.2.4. Bulk Carriers
- 8.2.5. Other Vessel Types
- 8.1. Market Analysis, Insights and Forecast - by Fuel Type
- 9. South America Bunker Fuel Industry Analysis, Insights and Forecast, 2019-2031
- 9.1. Market Analysis, Insights and Forecast - by Fuel Type
- 9.1.1. High Sulfur Fuel Oil (HSFO)
- 9.1.2. Very Low Sulfur Fuel Oil (VLSFO)
- 9.1.3. Marine Gas Oil (MGO)
- 9.1.4. Liquefied Natural Gas (LNG)
- 9.1.5. Other Fuel Types
- 9.2. Market Analysis, Insights and Forecast - by Vessel Type
- 9.2.1. Containers
- 9.2.2. Tankers
- 9.2.3. General Cargo
- 9.2.4. Bulk Carriers
- 9.2.5. Other Vessel Types
- 9.1. Market Analysis, Insights and Forecast - by Fuel Type
- 10. Middle East and Africa Bunker Fuel Industry Analysis, Insights and Forecast, 2019-2031
- 10.1. Market Analysis, Insights and Forecast - by Fuel Type
- 10.1.1. High Sulfur Fuel Oil (HSFO)
- 10.1.2. Very Low Sulfur Fuel Oil (VLSFO)
- 10.1.3. Marine Gas Oil (MGO)
- 10.1.4. Liquefied Natural Gas (LNG)
- 10.1.5. Other Fuel Types
- 10.2. Market Analysis, Insights and Forecast - by Vessel Type
- 10.2.1. Containers
- 10.2.2. Tankers
- 10.2.3. General Cargo
- 10.2.4. Bulk Carriers
- 10.2.5. Other Vessel Types
- 10.1. Market Analysis, Insights and Forecast - by Fuel Type
- 11. North America Bunker Fuel Industry Analysis, Insights and Forecast, 2019-2031
- 11.1. Market Analysis, Insights and Forecast - By Country/Sub-region
- 11.1.1 United States
- 11.1.2 Canada
- 11.1.3 Rest of North America
- 12. Europe Bunker Fuel Industry Analysis, Insights and Forecast, 2019-2031
- 12.1. Market Analysis, Insights and Forecast - By Country/Sub-region
- 12.1.1 Germany
- 12.1.2 France
- 12.1.3 United Kingdom
- 12.1.4 Rest of Europe
- 13. Asia Pacific Bunker Fuel Industry Analysis, Insights and Forecast, 2019-2031
- 13.1. Market Analysis, Insights and Forecast - By Country/Sub-region
- 13.1.1 China
- 13.1.2 India
- 13.1.3 Japan
- 13.1.4 South Korea
- 13.1.5 Rest of Asia Pacific
- 14. South America Bunker Fuel Industry Analysis, Insights and Forecast, 2019-2031
- 14.1. Market Analysis, Insights and Forecast - By Country/Sub-region
- 14.1.1 Brazil
- 14.1.2 Argentina
- 14.1.3 Rest of South America
- 15. Middle East and Africa Bunker Fuel Industry Analysis, Insights and Forecast, 2019-2031
- 15.1. Market Analysis, Insights and Forecast - By Country/Sub-region
- 15.1.1 Saudi Arabia
- 15.1.2 United Arab Emirates
- 15.1.3 South Africa
- 15.1.4 Rest of Middle East and Africa
- 16. Competitive Analysis
- 16.1. Global Market Share Analysis 2024
- 16.2. Company Profiles
- 16.2.1 7 Chevron Corporation
- 16.2.1.1. Overview
- 16.2.1.2. Products
- 16.2.1.3. SWOT Analysis
- 16.2.1.4. Recent Developments
- 16.2.1.5. Financials (Based on Availability)
- 16.2.2 3 Gazpromneft Marine Bunker LLC
- 16.2.2.1. Overview
- 16.2.2.2. Products
- 16.2.2.3. SWOT Analysis
- 16.2.2.4. Recent Developments
- 16.2.2.5. Financials (Based on Availability)
- 16.2.3 3 China COSCO Shipping Corporation Limited
- 16.2.3.1. Overview
- 16.2.3.2. Products
- 16.2.3.3. SWOT Analysis
- 16.2.3.4. Recent Developments
- 16.2.3.5. Financials (Based on Availability)
- 16.2.4 1 AP Moeller Maersk AS
- 16.2.4.1. Overview
- 16.2.4.2. Products
- 16.2.4.3. SWOT Analysis
- 16.2.4.4. Recent Developments
- 16.2.4.5. Financials (Based on Availability)
- 16.2.5 6 TotalEnergies SE
- 16.2.5.1. Overview
- 16.2.5.2. Products
- 16.2.5.3. SWOT Analysis
- 16.2.5.4. Recent Developments
- 16.2.5.5. Financials (Based on Availability)
- 16.2.6 2 Shell PLC
- 16.2.6.1. Overview
- 16.2.6.2. Products
- 16.2.6.3. SWOT Analysis
- 16.2.6.4. Recent Developments
- 16.2.6.5. Financials (Based on Availability)
- 16.2.7 7 Evergreen Marine Corp Taiwan Ltd
- 16.2.7.1. Overview
- 16.2.7.2. Products
- 16.2.7.3. SWOT Analysis
- 16.2.7.4. Recent Developments
- 16.2.7.5. Financials (Based on Availability)
- 16.2.8 2 Mediterranean Shipping Company SA
- 16.2.8.1. Overview
- 16.2.8.2. Products
- 16.2.8.3. SWOT Analysis
- 16.2.8.4. Recent Developments
- 16.2.8.5. Financials (Based on Availability)
- 16.2.9 Ship Owners
- 16.2.9.1. Overview
- 16.2.9.2. Products
- 16.2.9.3. SWOT Analysis
- 16.2.9.4. Recent Developments
- 16.2.9.5. Financials (Based on Availability)
- 16.2.10 8 Clipper Oil
- 16.2.10.1. Overview
- 16.2.10.2. Products
- 16.2.10.3. SWOT Analysis
- 16.2.10.4. Recent Developments
- 16.2.10.5. Financials (Based on Availability)
- 16.2.11 8 Yang Ming Marine Transport Corporation
- 16.2.11.1. Overview
- 16.2.11.2. Products
- 16.2.11.3. SWOT Analysis
- 16.2.11.4. Recent Developments
- 16.2.11.5. Financials (Based on Availability)
- 16.2.12 Fuel Suppliers
- 16.2.12.1. Overview
- 16.2.12.2. Products
- 16.2.12.3. SWOT Analysis
- 16.2.12.4. Recent Developments
- 16.2.12.5. Financials (Based on Availability)
- 16.2.13 6 Ocean Network Express
- 16.2.13.1. Overview
- 16.2.13.2. Products
- 16.2.13.3. SWOT Analysis
- 16.2.13.4. Recent Developments
- 16.2.13.5. Financials (Based on Availability)
- 16.2.14 9 Gulf Agency Company Ltd
- 16.2.14.1. Overview
- 16.2.14.2. Products
- 16.2.14.3. SWOT Analysis
- 16.2.14.4. Recent Developments
- 16.2.14.5. Financials (Based on Availability)
- 16.2.15 10 Pacific International Lines Pte Ltd*List Not Exhaustive
- 16.2.15.1. Overview
- 16.2.15.2. Products
- 16.2.15.3. SWOT Analysis
- 16.2.15.4. Recent Developments
- 16.2.15.5. Financials (Based on Availability)
- 16.2.16 9 HMM Co Ltd
- 16.2.16.1. Overview
- 16.2.16.2. Products
- 16.2.16.3. SWOT Analysis
- 16.2.16.4. Recent Developments
- 16.2.16.5. Financials (Based on Availability)
- 16.2.17 4 CMA CGM Group
- 16.2.17.1. Overview
- 16.2.17.2. Products
- 16.2.17.3. SWOT Analysis
- 16.2.17.4. Recent Developments
- 16.2.17.5. Financials (Based on Availability)
- 16.2.18 1 ExxonMobil Corporation
- 16.2.18.1. Overview
- 16.2.18.2. Products
- 16.2.18.3. SWOT Analysis
- 16.2.18.4. Recent Developments
- 16.2.18.5. Financials (Based on Availability)
- 16.2.19 10 Bomin Bunker Holding GmbH & Co KG
- 16.2.19.1. Overview
- 16.2.19.2. Products
- 16.2.19.3. SWOT Analysis
- 16.2.19.4. Recent Developments
- 16.2.19.5. Financials (Based on Availability)
- 16.2.20 5 PJSC Lukoil Oil Company
- 16.2.20.1. Overview
- 16.2.20.2. Products
- 16.2.20.3. SWOT Analysis
- 16.2.20.4. Recent Developments
- 16.2.20.5. Financials (Based on Availability)
- 16.2.21 5 Hapag-Lloyd AG
- 16.2.21.1. Overview
- 16.2.21.2. Products
- 16.2.21.3. SWOT Analysis
- 16.2.21.4. Recent Developments
- 16.2.21.5. Financials (Based on Availability)
- 16.2.22 4 BP PLC
- 16.2.22.1. Overview
- 16.2.22.2. Products
- 16.2.22.3. SWOT Analysis
- 16.2.22.4. Recent Developments
- 16.2.22.5. Financials (Based on Availability)
- 16.2.1 7 Chevron Corporation
List of Figures
- Figure 1: Global Bunker Fuel Industry Revenue Breakdown (Million, %) by Region 2024 & 2032
- Figure 2: Global Bunker Fuel Industry Volume Breakdown (metric tonnes, %) by Region 2024 & 2032
- Figure 3: North America Bunker Fuel Industry Revenue (Million), by Country 2024 & 2032
- Figure 4: North America Bunker Fuel Industry Volume (metric tonnes), by Country 2024 & 2032
- Figure 5: North America Bunker Fuel Industry Revenue Share (%), by Country 2024 & 2032
- Figure 6: North America Bunker Fuel Industry Volume Share (%), by Country 2024 & 2032
- Figure 7: Europe Bunker Fuel Industry Revenue (Million), by Country 2024 & 2032
- Figure 8: Europe Bunker Fuel Industry Volume (metric tonnes), by Country 2024 & 2032
- Figure 9: Europe Bunker Fuel Industry Revenue Share (%), by Country 2024 & 2032
- Figure 10: Europe Bunker Fuel Industry Volume Share (%), by Country 2024 & 2032
- Figure 11: Asia Pacific Bunker Fuel Industry Revenue (Million), by Country 2024 & 2032
- Figure 12: Asia Pacific Bunker Fuel Industry Volume (metric tonnes), by Country 2024 & 2032
- Figure 13: Asia Pacific Bunker Fuel Industry Revenue Share (%), by Country 2024 & 2032
- Figure 14: Asia Pacific Bunker Fuel Industry Volume Share (%), by Country 2024 & 2032
- Figure 15: South America Bunker Fuel Industry Revenue (Million), by Country 2024 & 2032
- Figure 16: South America Bunker Fuel Industry Volume (metric tonnes), by Country 2024 & 2032
- Figure 17: South America Bunker Fuel Industry Revenue Share (%), by Country 2024 & 2032
- Figure 18: South America Bunker Fuel Industry Volume Share (%), by Country 2024 & 2032
- Figure 19: Middle East and Africa Bunker Fuel Industry Revenue (Million), by Country 2024 & 2032
- Figure 20: Middle East and Africa Bunker Fuel Industry Volume (metric tonnes), by Country 2024 & 2032
- Figure 21: Middle East and Africa Bunker Fuel Industry Revenue Share (%), by Country 2024 & 2032
- Figure 22: Middle East and Africa Bunker Fuel Industry Volume Share (%), by Country 2024 & 2032
- Figure 23: North America Bunker Fuel Industry Revenue (Million), by Fuel Type 2024 & 2032
- Figure 24: North America Bunker Fuel Industry Volume (metric tonnes), by Fuel Type 2024 & 2032
- Figure 25: North America Bunker Fuel Industry Revenue Share (%), by Fuel Type 2024 & 2032
- Figure 26: North America Bunker Fuel Industry Volume Share (%), by Fuel Type 2024 & 2032
- Figure 27: North America Bunker Fuel Industry Revenue (Million), by Vessel Type 2024 & 2032
- Figure 28: North America Bunker Fuel Industry Volume (metric tonnes), by Vessel Type 2024 & 2032
- Figure 29: North America Bunker Fuel Industry Revenue Share (%), by Vessel Type 2024 & 2032
- Figure 30: North America Bunker Fuel Industry Volume Share (%), by Vessel Type 2024 & 2032
- Figure 31: North America Bunker Fuel Industry Revenue (Million), by Country 2024 & 2032
- Figure 32: North America Bunker Fuel Industry Volume (metric tonnes), by Country 2024 & 2032
- Figure 33: North America Bunker Fuel Industry Revenue Share (%), by Country 2024 & 2032
- Figure 34: North America Bunker Fuel Industry Volume Share (%), by Country 2024 & 2032
- Figure 35: Europe Bunker Fuel Industry Revenue (Million), by Fuel Type 2024 & 2032
- Figure 36: Europe Bunker Fuel Industry Volume (metric tonnes), by Fuel Type 2024 & 2032
- Figure 37: Europe Bunker Fuel Industry Revenue Share (%), by Fuel Type 2024 & 2032
- Figure 38: Europe Bunker Fuel Industry Volume Share (%), by Fuel Type 2024 & 2032
- Figure 39: Europe Bunker Fuel Industry Revenue (Million), by Vessel Type 2024 & 2032
- Figure 40: Europe Bunker Fuel Industry Volume (metric tonnes), by Vessel Type 2024 & 2032
- Figure 41: Europe Bunker Fuel Industry Revenue Share (%), by Vessel Type 2024 & 2032
- Figure 42: Europe Bunker Fuel Industry Volume Share (%), by Vessel Type 2024 & 2032
- Figure 43: Europe Bunker Fuel Industry Revenue (Million), by Country 2024 & 2032
- Figure 44: Europe Bunker Fuel Industry Volume (metric tonnes), by Country 2024 & 2032
- Figure 45: Europe Bunker Fuel Industry Revenue Share (%), by Country 2024 & 2032
- Figure 46: Europe Bunker Fuel Industry Volume Share (%), by Country 2024 & 2032
- Figure 47: Asia Pacific Bunker Fuel Industry Revenue (Million), by Fuel Type 2024 & 2032
- Figure 48: Asia Pacific Bunker Fuel Industry Volume (metric tonnes), by Fuel Type 2024 & 2032
- Figure 49: Asia Pacific Bunker Fuel Industry Revenue Share (%), by Fuel Type 2024 & 2032
- Figure 50: Asia Pacific Bunker Fuel Industry Volume Share (%), by Fuel Type 2024 & 2032
- Figure 51: Asia Pacific Bunker Fuel Industry Revenue (Million), by Vessel Type 2024 & 2032
- Figure 52: Asia Pacific Bunker Fuel Industry Volume (metric tonnes), by Vessel Type 2024 & 2032
- Figure 53: Asia Pacific Bunker Fuel Industry Revenue Share (%), by Vessel Type 2024 & 2032
- Figure 54: Asia Pacific Bunker Fuel Industry Volume Share (%), by Vessel Type 2024 & 2032
- Figure 55: Asia Pacific Bunker Fuel Industry Revenue (Million), by Country 2024 & 2032
- Figure 56: Asia Pacific Bunker Fuel Industry Volume (metric tonnes), by Country 2024 & 2032
- Figure 57: Asia Pacific Bunker Fuel Industry Revenue Share (%), by Country 2024 & 2032
- Figure 58: Asia Pacific Bunker Fuel Industry Volume Share (%), by Country 2024 & 2032
- Figure 59: South America Bunker Fuel Industry Revenue (Million), by Fuel Type 2024 & 2032
- Figure 60: South America Bunker Fuel Industry Volume (metric tonnes), by Fuel Type 2024 & 2032
- Figure 61: South America Bunker Fuel Industry Revenue Share (%), by Fuel Type 2024 & 2032
- Figure 62: South America Bunker Fuel Industry Volume Share (%), by Fuel Type 2024 & 2032
- Figure 63: South America Bunker Fuel Industry Revenue (Million), by Vessel Type 2024 & 2032
- Figure 64: South America Bunker Fuel Industry Volume (metric tonnes), by Vessel Type 2024 & 2032
- Figure 65: South America Bunker Fuel Industry Revenue Share (%), by Vessel Type 2024 & 2032
- Figure 66: South America Bunker Fuel Industry Volume Share (%), by Vessel Type 2024 & 2032
- Figure 67: South America Bunker Fuel Industry Revenue (Million), by Country 2024 & 2032
- Figure 68: South America Bunker Fuel Industry Volume (metric tonnes), by Country 2024 & 2032
- Figure 69: South America Bunker Fuel Industry Revenue Share (%), by Country 2024 & 2032
- Figure 70: South America Bunker Fuel Industry Volume Share (%), by Country 2024 & 2032
- Figure 71: Middle East and Africa Bunker Fuel Industry Revenue (Million), by Fuel Type 2024 & 2032
- Figure 72: Middle East and Africa Bunker Fuel Industry Volume (metric tonnes), by Fuel Type 2024 & 2032
- Figure 73: Middle East and Africa Bunker Fuel Industry Revenue Share (%), by Fuel Type 2024 & 2032
- Figure 74: Middle East and Africa Bunker Fuel Industry Volume Share (%), by Fuel Type 2024 & 2032
- Figure 75: Middle East and Africa Bunker Fuel Industry Revenue (Million), by Vessel Type 2024 & 2032
- Figure 76: Middle East and Africa Bunker Fuel Industry Volume (metric tonnes), by Vessel Type 2024 & 2032
- Figure 77: Middle East and Africa Bunker Fuel Industry Revenue Share (%), by Vessel Type 2024 & 2032
- Figure 78: Middle East and Africa Bunker Fuel Industry Volume Share (%), by Vessel Type 2024 & 2032
- Figure 79: Middle East and Africa Bunker Fuel Industry Revenue (Million), by Country 2024 & 2032
- Figure 80: Middle East and Africa Bunker Fuel Industry Volume (metric tonnes), by Country 2024 & 2032
- Figure 81: Middle East and Africa Bunker Fuel Industry Revenue Share (%), by Country 2024 & 2032
- Figure 82: Middle East and Africa Bunker Fuel Industry Volume Share (%), by Country 2024 & 2032
List of Tables
- Table 1: Global Bunker Fuel Industry Revenue Million Forecast, by Region 2019 & 2032
- Table 2: Global Bunker Fuel Industry Volume metric tonnes Forecast, by Region 2019 & 2032
- Table 3: Global Bunker Fuel Industry Revenue Million Forecast, by Fuel Type 2019 & 2032
- Table 4: Global Bunker Fuel Industry Volume metric tonnes Forecast, by Fuel Type 2019 & 2032
- Table 5: Global Bunker Fuel Industry Revenue Million Forecast, by Vessel Type 2019 & 2032
- Table 6: Global Bunker Fuel Industry Volume metric tonnes Forecast, by Vessel Type 2019 & 2032
- Table 7: Global Bunker Fuel Industry Revenue Million Forecast, by Region 2019 & 2032
- Table 8: Global Bunker Fuel Industry Volume metric tonnes Forecast, by Region 2019 & 2032
- Table 9: Global Bunker Fuel Industry Revenue Million Forecast, by Country 2019 & 2032
- Table 10: Global Bunker Fuel Industry Volume metric tonnes Forecast, by Country 2019 & 2032
- Table 11: United States Bunker Fuel Industry Revenue (Million) Forecast, by Application 2019 & 2032
- Table 12: United States Bunker Fuel Industry Volume (metric tonnes) Forecast, by Application 2019 & 2032
- Table 13: Canada Bunker Fuel Industry Revenue (Million) Forecast, by Application 2019 & 2032
- Table 14: Canada Bunker Fuel Industry Volume (metric tonnes) Forecast, by Application 2019 & 2032
- Table 15: Rest of North America Bunker Fuel Industry Revenue (Million) Forecast, by Application 2019 & 2032
- Table 16: Rest of North America Bunker Fuel Industry Volume (metric tonnes) Forecast, by Application 2019 & 2032
- Table 17: Global Bunker Fuel Industry Revenue Million Forecast, by Country 2019 & 2032
- Table 18: Global Bunker Fuel Industry Volume metric tonnes Forecast, by Country 2019 & 2032
- Table 19: Germany Bunker Fuel Industry Revenue (Million) Forecast, by Application 2019 & 2032
- Table 20: Germany Bunker Fuel Industry Volume (metric tonnes) Forecast, by Application 2019 & 2032
- Table 21: France Bunker Fuel Industry Revenue (Million) Forecast, by Application 2019 & 2032
- Table 22: France Bunker Fuel Industry Volume (metric tonnes) Forecast, by Application 2019 & 2032
- Table 23: United Kingdom Bunker Fuel Industry Revenue (Million) Forecast, by Application 2019 & 2032
- Table 24: United Kingdom Bunker Fuel Industry Volume (metric tonnes) Forecast, by Application 2019 & 2032
- Table 25: Rest of Europe Bunker Fuel Industry Revenue (Million) Forecast, by Application 2019 & 2032
- Table 26: Rest of Europe Bunker Fuel Industry Volume (metric tonnes) Forecast, by Application 2019 & 2032
- Table 27: Global Bunker Fuel Industry Revenue Million Forecast, by Country 2019 & 2032
- Table 28: Global Bunker Fuel Industry Volume metric tonnes Forecast, by Country 2019 & 2032
- Table 29: China Bunker Fuel Industry Revenue (Million) Forecast, by Application 2019 & 2032
- Table 30: China Bunker Fuel Industry Volume (metric tonnes) Forecast, by Application 2019 & 2032
- Table 31: India Bunker Fuel Industry Revenue (Million) Forecast, by Application 2019 & 2032
- Table 32: India Bunker Fuel Industry Volume (metric tonnes) Forecast, by Application 2019 & 2032
- Table 33: Japan Bunker Fuel Industry Revenue (Million) Forecast, by Application 2019 & 2032
- Table 34: Japan Bunker Fuel Industry Volume (metric tonnes) Forecast, by Application 2019 & 2032
- Table 35: South Korea Bunker Fuel Industry Revenue (Million) Forecast, by Application 2019 & 2032
- Table 36: South Korea Bunker Fuel Industry Volume (metric tonnes) Forecast, by Application 2019 & 2032
- Table 37: Rest of Asia Pacific Bunker Fuel Industry Revenue (Million) Forecast, by Application 2019 & 2032
- Table 38: Rest of Asia Pacific Bunker Fuel Industry Volume (metric tonnes) Forecast, by Application 2019 & 2032
- Table 39: Global Bunker Fuel Industry Revenue Million Forecast, by Country 2019 & 2032
- Table 40: Global Bunker Fuel Industry Volume metric tonnes Forecast, by Country 2019 & 2032
- Table 41: Brazil Bunker Fuel Industry Revenue (Million) Forecast, by Application 2019 & 2032
- Table 42: Brazil Bunker Fuel Industry Volume (metric tonnes) Forecast, by Application 2019 & 2032
- Table 43: Argentina Bunker Fuel Industry Revenue (Million) Forecast, by Application 2019 & 2032
- Table 44: Argentina Bunker Fuel Industry Volume (metric tonnes) Forecast, by Application 2019 & 2032
- Table 45: Rest of South America Bunker Fuel Industry Revenue (Million) Forecast, by Application 2019 & 2032
- Table 46: Rest of South America Bunker Fuel Industry Volume (metric tonnes) Forecast, by Application 2019 & 2032
- Table 47: Global Bunker Fuel Industry Revenue Million Forecast, by Country 2019 & 2032
- Table 48: Global Bunker Fuel Industry Volume metric tonnes Forecast, by Country 2019 & 2032
- Table 49: Saudi Arabia Bunker Fuel Industry Revenue (Million) Forecast, by Application 2019 & 2032
- Table 50: Saudi Arabia Bunker Fuel Industry Volume (metric tonnes) Forecast, by Application 2019 & 2032
- Table 51: United Arab Emirates Bunker Fuel Industry Revenue (Million) Forecast, by Application 2019 & 2032
- Table 52: United Arab Emirates Bunker Fuel Industry Volume (metric tonnes) Forecast, by Application 2019 & 2032
- Table 53: South Africa Bunker Fuel Industry Revenue (Million) Forecast, by Application 2019 & 2032
- Table 54: South Africa Bunker Fuel Industry Volume (metric tonnes) Forecast, by Application 2019 & 2032
- Table 55: Rest of Middle East and Africa Bunker Fuel Industry Revenue (Million) Forecast, by Application 2019 & 2032
- Table 56: Rest of Middle East and Africa Bunker Fuel Industry Volume (metric tonnes) Forecast, by Application 2019 & 2032
- Table 57: Global Bunker Fuel Industry Revenue Million Forecast, by Fuel Type 2019 & 2032
- Table 58: Global Bunker Fuel Industry Volume metric tonnes Forecast, by Fuel Type 2019 & 2032
- Table 59: Global Bunker Fuel Industry Revenue Million Forecast, by Vessel Type 2019 & 2032
- Table 60: Global Bunker Fuel Industry Volume metric tonnes Forecast, by Vessel Type 2019 & 2032
- Table 61: Global Bunker Fuel Industry Revenue Million Forecast, by Country 2019 & 2032
- Table 62: Global Bunker Fuel Industry Volume metric tonnes Forecast, by Country 2019 & 2032
- Table 63: United States Bunker Fuel Industry Revenue (Million) Forecast, by Application 2019 & 2032
- Table 64: United States Bunker Fuel Industry Volume (metric tonnes) Forecast, by Application 2019 & 2032
- Table 65: Canada Bunker Fuel Industry Revenue (Million) Forecast, by Application 2019 & 2032
- Table 66: Canada Bunker Fuel Industry Volume (metric tonnes) Forecast, by Application 2019 & 2032
- Table 67: Rest of North America Bunker Fuel Industry Revenue (Million) Forecast, by Application 2019 & 2032
- Table 68: Rest of North America Bunker Fuel Industry Volume (metric tonnes) Forecast, by Application 2019 & 2032
- Table 69: Global Bunker Fuel Industry Revenue Million Forecast, by Fuel Type 2019 & 2032
- Table 70: Global Bunker Fuel Industry Volume metric tonnes Forecast, by Fuel Type 2019 & 2032
- Table 71: Global Bunker Fuel Industry Revenue Million Forecast, by Vessel Type 2019 & 2032
- Table 72: Global Bunker Fuel Industry Volume metric tonnes Forecast, by Vessel Type 2019 & 2032
- Table 73: Global Bunker Fuel Industry Revenue Million Forecast, by Country 2019 & 2032
- Table 74: Global Bunker Fuel Industry Volume metric tonnes Forecast, by Country 2019 & 2032
- Table 75: Germany Bunker Fuel Industry Revenue (Million) Forecast, by Application 2019 & 2032
- Table 76: Germany Bunker Fuel Industry Volume (metric tonnes) Forecast, by Application 2019 & 2032
- Table 77: France Bunker Fuel Industry Revenue (Million) Forecast, by Application 2019 & 2032
- Table 78: France Bunker Fuel Industry Volume (metric tonnes) Forecast, by Application 2019 & 2032
- Table 79: United Kingdom Bunker Fuel Industry Revenue (Million) Forecast, by Application 2019 & 2032
- Table 80: United Kingdom Bunker Fuel Industry Volume (metric tonnes) Forecast, by Application 2019 & 2032
- Table 81: Spain Bunker Fuel Industry Revenue (Million) Forecast, by Application 2019 & 2032
- Table 82: Spain Bunker Fuel Industry Volume (metric tonnes) Forecast, by Application 2019 & 2032
- Table 83: NORDIC Bunker Fuel Industry Revenue (Million) Forecast, by Application 2019 & 2032
- Table 84: NORDIC Bunker Fuel Industry Volume (metric tonnes) Forecast, by Application 2019 & 2032
- Table 85: Turkey Bunker Fuel Industry Revenue (Million) Forecast, by Application 2019 & 2032
- Table 86: Turkey Bunker Fuel Industry Volume (metric tonnes) Forecast, by Application 2019 & 2032
- Table 87: Russia Bunker Fuel Industry Revenue (Million) Forecast, by Application 2019 & 2032
- Table 88: Russia Bunker Fuel Industry Volume (metric tonnes) Forecast, by Application 2019 & 2032
- Table 89: Rest of Europe Bunker Fuel Industry Revenue (Million) Forecast, by Application 2019 & 2032
- Table 90: Rest of Europe Bunker Fuel Industry Volume (metric tonnes) Forecast, by Application 2019 & 2032
- Table 91: Global Bunker Fuel Industry Revenue Million Forecast, by Fuel Type 2019 & 2032
- Table 92: Global Bunker Fuel Industry Volume metric tonnes Forecast, by Fuel Type 2019 & 2032
- Table 93: Global Bunker Fuel Industry Revenue Million Forecast, by Vessel Type 2019 & 2032
- Table 94: Global Bunker Fuel Industry Volume metric tonnes Forecast, by Vessel Type 2019 & 2032
- Table 95: Global Bunker Fuel Industry Revenue Million Forecast, by Country 2019 & 2032
- Table 96: Global Bunker Fuel Industry Volume metric tonnes Forecast, by Country 2019 & 2032
- Table 97: China Bunker Fuel Industry Revenue (Million) Forecast, by Application 2019 & 2032
- Table 98: China Bunker Fuel Industry Volume (metric tonnes) Forecast, by Application 2019 & 2032
- Table 99: India Bunker Fuel Industry Revenue (Million) Forecast, by Application 2019 & 2032
- Table 100: India Bunker Fuel Industry Volume (metric tonnes) Forecast, by Application 2019 & 2032
- Table 101: Japan Bunker Fuel Industry Revenue (Million) Forecast, by Application 2019 & 2032
- Table 102: Japan Bunker Fuel Industry Volume (metric tonnes) Forecast, by Application 2019 & 2032
- Table 103: South Korea Bunker Fuel Industry Revenue (Million) Forecast, by Application 2019 & 2032
- Table 104: South Korea Bunker Fuel Industry Volume (metric tonnes) Forecast, by Application 2019 & 2032
- Table 105: Malaysia Bunker Fuel Industry Revenue (Million) Forecast, by Application 2019 & 2032
- Table 106: Malaysia Bunker Fuel Industry Volume (metric tonnes) Forecast, by Application 2019 & 2032
- Table 107: Thailand Bunker Fuel Industry Revenue (Million) Forecast, by Application 2019 & 2032
- Table 108: Thailand Bunker Fuel Industry Volume (metric tonnes) Forecast, by Application 2019 & 2032
- Table 109: Indonesia Bunker Fuel Industry Revenue (Million) Forecast, by Application 2019 & 2032
- Table 110: Indonesia Bunker Fuel Industry Volume (metric tonnes) Forecast, by Application 2019 & 2032
- Table 111: Vietnam Bunker Fuel Industry Revenue (Million) Forecast, by Application 2019 & 2032
- Table 112: Vietnam Bunker Fuel Industry Volume (metric tonnes) Forecast, by Application 2019 & 2032
- Table 113: Rest of Asia Pacific Bunker Fuel Industry Revenue (Million) Forecast, by Application 2019 & 2032
- Table 114: Rest of Asia Pacific Bunker Fuel Industry Volume (metric tonnes) Forecast, by Application 2019 & 2032
- Table 115: Global Bunker Fuel Industry Revenue Million Forecast, by Fuel Type 2019 & 2032
- Table 116: Global Bunker Fuel Industry Volume metric tonnes Forecast, by Fuel Type 2019 & 2032
- Table 117: Global Bunker Fuel Industry Revenue Million Forecast, by Vessel Type 2019 & 2032
- Table 118: Global Bunker Fuel Industry Volume metric tonnes Forecast, by Vessel Type 2019 & 2032
- Table 119: Global Bunker Fuel Industry Revenue Million Forecast, by Country 2019 & 2032
- Table 120: Global Bunker Fuel Industry Volume metric tonnes Forecast, by Country 2019 & 2032
- Table 121: Brazil Bunker Fuel Industry Revenue (Million) Forecast, by Application 2019 & 2032
- Table 122: Brazil Bunker Fuel Industry Volume (metric tonnes) Forecast, by Application 2019 & 2032
- Table 123: Argentina Bunker Fuel Industry Revenue (Million) Forecast, by Application 2019 & 2032
- Table 124: Argentina Bunker Fuel Industry Volume (metric tonnes) Forecast, by Application 2019 & 2032
- Table 125: Colombia Bunker Fuel Industry Revenue (Million) Forecast, by Application 2019 & 2032
- Table 126: Colombia Bunker Fuel Industry Volume (metric tonnes) Forecast, by Application 2019 & 2032
- Table 127: Rest of South America Bunker Fuel Industry Revenue (Million) Forecast, by Application 2019 & 2032
- Table 128: Rest of South America Bunker Fuel Industry Volume (metric tonnes) Forecast, by Application 2019 & 2032
- Table 129: Global Bunker Fuel Industry Revenue Million Forecast, by Fuel Type 2019 & 2032
- Table 130: Global Bunker Fuel Industry Volume metric tonnes Forecast, by Fuel Type 2019 & 2032
- Table 131: Global Bunker Fuel Industry Revenue Million Forecast, by Vessel Type 2019 & 2032
- Table 132: Global Bunker Fuel Industry Volume metric tonnes Forecast, by Vessel Type 2019 & 2032
- Table 133: Global Bunker Fuel Industry Revenue Million Forecast, by Country 2019 & 2032
- Table 134: Global Bunker Fuel Industry Volume metric tonnes Forecast, by Country 2019 & 2032
- Table 135: Saudi Arabia Bunker Fuel Industry Revenue (Million) Forecast, by Application 2019 & 2032
- Table 136: Saudi Arabia Bunker Fuel Industry Volume (metric tonnes) Forecast, by Application 2019 & 2032
- Table 137: United Arab Emirates Bunker Fuel Industry Revenue (Million) Forecast, by Application 2019 & 2032
- Table 138: United Arab Emirates Bunker Fuel Industry Volume (metric tonnes) Forecast, by Application 2019 & 2032
- Table 139: South Africa Bunker Fuel Industry Revenue (Million) Forecast, by Application 2019 & 2032
- Table 140: South Africa Bunker Fuel Industry Volume (metric tonnes) Forecast, by Application 2019 & 2032
- Table 141: Nigeria Bunker Fuel Industry Revenue (Million) Forecast, by Application 2019 & 2032
- Table 142: Nigeria Bunker Fuel Industry Volume (metric tonnes) Forecast, by Application 2019 & 2032
- Table 143: Qatar Bunker Fuel Industry Revenue (Million) Forecast, by Application 2019 & 2032
- Table 144: Qatar Bunker Fuel Industry Volume (metric tonnes) Forecast, by Application 2019 & 2032
- Table 145: Egypt Bunker Fuel Industry Revenue (Million) Forecast, by Application 2019 & 2032
- Table 146: Egypt Bunker Fuel Industry Volume (metric tonnes) Forecast, by Application 2019 & 2032
- Table 147: Rest of Middle East and Africa Bunker Fuel Industry Revenue (Million) Forecast, by Application 2019 & 2032
- Table 148: Rest of Middle East and Africa Bunker Fuel Industry Volume (metric tonnes) Forecast, by Application 2019 & 2032
Frequently Asked Questions
1. What is the projected Compound Annual Growth Rate (CAGR) of the Bunker Fuel Industry?
The projected CAGR is approximately 2.72%.
2. Which companies are prominent players in the Bunker Fuel Industry?
Key companies in the market include 7 Chevron Corporation, 3 Gazpromneft Marine Bunker LLC, 3 China COSCO Shipping Corporation Limited, 1 AP Moeller Maersk AS, 6 TotalEnergies SE, 2 Shell PLC, 7 Evergreen Marine Corp Taiwan Ltd, 2 Mediterranean Shipping Company SA, Ship Owners, 8 Clipper Oil, 8 Yang Ming Marine Transport Corporation, Fuel Suppliers, 6 Ocean Network Express, 9 Gulf Agency Company Ltd, 10 Pacific International Lines Pte Ltd*List Not Exhaustive, 9 HMM Co Ltd, 4 CMA CGM Group, 1 ExxonMobil Corporation, 10 Bomin Bunker Holding GmbH & Co KG, 5 PJSC Lukoil Oil Company, 5 Hapag-Lloyd AG, 4 BP PLC.
3. What are the main segments of the Bunker Fuel Industry?
The market segments include Fuel Type, Vessel Type.
4. Can you provide details about the market size?
The market size is estimated to be USD 198.07 Million as of 2022.
5. What are some drivers contributing to market growth?
4.; Increased LNG Trade Worldwide4.; Increasing Dependecies over Natural Gas for Power Generation.
6. What are the notable trends driving market growth?
LNG as a Bunker Fuel is Likely to Witness Significant Growth.
7. Are there any restraints impacting market growth?
4.; Environmental Concerns and the Strict Regulations Related to Emissions from Maritime Industry.
8. Can you provide examples of recent developments in the market?
In January 2022, Titan LNG secured the tender for the delivery of LNG in the Port of Marseille for Corsica Linea's new Ro-Pax LNG fueled ferry. This partnership indicates the expansion of Titan LNG's operation into the Mediterranean that will enhance the availability of LNG, bioLNG, and in the longer run, hydrogen-derived LNG in the region.
9. What pricing options are available for accessing the report?
Pricing options include single-user, multi-user, and enterprise licenses priced at USD 4750, USD 5250, and USD 8750 respectively.
10. Is the market size provided in terms of value or volume?
The market size is provided in terms of value, measured in Million and volume, measured in metric tonnes.
11. Are there any specific market keywords associated with the report?
Yes, the market keyword associated with the report is "Bunker Fuel Industry," which aids in identifying and referencing the specific market segment covered.
12. How do I determine which pricing option suits my needs best?
The pricing options vary based on user requirements and access needs. Individual users may opt for single-user licenses, while businesses requiring broader access may choose multi-user or enterprise licenses for cost-effective access to the report.
13. Are there any additional resources or data provided in the Bunker Fuel Industry report?
While the report offers comprehensive insights, it's advisable to review the specific contents or supplementary materials provided to ascertain if additional resources or data are available.
14. How can I stay updated on further developments or reports in the Bunker Fuel Industry?
To stay informed about further developments, trends, and reports in the Bunker Fuel Industry, consider subscribing to industry newsletters, following relevant companies and organizations, or regularly checking reputable industry news sources and publications.
Methodology
Step 1 - Identification of Relevant Samples Size from Population Database


Step 2 - Approaches for Defining Global Market Size (Value, Volume* & Price*)

Note*: In applicable scenarios
Step 3 - Data Sources
Primary Research
- Web Analytics
- Survey Reports
- Research Institute
- Latest Research Reports
- Opinion Leaders
Secondary Research
- Annual Reports
- White Paper
- Latest Press Release
- Industry Association
- Paid Database
- Investor Presentations

Step 4 - Data Triangulation
Involves using different sources of information in order to increase the validity of a study
These sources are likely to be stakeholders in a program - participants, other researchers, program staff, other community members, and so on.
Then we put all data in single framework & apply various statistical tools to find out the dynamic on the market.
During the analysis stage, feedback from the stakeholder groups would be compared to determine areas of agreement as well as areas of divergence


