
Key Insights
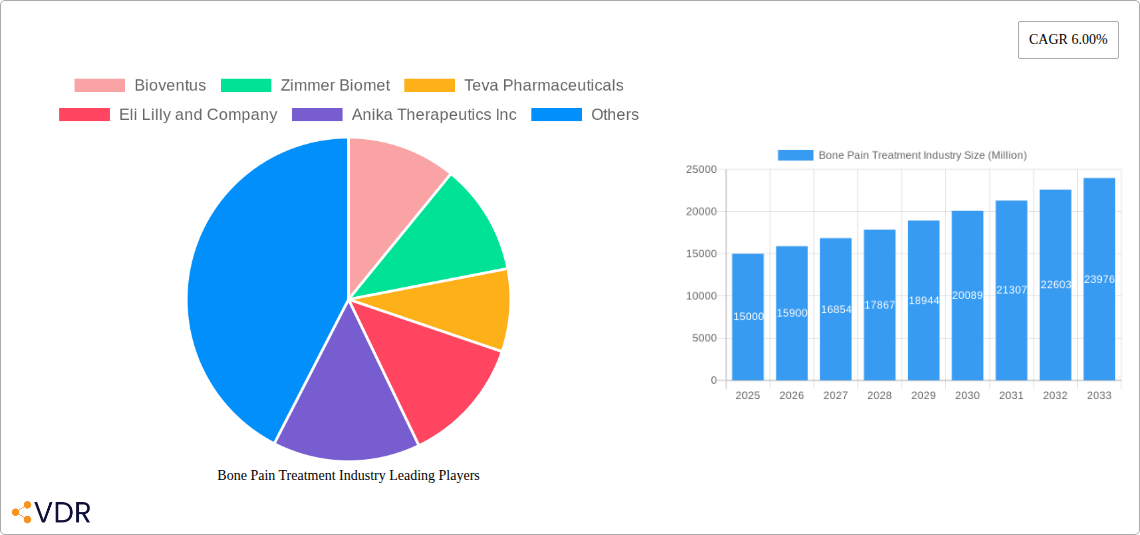
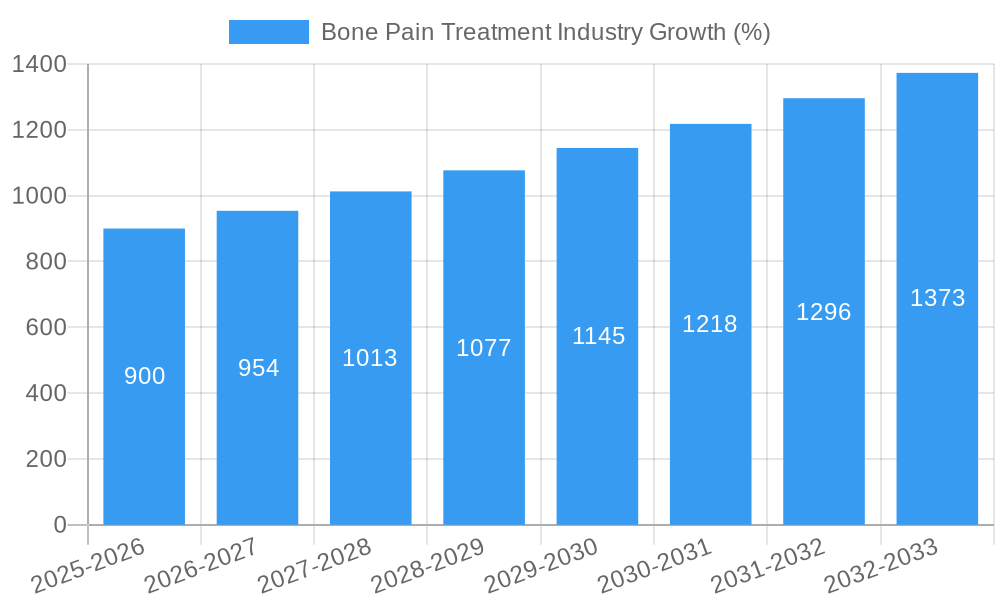
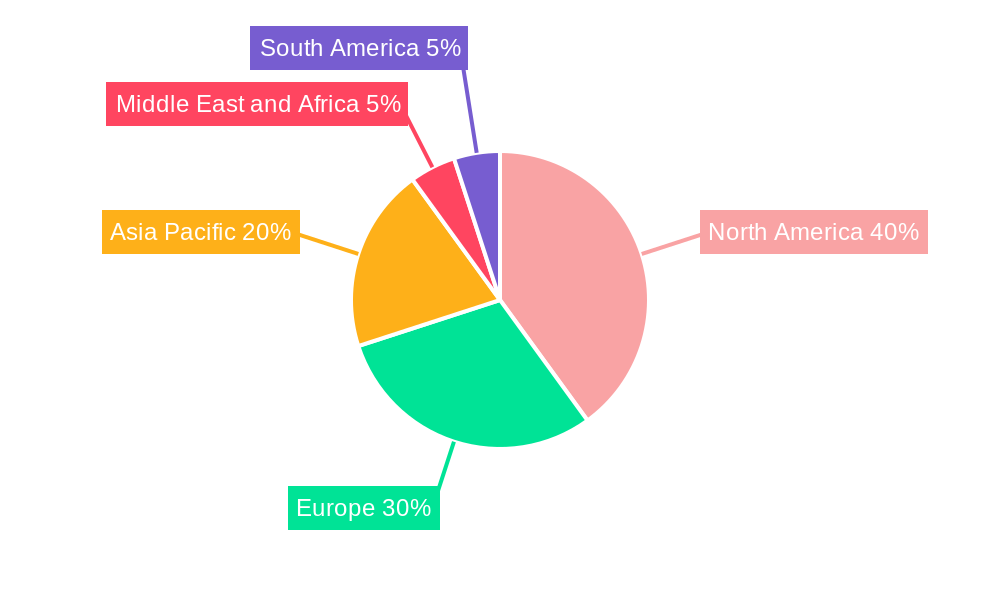
The global bone pain treatment market, currently exhibiting robust growth, is projected to expand significantly over the forecast period (2025-2033). A compound annual growth rate (CAGR) of 6.00% suggests a steady increase in market value, driven by several key factors. The aging global population, predisposed to age-related bone conditions like osteoarthritis and osteoporosis, is a major contributor to market expansion. Increased awareness of treatment options, coupled with advancements in minimally invasive procedures like steroid, hyaluronic acid, PRP, and PTM injections, are fueling demand. Furthermore, the rising prevalence of sports injuries and related bone pain is contributing to market growth, particularly in regions with high participation rates in athletic activities. The market segmentation reflects the diverse treatment approaches available, with steroid joint injections representing a substantial portion, followed by hyaluronic acid injections, reflecting the established and evolving nature of these treatments. Geographic variations exist, with North America and Europe currently holding significant market shares due to higher healthcare expenditure and advanced medical infrastructure. However, Asia-Pacific is expected to witness substantial growth in the coming years, driven by increasing healthcare awareness and rising disposable incomes. Market restraints include the high cost of advanced therapies, potential side effects associated with some injections, and variations in healthcare access across different regions.
The competitive landscape is characterized by a mix of established pharmaceutical companies and specialized medical device manufacturers. Companies like Bioventus, Zimmer Biomet, and others are actively engaged in research and development, aiming to introduce innovative and more effective bone pain treatments. Strategic partnerships and mergers & acquisitions are likely to shape the industry dynamics in the years to come. While the market is expected to witness continued growth, challenges related to regulatory approvals, pricing pressures, and the need for demonstrating long-term efficacy of newer treatments will influence market trajectory. Overall, the forecast suggests a positive outlook for the bone pain treatment market, driven by demographic shifts, technological advancements, and increasing healthcare spending globally. However, sustained growth will depend on addressing existing market challenges and continuing innovation in the development of safe and effective treatments.
Bone Pain Treatment Industry Market Report: 2019-2033
This comprehensive report provides a detailed analysis of the Bone Pain Treatment industry, encompassing market dynamics, growth trends, regional insights, and competitive landscape. The study period spans from 2019 to 2033, with 2025 serving as the base and estimated year. The report focuses on key segments, including Type of Injection (Steroid Joint Injections, Hyaluronic Acid Injections, Platelet-rich Plasma (PRP) Injections, Placental Tissue Matrix (PTM) Injections, Others) and Applications (Shoulder & Elbow, Knee & Ankle, Spinal Joints, Hip Joint, Others), offering granular insights into market size, growth rates, and future potential. The report also profiles key players such as Bioventus, Zimmer Biomet, Teva Pharmaceuticals, Eli Lilly and Company, Anika Therapeutics Inc, Flexion Therapeutics Inc, Ferring Pharmaceuticals Inc, Pfizer Inc, and Sanofi S.A., analyzing their strategies and market positions. The report is invaluable for industry professionals, investors, and researchers seeking a comprehensive understanding of this dynamic market.
Bone Pain Treatment Industry Market Dynamics & Structure
The bone pain treatment market is characterized by moderate concentration, with a few major players holding significant market share. Technological innovation, primarily in minimally invasive procedures and biologics, is a key driver, while regulatory frameworks governing drug approvals and medical device clearances play a crucial role. Competitive product substitutes, such as physical therapy and alternative medicine, also influence market dynamics. The end-user demographics are skewed towards the aging population, with osteoarthritis and other age-related conditions driving demand. M&A activity has been moderate, with strategic acquisitions aimed at expanding product portfolios and geographical reach.
- Market Concentration: Moderately concentrated, with top 5 players holding approximately xx% market share in 2025.
- Technological Innovation: Focus on minimally invasive procedures, targeted drug delivery, and regenerative medicine.
- Regulatory Landscape: Stringent regulatory approvals influence product launches and market entry.
- Competitive Substitutes: Physical therapy, alternative medicine, and pain management strategies compete for market share.
- End-User Demographics: Aging population and rising prevalence of osteoarthritis are key drivers.
- M&A Activity: Moderate activity, primarily focused on strategic acquisitions and expansion. xx deals closed between 2019 and 2024, with an estimated value of xx Million.
Bone Pain Treatment Industry Growth Trends & Insights
The bone pain treatment market exhibits a robust growth trajectory, driven by several factors. The market size is projected to expand from xx Million in 2019 to xx Million in 2025, with a Compound Annual Growth Rate (CAGR) of xx% during the historical period (2019-2024). The forecast period (2025-2033) anticipates continued expansion, reaching xx Million by 2033, with a projected CAGR of xx%. This growth is fueled by increasing prevalence of osteoarthritis and other musculoskeletal disorders, coupled with rising healthcare expenditure and technological advancements leading to more effective treatments. Consumer behavior is shifting towards minimally invasive procedures and biologics due to their perceived advantages over traditional methods. Technological disruptions, such as advancements in regenerative medicine and personalized therapies, are further propelling market growth. Market penetration of minimally invasive procedures is expected to reach xx% by 2033.
Dominant Regions, Countries, or Segments in Bone Pain Treatment Industry
North America currently dominates the bone pain treatment market, driven by high healthcare expenditure, advanced medical infrastructure, and a large aging population. Within this region, the United States holds the largest market share. Among the application segments, Knee & Ankle applications represent the largest segment, followed by Spinal Joints. In terms of injection types, Steroid Joint Injections hold the largest market share. The European market is also significant, exhibiting steady growth due to rising prevalence of musculoskeletal disorders and increasing adoption of advanced therapies.
- Key Drivers:
- High healthcare expenditure in North America and Europe.
- Growing prevalence of age-related musculoskeletal disorders.
- Increased adoption of minimally invasive procedures.
- Favorable regulatory landscape in certain regions.
- Dominant Segments:
- Application: Knee & Ankle (xx% market share in 2025).
- Type of Injection: Steroid Joint Injections (xx% market share in 2025).
Bone Pain Treatment Industry Product Landscape
The bone pain treatment market offers a diverse range of products, including steroid injections, hyaluronic acid injections, PRP injections, PTM injections, and other biologics. Recent innovations focus on improved efficacy, reduced side effects, and targeted drug delivery mechanisms. Technological advancements in regenerative medicine are paving the way for novel therapies with enhanced therapeutic potential. Key selling propositions include reduced recovery times, improved patient outcomes, and minimally invasive procedures.
Key Drivers, Barriers & Challenges in Bone Pain Treatment Industry
Key Drivers:
- Rising prevalence of osteoarthritis and other musculoskeletal disorders.
- Technological advancements in minimally invasive procedures and biologics.
- Increasing healthcare expenditure globally.
- Favorable regulatory environment in certain regions.
Key Challenges:
- High cost of advanced therapies, limiting access for some patients.
- Stringent regulatory approvals for new products.
- Potential for adverse events associated with certain treatments.
- Competition from alternative pain management therapies. The competitive landscape creates pressure on pricing and profit margins.
Emerging Opportunities in Bone Pain Treatment Industry
- Growing demand for minimally invasive procedures in emerging markets.
- Development of personalized therapies tailored to individual patient needs.
- Expanding use of regenerative medicine techniques.
- Integration of digital technologies for remote patient monitoring and treatment.
Growth Accelerators in the Bone Pain Treatment Industry
Continued innovation in drug delivery systems, regenerative medicine therapies, and personalized treatment approaches are expected to drive long-term growth. Strategic partnerships between pharmaceutical companies and medical device manufacturers can facilitate the development and commercialization of novel treatments. Expansion into emerging markets with high unmet medical needs will also contribute to market growth.
Key Players Shaping the Bone Pain Treatment Industry Market
- Bioventus
- Zimmer Biomet
- Teva Pharmaceuticals
- Eli Lilly and Company
- Anika Therapeutics Inc
- Flexion Therapeutics Inc
- Ferring Pharmaceuticals Inc
- Pfizer Inc
- Sanofi S.A
Notable Milestones in Bone Pain Treatment Industry Sector
- March 2022: Green Roads (Valens Company subsidiary) donates USD 120,000 to the Arthritis Foundation, supporting pain management initiatives.
- January 2022: AbbVie receives FDA approval for SKYRIZI (risankizumab-rzaa) for treating active psoriatic arthritis.
In-Depth Bone Pain Treatment Industry Market Outlook
The bone pain treatment market holds significant future potential, fueled by technological advancements, growing prevalence of musculoskeletal disorders, and increasing healthcare spending. Strategic collaborations, expansion into untapped markets, and development of innovative therapies will be crucial for sustained growth. The market is poised for further consolidation, with larger players likely to acquire smaller companies to broaden their product portfolios and expand their geographical reach. Focus on personalized medicine and improved patient outcomes will continue to shape the future of this market.
Bone Pain Treatment Industry Segmentation
-
1. Type of Injection
- 1.1. Steroid Joint Injections
- 1.2. Hyaluronic Acid Injections
- 1.3. Platelet-rich Plasma (PRP) Injections
- 1.4. Placental Tissue Matrix (PTM) Injections
- 1.5. Others
-
2. Applications
- 2.1. Shoulder & Elbow
- 2.2. Knee & Ankle
- 2.3. Spinal Joints
- 2.4. Hip Joint
- 2.5. Others
Bone Pain Treatment Industry Segmentation By Geography
-
1. North America
- 1.1. United States
- 1.2. Canada
- 1.3. Mexico
-
2. Europe
- 2.1. Germany
- 2.2. United Kingdom
- 2.3. France
- 2.4. Italy
- 2.5. Spain
- 2.6. Rest of Europe
-
3. Asia Pacific
- 3.1. China
- 3.2. Japan
- 3.3. India
- 3.4. Australia
- 3.5. South Korea
- 3.6. Rest of Asia Pacific
-
4. Middle East and Africa
- 4.1. GCC
- 4.2. South Africa
- 4.3. Rest of Middle East and Africa
-
5. South America
- 5.1. Brazil
- 5.2. Argentina
- 5.3. Rest of South America
Bone Pain Treatment Industry REPORT HIGHLIGHTS
| Aspects | Details |
|---|---|
| Study Period | 2019-2033 |
| Base Year | 2024 |
| Estimated Year | 2025 |
| Forecast Period | 2025-2033 |
| Historical Period | 2019-2024 |
| Growth Rate | CAGR of 6.00% from 2019-2033 |
| Segmentation |
|
Table of Contents
- 1. Introduction
- 1.1. Research Scope
- 1.2. Market Segmentation
- 1.3. Research Methodology
- 1.4. Definitions and Assumptions
- 2. Executive Summary
- 2.1. Introduction
- 3. Market Dynamics
- 3.1. Introduction
- 3.2. Market Drivers
- 3.2.1. Growing Prevalence of Arthritis and Increasing Geriatric Population Worldwide; Increasing Demand for Knee Pain Injections
- 3.3. Market Restrains
- 3.3.1. High Costs of the Injections; Reimbursement Issues
- 3.4. Market Trends
- 3.4.1. Hyaluronic Acid Injections Segment is Expected to Witness Growth Over The Forecast Period.
- 4. Market Factor Analysis
- 4.1. Porters Five Forces
- 4.2. Supply/Value Chain
- 4.3. PESTEL analysis
- 4.4. Market Entropy
- 4.5. Patent/Trademark Analysis
- 5. Global Bone Pain Treatment Industry Analysis, Insights and Forecast, 2019-2031
- 5.1. Market Analysis, Insights and Forecast - by Type of Injection
- 5.1.1. Steroid Joint Injections
- 5.1.2. Hyaluronic Acid Injections
- 5.1.3. Platelet-rich Plasma (PRP) Injections
- 5.1.4. Placental Tissue Matrix (PTM) Injections
- 5.1.5. Others
- 5.2. Market Analysis, Insights and Forecast - by Applications
- 5.2.1. Shoulder & Elbow
- 5.2.2. Knee & Ankle
- 5.2.3. Spinal Joints
- 5.2.4. Hip Joint
- 5.2.5. Others
- 5.3. Market Analysis, Insights and Forecast - by Region
- 5.3.1. North America
- 5.3.2. Europe
- 5.3.3. Asia Pacific
- 5.3.4. Middle East and Africa
- 5.3.5. South America
- 5.1. Market Analysis, Insights and Forecast - by Type of Injection
- 6. North America Bone Pain Treatment Industry Analysis, Insights and Forecast, 2019-2031
- 6.1. Market Analysis, Insights and Forecast - by Type of Injection
- 6.1.1. Steroid Joint Injections
- 6.1.2. Hyaluronic Acid Injections
- 6.1.3. Platelet-rich Plasma (PRP) Injections
- 6.1.4. Placental Tissue Matrix (PTM) Injections
- 6.1.5. Others
- 6.2. Market Analysis, Insights and Forecast - by Applications
- 6.2.1. Shoulder & Elbow
- 6.2.2. Knee & Ankle
- 6.2.3. Spinal Joints
- 6.2.4. Hip Joint
- 6.2.5. Others
- 6.1. Market Analysis, Insights and Forecast - by Type of Injection
- 7. Europe Bone Pain Treatment Industry Analysis, Insights and Forecast, 2019-2031
- 7.1. Market Analysis, Insights and Forecast - by Type of Injection
- 7.1.1. Steroid Joint Injections
- 7.1.2. Hyaluronic Acid Injections
- 7.1.3. Platelet-rich Plasma (PRP) Injections
- 7.1.4. Placental Tissue Matrix (PTM) Injections
- 7.1.5. Others
- 7.2. Market Analysis, Insights and Forecast - by Applications
- 7.2.1. Shoulder & Elbow
- 7.2.2. Knee & Ankle
- 7.2.3. Spinal Joints
- 7.2.4. Hip Joint
- 7.2.5. Others
- 7.1. Market Analysis, Insights and Forecast - by Type of Injection
- 8. Asia Pacific Bone Pain Treatment Industry Analysis, Insights and Forecast, 2019-2031
- 8.1. Market Analysis, Insights and Forecast - by Type of Injection
- 8.1.1. Steroid Joint Injections
- 8.1.2. Hyaluronic Acid Injections
- 8.1.3. Platelet-rich Plasma (PRP) Injections
- 8.1.4. Placental Tissue Matrix (PTM) Injections
- 8.1.5. Others
- 8.2. Market Analysis, Insights and Forecast - by Applications
- 8.2.1. Shoulder & Elbow
- 8.2.2. Knee & Ankle
- 8.2.3. Spinal Joints
- 8.2.4. Hip Joint
- 8.2.5. Others
- 8.1. Market Analysis, Insights and Forecast - by Type of Injection
- 9. Middle East and Africa Bone Pain Treatment Industry Analysis, Insights and Forecast, 2019-2031
- 9.1. Market Analysis, Insights and Forecast - by Type of Injection
- 9.1.1. Steroid Joint Injections
- 9.1.2. Hyaluronic Acid Injections
- 9.1.3. Platelet-rich Plasma (PRP) Injections
- 9.1.4. Placental Tissue Matrix (PTM) Injections
- 9.1.5. Others
- 9.2. Market Analysis, Insights and Forecast - by Applications
- 9.2.1. Shoulder & Elbow
- 9.2.2. Knee & Ankle
- 9.2.3. Spinal Joints
- 9.2.4. Hip Joint
- 9.2.5. Others
- 9.1. Market Analysis, Insights and Forecast - by Type of Injection
- 10. South America Bone Pain Treatment Industry Analysis, Insights and Forecast, 2019-2031
- 10.1. Market Analysis, Insights and Forecast - by Type of Injection
- 10.1.1. Steroid Joint Injections
- 10.1.2. Hyaluronic Acid Injections
- 10.1.3. Platelet-rich Plasma (PRP) Injections
- 10.1.4. Placental Tissue Matrix (PTM) Injections
- 10.1.5. Others
- 10.2. Market Analysis, Insights and Forecast - by Applications
- 10.2.1. Shoulder & Elbow
- 10.2.2. Knee & Ankle
- 10.2.3. Spinal Joints
- 10.2.4. Hip Joint
- 10.2.5. Others
- 10.1. Market Analysis, Insights and Forecast - by Type of Injection
- 11. North America Bone Pain Treatment Industry Analysis, Insights and Forecast, 2019-2031
- 11.1. Market Analysis, Insights and Forecast - By Country/Sub-region
- 11.1.1 United States
- 11.1.2 Canada
- 11.1.3 Mexico
- 12. Europe Bone Pain Treatment Industry Analysis, Insights and Forecast, 2019-2031
- 12.1. Market Analysis, Insights and Forecast - By Country/Sub-region
- 12.1.1 Germany
- 12.1.2 United Kingdom
- 12.1.3 France
- 12.1.4 Italy
- 12.1.5 Spain
- 12.1.6 Rest of Europe
- 13. Asia Pacific Bone Pain Treatment Industry Analysis, Insights and Forecast, 2019-2031
- 13.1. Market Analysis, Insights and Forecast - By Country/Sub-region
- 13.1.1 China
- 13.1.2 Japan
- 13.1.3 India
- 13.1.4 Australia
- 13.1.5 South Korea
- 13.1.6 Rest of Asia Pacific
- 14. Middle East and Africa Bone Pain Treatment Industry Analysis, Insights and Forecast, 2019-2031
- 14.1. Market Analysis, Insights and Forecast - By Country/Sub-region
- 14.1.1 GCC
- 14.1.2 South Africa
- 14.1.3 Rest of Middle East and Africa
- 15. South America Bone Pain Treatment Industry Analysis, Insights and Forecast, 2019-2031
- 15.1. Market Analysis, Insights and Forecast - By Country/Sub-region
- 15.1.1 Brazil
- 15.1.2 Argentina
- 15.1.3 Rest of South America
- 16. Competitive Analysis
- 16.1. Global Market Share Analysis 2024
- 16.2. Company Profiles
- 16.2.1 Bioventus
- 16.2.1.1. Overview
- 16.2.1.2. Products
- 16.2.1.3. SWOT Analysis
- 16.2.1.4. Recent Developments
- 16.2.1.5. Financials (Based on Availability)
- 16.2.2 Zimmer Biomet
- 16.2.2.1. Overview
- 16.2.2.2. Products
- 16.2.2.3. SWOT Analysis
- 16.2.2.4. Recent Developments
- 16.2.2.5. Financials (Based on Availability)
- 16.2.3 Teva Pharmaceuticals
- 16.2.3.1. Overview
- 16.2.3.2. Products
- 16.2.3.3. SWOT Analysis
- 16.2.3.4. Recent Developments
- 16.2.3.5. Financials (Based on Availability)
- 16.2.4 Eli Lilly and Company
- 16.2.4.1. Overview
- 16.2.4.2. Products
- 16.2.4.3. SWOT Analysis
- 16.2.4.4. Recent Developments
- 16.2.4.5. Financials (Based on Availability)
- 16.2.5 Anika Therapeutics Inc
- 16.2.5.1. Overview
- 16.2.5.2. Products
- 16.2.5.3. SWOT Analysis
- 16.2.5.4. Recent Developments
- 16.2.5.5. Financials (Based on Availability)
- 16.2.6 Flexion Therapeutics Inc
- 16.2.6.1. Overview
- 16.2.6.2. Products
- 16.2.6.3. SWOT Analysis
- 16.2.6.4. Recent Developments
- 16.2.6.5. Financials (Based on Availability)
- 16.2.7 Ferring Pharmaceuticals Inc
- 16.2.7.1. Overview
- 16.2.7.2. Products
- 16.2.7.3. SWOT Analysis
- 16.2.7.4. Recent Developments
- 16.2.7.5. Financials (Based on Availability)
- 16.2.8 Pfizer Inc
- 16.2.8.1. Overview
- 16.2.8.2. Products
- 16.2.8.3. SWOT Analysis
- 16.2.8.4. Recent Developments
- 16.2.8.5. Financials (Based on Availability)
- 16.2.9 Sanofi S A
- 16.2.9.1. Overview
- 16.2.9.2. Products
- 16.2.9.3. SWOT Analysis
- 16.2.9.4. Recent Developments
- 16.2.9.5. Financials (Based on Availability)
- 16.2.1 Bioventus
List of Figures
- Figure 1: Global Bone Pain Treatment Industry Revenue Breakdown (Million, %) by Region 2024 & 2032
- Figure 2: Global Bone Pain Treatment Industry Volume Breakdown (K Unit, %) by Region 2024 & 2032
- Figure 3: North America Bone Pain Treatment Industry Revenue (Million), by Country 2024 & 2032
- Figure 4: North America Bone Pain Treatment Industry Volume (K Unit), by Country 2024 & 2032
- Figure 5: North America Bone Pain Treatment Industry Revenue Share (%), by Country 2024 & 2032
- Figure 6: North America Bone Pain Treatment Industry Volume Share (%), by Country 2024 & 2032
- Figure 7: Europe Bone Pain Treatment Industry Revenue (Million), by Country 2024 & 2032
- Figure 8: Europe Bone Pain Treatment Industry Volume (K Unit), by Country 2024 & 2032
- Figure 9: Europe Bone Pain Treatment Industry Revenue Share (%), by Country 2024 & 2032
- Figure 10: Europe Bone Pain Treatment Industry Volume Share (%), by Country 2024 & 2032
- Figure 11: Asia Pacific Bone Pain Treatment Industry Revenue (Million), by Country 2024 & 2032
- Figure 12: Asia Pacific Bone Pain Treatment Industry Volume (K Unit), by Country 2024 & 2032
- Figure 13: Asia Pacific Bone Pain Treatment Industry Revenue Share (%), by Country 2024 & 2032
- Figure 14: Asia Pacific Bone Pain Treatment Industry Volume Share (%), by Country 2024 & 2032
- Figure 15: Middle East and Africa Bone Pain Treatment Industry Revenue (Million), by Country 2024 & 2032
- Figure 16: Middle East and Africa Bone Pain Treatment Industry Volume (K Unit), by Country 2024 & 2032
- Figure 17: Middle East and Africa Bone Pain Treatment Industry Revenue Share (%), by Country 2024 & 2032
- Figure 18: Middle East and Africa Bone Pain Treatment Industry Volume Share (%), by Country 2024 & 2032
- Figure 19: South America Bone Pain Treatment Industry Revenue (Million), by Country 2024 & 2032
- Figure 20: South America Bone Pain Treatment Industry Volume (K Unit), by Country 2024 & 2032
- Figure 21: South America Bone Pain Treatment Industry Revenue Share (%), by Country 2024 & 2032
- Figure 22: South America Bone Pain Treatment Industry Volume Share (%), by Country 2024 & 2032
- Figure 23: North America Bone Pain Treatment Industry Revenue (Million), by Type of Injection 2024 & 2032
- Figure 24: North America Bone Pain Treatment Industry Volume (K Unit), by Type of Injection 2024 & 2032
- Figure 25: North America Bone Pain Treatment Industry Revenue Share (%), by Type of Injection 2024 & 2032
- Figure 26: North America Bone Pain Treatment Industry Volume Share (%), by Type of Injection 2024 & 2032
- Figure 27: North America Bone Pain Treatment Industry Revenue (Million), by Applications 2024 & 2032
- Figure 28: North America Bone Pain Treatment Industry Volume (K Unit), by Applications 2024 & 2032
- Figure 29: North America Bone Pain Treatment Industry Revenue Share (%), by Applications 2024 & 2032
- Figure 30: North America Bone Pain Treatment Industry Volume Share (%), by Applications 2024 & 2032
- Figure 31: North America Bone Pain Treatment Industry Revenue (Million), by Country 2024 & 2032
- Figure 32: North America Bone Pain Treatment Industry Volume (K Unit), by Country 2024 & 2032
- Figure 33: North America Bone Pain Treatment Industry Revenue Share (%), by Country 2024 & 2032
- Figure 34: North America Bone Pain Treatment Industry Volume Share (%), by Country 2024 & 2032
- Figure 35: Europe Bone Pain Treatment Industry Revenue (Million), by Type of Injection 2024 & 2032
- Figure 36: Europe Bone Pain Treatment Industry Volume (K Unit), by Type of Injection 2024 & 2032
- Figure 37: Europe Bone Pain Treatment Industry Revenue Share (%), by Type of Injection 2024 & 2032
- Figure 38: Europe Bone Pain Treatment Industry Volume Share (%), by Type of Injection 2024 & 2032
- Figure 39: Europe Bone Pain Treatment Industry Revenue (Million), by Applications 2024 & 2032
- Figure 40: Europe Bone Pain Treatment Industry Volume (K Unit), by Applications 2024 & 2032
- Figure 41: Europe Bone Pain Treatment Industry Revenue Share (%), by Applications 2024 & 2032
- Figure 42: Europe Bone Pain Treatment Industry Volume Share (%), by Applications 2024 & 2032
- Figure 43: Europe Bone Pain Treatment Industry Revenue (Million), by Country 2024 & 2032
- Figure 44: Europe Bone Pain Treatment Industry Volume (K Unit), by Country 2024 & 2032
- Figure 45: Europe Bone Pain Treatment Industry Revenue Share (%), by Country 2024 & 2032
- Figure 46: Europe Bone Pain Treatment Industry Volume Share (%), by Country 2024 & 2032
- Figure 47: Asia Pacific Bone Pain Treatment Industry Revenue (Million), by Type of Injection 2024 & 2032
- Figure 48: Asia Pacific Bone Pain Treatment Industry Volume (K Unit), by Type of Injection 2024 & 2032
- Figure 49: Asia Pacific Bone Pain Treatment Industry Revenue Share (%), by Type of Injection 2024 & 2032
- Figure 50: Asia Pacific Bone Pain Treatment Industry Volume Share (%), by Type of Injection 2024 & 2032
- Figure 51: Asia Pacific Bone Pain Treatment Industry Revenue (Million), by Applications 2024 & 2032
- Figure 52: Asia Pacific Bone Pain Treatment Industry Volume (K Unit), by Applications 2024 & 2032
- Figure 53: Asia Pacific Bone Pain Treatment Industry Revenue Share (%), by Applications 2024 & 2032
- Figure 54: Asia Pacific Bone Pain Treatment Industry Volume Share (%), by Applications 2024 & 2032
- Figure 55: Asia Pacific Bone Pain Treatment Industry Revenue (Million), by Country 2024 & 2032
- Figure 56: Asia Pacific Bone Pain Treatment Industry Volume (K Unit), by Country 2024 & 2032
- Figure 57: Asia Pacific Bone Pain Treatment Industry Revenue Share (%), by Country 2024 & 2032
- Figure 58: Asia Pacific Bone Pain Treatment Industry Volume Share (%), by Country 2024 & 2032
- Figure 59: Middle East and Africa Bone Pain Treatment Industry Revenue (Million), by Type of Injection 2024 & 2032
- Figure 60: Middle East and Africa Bone Pain Treatment Industry Volume (K Unit), by Type of Injection 2024 & 2032
- Figure 61: Middle East and Africa Bone Pain Treatment Industry Revenue Share (%), by Type of Injection 2024 & 2032
- Figure 62: Middle East and Africa Bone Pain Treatment Industry Volume Share (%), by Type of Injection 2024 & 2032
- Figure 63: Middle East and Africa Bone Pain Treatment Industry Revenue (Million), by Applications 2024 & 2032
- Figure 64: Middle East and Africa Bone Pain Treatment Industry Volume (K Unit), by Applications 2024 & 2032
- Figure 65: Middle East and Africa Bone Pain Treatment Industry Revenue Share (%), by Applications 2024 & 2032
- Figure 66: Middle East and Africa Bone Pain Treatment Industry Volume Share (%), by Applications 2024 & 2032
- Figure 67: Middle East and Africa Bone Pain Treatment Industry Revenue (Million), by Country 2024 & 2032
- Figure 68: Middle East and Africa Bone Pain Treatment Industry Volume (K Unit), by Country 2024 & 2032
- Figure 69: Middle East and Africa Bone Pain Treatment Industry Revenue Share (%), by Country 2024 & 2032
- Figure 70: Middle East and Africa Bone Pain Treatment Industry Volume Share (%), by Country 2024 & 2032
- Figure 71: South America Bone Pain Treatment Industry Revenue (Million), by Type of Injection 2024 & 2032
- Figure 72: South America Bone Pain Treatment Industry Volume (K Unit), by Type of Injection 2024 & 2032
- Figure 73: South America Bone Pain Treatment Industry Revenue Share (%), by Type of Injection 2024 & 2032
- Figure 74: South America Bone Pain Treatment Industry Volume Share (%), by Type of Injection 2024 & 2032
- Figure 75: South America Bone Pain Treatment Industry Revenue (Million), by Applications 2024 & 2032
- Figure 76: South America Bone Pain Treatment Industry Volume (K Unit), by Applications 2024 & 2032
- Figure 77: South America Bone Pain Treatment Industry Revenue Share (%), by Applications 2024 & 2032
- Figure 78: South America Bone Pain Treatment Industry Volume Share (%), by Applications 2024 & 2032
- Figure 79: South America Bone Pain Treatment Industry Revenue (Million), by Country 2024 & 2032
- Figure 80: South America Bone Pain Treatment Industry Volume (K Unit), by Country 2024 & 2032
- Figure 81: South America Bone Pain Treatment Industry Revenue Share (%), by Country 2024 & 2032
- Figure 82: South America Bone Pain Treatment Industry Volume Share (%), by Country 2024 & 2032
List of Tables
- Table 1: Global Bone Pain Treatment Industry Revenue Million Forecast, by Region 2019 & 2032
- Table 2: Global Bone Pain Treatment Industry Volume K Unit Forecast, by Region 2019 & 2032
- Table 3: Global Bone Pain Treatment Industry Revenue Million Forecast, by Type of Injection 2019 & 2032
- Table 4: Global Bone Pain Treatment Industry Volume K Unit Forecast, by Type of Injection 2019 & 2032
- Table 5: Global Bone Pain Treatment Industry Revenue Million Forecast, by Applications 2019 & 2032
- Table 6: Global Bone Pain Treatment Industry Volume K Unit Forecast, by Applications 2019 & 2032
- Table 7: Global Bone Pain Treatment Industry Revenue Million Forecast, by Region 2019 & 2032
- Table 8: Global Bone Pain Treatment Industry Volume K Unit Forecast, by Region 2019 & 2032
- Table 9: Global Bone Pain Treatment Industry Revenue Million Forecast, by Country 2019 & 2032
- Table 10: Global Bone Pain Treatment Industry Volume K Unit Forecast, by Country 2019 & 2032
- Table 11: United States Bone Pain Treatment Industry Revenue (Million) Forecast, by Application 2019 & 2032
- Table 12: United States Bone Pain Treatment Industry Volume (K Unit) Forecast, by Application 2019 & 2032
- Table 13: Canada Bone Pain Treatment Industry Revenue (Million) Forecast, by Application 2019 & 2032
- Table 14: Canada Bone Pain Treatment Industry Volume (K Unit) Forecast, by Application 2019 & 2032
- Table 15: Mexico Bone Pain Treatment Industry Revenue (Million) Forecast, by Application 2019 & 2032
- Table 16: Mexico Bone Pain Treatment Industry Volume (K Unit) Forecast, by Application 2019 & 2032
- Table 17: Global Bone Pain Treatment Industry Revenue Million Forecast, by Country 2019 & 2032
- Table 18: Global Bone Pain Treatment Industry Volume K Unit Forecast, by Country 2019 & 2032
- Table 19: Germany Bone Pain Treatment Industry Revenue (Million) Forecast, by Application 2019 & 2032
- Table 20: Germany Bone Pain Treatment Industry Volume (K Unit) Forecast, by Application 2019 & 2032
- Table 21: United Kingdom Bone Pain Treatment Industry Revenue (Million) Forecast, by Application 2019 & 2032
- Table 22: United Kingdom Bone Pain Treatment Industry Volume (K Unit) Forecast, by Application 2019 & 2032
- Table 23: France Bone Pain Treatment Industry Revenue (Million) Forecast, by Application 2019 & 2032
- Table 24: France Bone Pain Treatment Industry Volume (K Unit) Forecast, by Application 2019 & 2032
- Table 25: Italy Bone Pain Treatment Industry Revenue (Million) Forecast, by Application 2019 & 2032
- Table 26: Italy Bone Pain Treatment Industry Volume (K Unit) Forecast, by Application 2019 & 2032
- Table 27: Spain Bone Pain Treatment Industry Revenue (Million) Forecast, by Application 2019 & 2032
- Table 28: Spain Bone Pain Treatment Industry Volume (K Unit) Forecast, by Application 2019 & 2032
- Table 29: Rest of Europe Bone Pain Treatment Industry Revenue (Million) Forecast, by Application 2019 & 2032
- Table 30: Rest of Europe Bone Pain Treatment Industry Volume (K Unit) Forecast, by Application 2019 & 2032
- Table 31: Global Bone Pain Treatment Industry Revenue Million Forecast, by Country 2019 & 2032
- Table 32: Global Bone Pain Treatment Industry Volume K Unit Forecast, by Country 2019 & 2032
- Table 33: China Bone Pain Treatment Industry Revenue (Million) Forecast, by Application 2019 & 2032
- Table 34: China Bone Pain Treatment Industry Volume (K Unit) Forecast, by Application 2019 & 2032
- Table 35: Japan Bone Pain Treatment Industry Revenue (Million) Forecast, by Application 2019 & 2032
- Table 36: Japan Bone Pain Treatment Industry Volume (K Unit) Forecast, by Application 2019 & 2032
- Table 37: India Bone Pain Treatment Industry Revenue (Million) Forecast, by Application 2019 & 2032
- Table 38: India Bone Pain Treatment Industry Volume (K Unit) Forecast, by Application 2019 & 2032
- Table 39: Australia Bone Pain Treatment Industry Revenue (Million) Forecast, by Application 2019 & 2032
- Table 40: Australia Bone Pain Treatment Industry Volume (K Unit) Forecast, by Application 2019 & 2032
- Table 41: South Korea Bone Pain Treatment Industry Revenue (Million) Forecast, by Application 2019 & 2032
- Table 42: South Korea Bone Pain Treatment Industry Volume (K Unit) Forecast, by Application 2019 & 2032
- Table 43: Rest of Asia Pacific Bone Pain Treatment Industry Revenue (Million) Forecast, by Application 2019 & 2032
- Table 44: Rest of Asia Pacific Bone Pain Treatment Industry Volume (K Unit) Forecast, by Application 2019 & 2032
- Table 45: Global Bone Pain Treatment Industry Revenue Million Forecast, by Country 2019 & 2032
- Table 46: Global Bone Pain Treatment Industry Volume K Unit Forecast, by Country 2019 & 2032
- Table 47: GCC Bone Pain Treatment Industry Revenue (Million) Forecast, by Application 2019 & 2032
- Table 48: GCC Bone Pain Treatment Industry Volume (K Unit) Forecast, by Application 2019 & 2032
- Table 49: South Africa Bone Pain Treatment Industry Revenue (Million) Forecast, by Application 2019 & 2032
- Table 50: South Africa Bone Pain Treatment Industry Volume (K Unit) Forecast, by Application 2019 & 2032
- Table 51: Rest of Middle East and Africa Bone Pain Treatment Industry Revenue (Million) Forecast, by Application 2019 & 2032
- Table 52: Rest of Middle East and Africa Bone Pain Treatment Industry Volume (K Unit) Forecast, by Application 2019 & 2032
- Table 53: Global Bone Pain Treatment Industry Revenue Million Forecast, by Country 2019 & 2032
- Table 54: Global Bone Pain Treatment Industry Volume K Unit Forecast, by Country 2019 & 2032
- Table 55: Brazil Bone Pain Treatment Industry Revenue (Million) Forecast, by Application 2019 & 2032
- Table 56: Brazil Bone Pain Treatment Industry Volume (K Unit) Forecast, by Application 2019 & 2032
- Table 57: Argentina Bone Pain Treatment Industry Revenue (Million) Forecast, by Application 2019 & 2032
- Table 58: Argentina Bone Pain Treatment Industry Volume (K Unit) Forecast, by Application 2019 & 2032
- Table 59: Rest of South America Bone Pain Treatment Industry Revenue (Million) Forecast, by Application 2019 & 2032
- Table 60: Rest of South America Bone Pain Treatment Industry Volume (K Unit) Forecast, by Application 2019 & 2032
- Table 61: Global Bone Pain Treatment Industry Revenue Million Forecast, by Type of Injection 2019 & 2032
- Table 62: Global Bone Pain Treatment Industry Volume K Unit Forecast, by Type of Injection 2019 & 2032
- Table 63: Global Bone Pain Treatment Industry Revenue Million Forecast, by Applications 2019 & 2032
- Table 64: Global Bone Pain Treatment Industry Volume K Unit Forecast, by Applications 2019 & 2032
- Table 65: Global Bone Pain Treatment Industry Revenue Million Forecast, by Country 2019 & 2032
- Table 66: Global Bone Pain Treatment Industry Volume K Unit Forecast, by Country 2019 & 2032
- Table 67: United States Bone Pain Treatment Industry Revenue (Million) Forecast, by Application 2019 & 2032
- Table 68: United States Bone Pain Treatment Industry Volume (K Unit) Forecast, by Application 2019 & 2032
- Table 69: Canada Bone Pain Treatment Industry Revenue (Million) Forecast, by Application 2019 & 2032
- Table 70: Canada Bone Pain Treatment Industry Volume (K Unit) Forecast, by Application 2019 & 2032
- Table 71: Mexico Bone Pain Treatment Industry Revenue (Million) Forecast, by Application 2019 & 2032
- Table 72: Mexico Bone Pain Treatment Industry Volume (K Unit) Forecast, by Application 2019 & 2032
- Table 73: Global Bone Pain Treatment Industry Revenue Million Forecast, by Type of Injection 2019 & 2032
- Table 74: Global Bone Pain Treatment Industry Volume K Unit Forecast, by Type of Injection 2019 & 2032
- Table 75: Global Bone Pain Treatment Industry Revenue Million Forecast, by Applications 2019 & 2032
- Table 76: Global Bone Pain Treatment Industry Volume K Unit Forecast, by Applications 2019 & 2032
- Table 77: Global Bone Pain Treatment Industry Revenue Million Forecast, by Country 2019 & 2032
- Table 78: Global Bone Pain Treatment Industry Volume K Unit Forecast, by Country 2019 & 2032
- Table 79: Germany Bone Pain Treatment Industry Revenue (Million) Forecast, by Application 2019 & 2032
- Table 80: Germany Bone Pain Treatment Industry Volume (K Unit) Forecast, by Application 2019 & 2032
- Table 81: United Kingdom Bone Pain Treatment Industry Revenue (Million) Forecast, by Application 2019 & 2032
- Table 82: United Kingdom Bone Pain Treatment Industry Volume (K Unit) Forecast, by Application 2019 & 2032
- Table 83: France Bone Pain Treatment Industry Revenue (Million) Forecast, by Application 2019 & 2032
- Table 84: France Bone Pain Treatment Industry Volume (K Unit) Forecast, by Application 2019 & 2032
- Table 85: Italy Bone Pain Treatment Industry Revenue (Million) Forecast, by Application 2019 & 2032
- Table 86: Italy Bone Pain Treatment Industry Volume (K Unit) Forecast, by Application 2019 & 2032
- Table 87: Spain Bone Pain Treatment Industry Revenue (Million) Forecast, by Application 2019 & 2032
- Table 88: Spain Bone Pain Treatment Industry Volume (K Unit) Forecast, by Application 2019 & 2032
- Table 89: Rest of Europe Bone Pain Treatment Industry Revenue (Million) Forecast, by Application 2019 & 2032
- Table 90: Rest of Europe Bone Pain Treatment Industry Volume (K Unit) Forecast, by Application 2019 & 2032
- Table 91: Global Bone Pain Treatment Industry Revenue Million Forecast, by Type of Injection 2019 & 2032
- Table 92: Global Bone Pain Treatment Industry Volume K Unit Forecast, by Type of Injection 2019 & 2032
- Table 93: Global Bone Pain Treatment Industry Revenue Million Forecast, by Applications 2019 & 2032
- Table 94: Global Bone Pain Treatment Industry Volume K Unit Forecast, by Applications 2019 & 2032
- Table 95: Global Bone Pain Treatment Industry Revenue Million Forecast, by Country 2019 & 2032
- Table 96: Global Bone Pain Treatment Industry Volume K Unit Forecast, by Country 2019 & 2032
- Table 97: China Bone Pain Treatment Industry Revenue (Million) Forecast, by Application 2019 & 2032
- Table 98: China Bone Pain Treatment Industry Volume (K Unit) Forecast, by Application 2019 & 2032
- Table 99: Japan Bone Pain Treatment Industry Revenue (Million) Forecast, by Application 2019 & 2032
- Table 100: Japan Bone Pain Treatment Industry Volume (K Unit) Forecast, by Application 2019 & 2032
- Table 101: India Bone Pain Treatment Industry Revenue (Million) Forecast, by Application 2019 & 2032
- Table 102: India Bone Pain Treatment Industry Volume (K Unit) Forecast, by Application 2019 & 2032
- Table 103: Australia Bone Pain Treatment Industry Revenue (Million) Forecast, by Application 2019 & 2032
- Table 104: Australia Bone Pain Treatment Industry Volume (K Unit) Forecast, by Application 2019 & 2032
- Table 105: South Korea Bone Pain Treatment Industry Revenue (Million) Forecast, by Application 2019 & 2032
- Table 106: South Korea Bone Pain Treatment Industry Volume (K Unit) Forecast, by Application 2019 & 2032
- Table 107: Rest of Asia Pacific Bone Pain Treatment Industry Revenue (Million) Forecast, by Application 2019 & 2032
- Table 108: Rest of Asia Pacific Bone Pain Treatment Industry Volume (K Unit) Forecast, by Application 2019 & 2032
- Table 109: Global Bone Pain Treatment Industry Revenue Million Forecast, by Type of Injection 2019 & 2032
- Table 110: Global Bone Pain Treatment Industry Volume K Unit Forecast, by Type of Injection 2019 & 2032
- Table 111: Global Bone Pain Treatment Industry Revenue Million Forecast, by Applications 2019 & 2032
- Table 112: Global Bone Pain Treatment Industry Volume K Unit Forecast, by Applications 2019 & 2032
- Table 113: Global Bone Pain Treatment Industry Revenue Million Forecast, by Country 2019 & 2032
- Table 114: Global Bone Pain Treatment Industry Volume K Unit Forecast, by Country 2019 & 2032
- Table 115: GCC Bone Pain Treatment Industry Revenue (Million) Forecast, by Application 2019 & 2032
- Table 116: GCC Bone Pain Treatment Industry Volume (K Unit) Forecast, by Application 2019 & 2032
- Table 117: South Africa Bone Pain Treatment Industry Revenue (Million) Forecast, by Application 2019 & 2032
- Table 118: South Africa Bone Pain Treatment Industry Volume (K Unit) Forecast, by Application 2019 & 2032
- Table 119: Rest of Middle East and Africa Bone Pain Treatment Industry Revenue (Million) Forecast, by Application 2019 & 2032
- Table 120: Rest of Middle East and Africa Bone Pain Treatment Industry Volume (K Unit) Forecast, by Application 2019 & 2032
- Table 121: Global Bone Pain Treatment Industry Revenue Million Forecast, by Type of Injection 2019 & 2032
- Table 122: Global Bone Pain Treatment Industry Volume K Unit Forecast, by Type of Injection 2019 & 2032
- Table 123: Global Bone Pain Treatment Industry Revenue Million Forecast, by Applications 2019 & 2032
- Table 124: Global Bone Pain Treatment Industry Volume K Unit Forecast, by Applications 2019 & 2032
- Table 125: Global Bone Pain Treatment Industry Revenue Million Forecast, by Country 2019 & 2032
- Table 126: Global Bone Pain Treatment Industry Volume K Unit Forecast, by Country 2019 & 2032
- Table 127: Brazil Bone Pain Treatment Industry Revenue (Million) Forecast, by Application 2019 & 2032
- Table 128: Brazil Bone Pain Treatment Industry Volume (K Unit) Forecast, by Application 2019 & 2032
- Table 129: Argentina Bone Pain Treatment Industry Revenue (Million) Forecast, by Application 2019 & 2032
- Table 130: Argentina Bone Pain Treatment Industry Volume (K Unit) Forecast, by Application 2019 & 2032
- Table 131: Rest of South America Bone Pain Treatment Industry Revenue (Million) Forecast, by Application 2019 & 2032
- Table 132: Rest of South America Bone Pain Treatment Industry Volume (K Unit) Forecast, by Application 2019 & 2032
Frequently Asked Questions
1. What is the projected Compound Annual Growth Rate (CAGR) of the Bone Pain Treatment Industry?
The projected CAGR is approximately 6.00%.
2. Which companies are prominent players in the Bone Pain Treatment Industry?
Key companies in the market include Bioventus, Zimmer Biomet, Teva Pharmaceuticals, Eli Lilly and Company, Anika Therapeutics Inc, Flexion Therapeutics Inc, Ferring Pharmaceuticals Inc, Pfizer Inc, Sanofi S A.
3. What are the main segments of the Bone Pain Treatment Industry?
The market segments include Type of Injection, Applications.
4. Can you provide details about the market size?
The market size is estimated to be USD XX Million as of 2022.
5. What are some drivers contributing to market growth?
Growing Prevalence of Arthritis and Increasing Geriatric Population Worldwide; Increasing Demand for Knee Pain Injections.
6. What are the notable trends driving market growth?
Hyaluronic Acid Injections Segment is Expected to Witness Growth Over The Forecast Period..
7. Are there any restraints impacting market growth?
High Costs of the Injections; Reimbursement Issues.
8. Can you provide examples of recent developments in the market?
In March 2022, Green Roads, a subsidiary of the Valens Company, made a USD 120,000 donation to the Arthritis Foundation in support of the organization's pain management initiative to advance the improved quality of life for those who live with chronic pain. This donation made Green Roads an official supporting sponsor of the Arthritis Foundation.
9. What pricing options are available for accessing the report?
Pricing options include single-user, multi-user, and enterprise licenses priced at USD 4750, USD 5250, and USD 8750 respectively.
10. Is the market size provided in terms of value or volume?
The market size is provided in terms of value, measured in Million and volume, measured in K Unit.
11. Are there any specific market keywords associated with the report?
Yes, the market keyword associated with the report is "Bone Pain Treatment Industry," which aids in identifying and referencing the specific market segment covered.
12. How do I determine which pricing option suits my needs best?
The pricing options vary based on user requirements and access needs. Individual users may opt for single-user licenses, while businesses requiring broader access may choose multi-user or enterprise licenses for cost-effective access to the report.
13. Are there any additional resources or data provided in the Bone Pain Treatment Industry report?
While the report offers comprehensive insights, it's advisable to review the specific contents or supplementary materials provided to ascertain if additional resources or data are available.
14. How can I stay updated on further developments or reports in the Bone Pain Treatment Industry?
To stay informed about further developments, trends, and reports in the Bone Pain Treatment Industry, consider subscribing to industry newsletters, following relevant companies and organizations, or regularly checking reputable industry news sources and publications.
Methodology
Step 1 - Identification of Relevant Samples Size from Population Database


Step 2 - Approaches for Defining Global Market Size (Value, Volume* & Price*)

Note*: In applicable scenarios
Step 3 - Data Sources
Primary Research
- Web Analytics
- Survey Reports
- Research Institute
- Latest Research Reports
- Opinion Leaders
Secondary Research
- Annual Reports
- White Paper
- Latest Press Release
- Industry Association
- Paid Database
- Investor Presentations

Step 4 - Data Triangulation
Involves using different sources of information in order to increase the validity of a study
These sources are likely to be stakeholders in a program - participants, other researchers, program staff, other community members, and so on.
Then we put all data in single framework & apply various statistical tools to find out the dynamic on the market.
During the analysis stage, feedback from the stakeholder groups would be compared to determine areas of agreement as well as areas of divergence


