
Key Insights
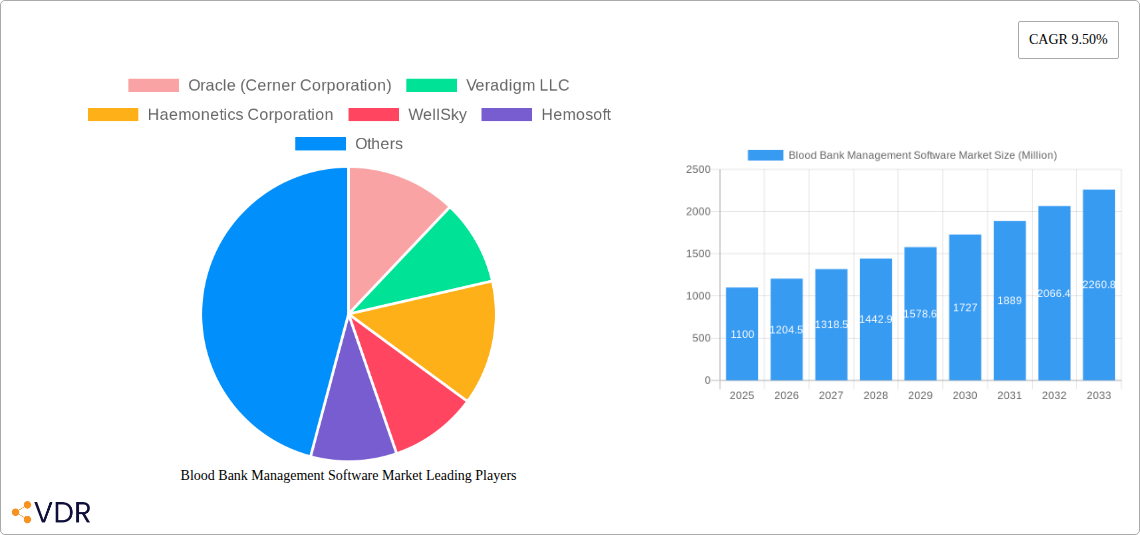
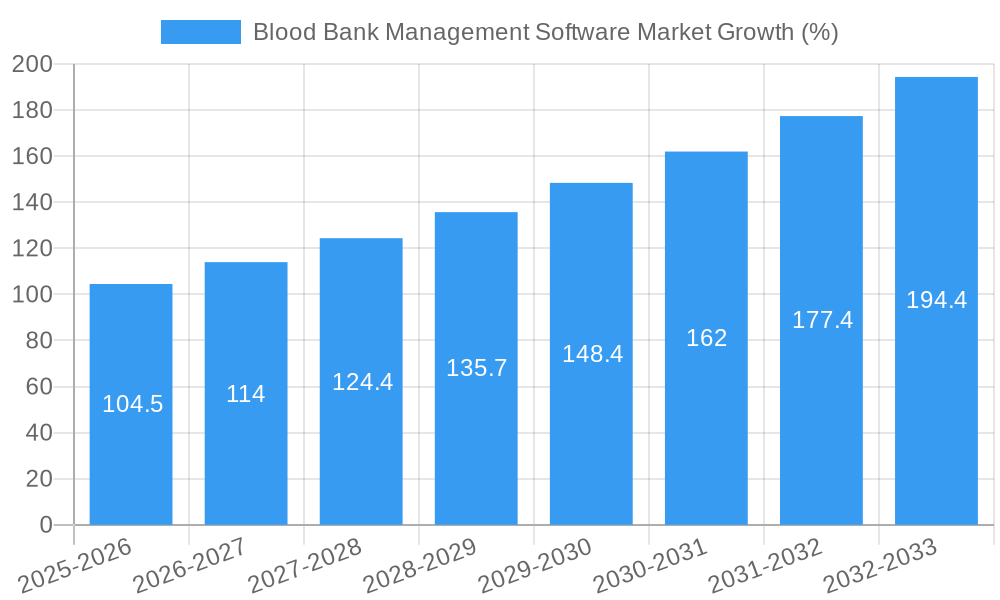
The Blood Bank Management Software market is experiencing robust growth, projected to reach $1.10 billion in 2025 and maintain a Compound Annual Growth Rate (CAGR) of 9.5% from 2025 to 2033. This expansion is driven by several key factors. The increasing prevalence of blood-related diseases necessitates efficient blood bank management, leading to greater adoption of software solutions for inventory tracking, donor management, and quality control. Furthermore, the rising demand for improved patient safety and regulatory compliance pushes healthcare providers to implement sophisticated blood bank information systems. Stringent regulations regarding blood safety and traceability are also fueling market growth, as these systems help organizations meet compliance standards and prevent medical errors. Technological advancements, such as cloud-based solutions and integration with other healthcare IT systems, enhance operational efficiency and contribute to market expansion. The market is segmented by deployment (cloud-based and on-premise), functionality (inventory management, donor management, and blood component tracking), and end-user (hospitals, blood banks, and transfusion centers). Major players like Oracle (Cerner Corporation), Veradigm LLC, and Haemonetics Corporation are driving innovation and competition within the market.
The competitive landscape is characterized by both established players and emerging companies vying for market share. Strategic partnerships, mergers, and acquisitions are common strategies employed to expand market reach and product offerings. While the market demonstrates significant potential, challenges remain, such as the high initial investment costs of implementing new software and the need for ongoing technical support and training. However, the long-term benefits in terms of efficiency, compliance, and improved patient care outweigh these initial hurdles, fueling continuous market growth. The forecast period of 2025-2033 anticipates sustained growth driven by the aforementioned factors, further solidifying the market's position as a crucial segment of the healthcare IT landscape. Future trends indicate a shift towards AI-powered solutions for enhanced blood inventory management and predictive analytics.
Blood Bank Management Software Market: A Comprehensive Report (2019-2033)
This comprehensive report provides an in-depth analysis of the Blood Bank Management Software market, encompassing market dynamics, growth trends, regional dominance, product landscape, key players, and future outlook. The report covers the historical period (2019-2024), base year (2025), and forecast period (2025-2033), offering invaluable insights for stakeholders across the healthcare IT and blood banking sectors. The parent market is Healthcare IT Software and the child market is Blood Bank Management Software. The market is valued at xx Million in 2025 and is projected to reach xx Million by 2033.
Blood Bank Management Software Market Dynamics & Structure
This section analyzes the competitive landscape, technological advancements, regulatory influences, and market trends within the Blood Bank Management Software market. The market exhibits a moderately concentrated structure with key players holding significant market share. However, the emergence of innovative startups and strategic partnerships is increasing competition.
- Market Concentration: The top 5 players hold an estimated xx% market share in 2025.
- Technological Innovation: Cloud-based solutions, AI-powered analytics, and improved integration with laboratory information systems (LIS) are driving innovation.
- Regulatory Frameworks: Compliance with HIPAA, GDPR, and other data privacy regulations significantly impacts market dynamics.
- Competitive Substitutes: Manual processes and legacy systems pose a competitive threat, although their prevalence is declining.
- End-User Demographics: Hospitals, blood banks, and transfusion centers are the primary end-users. The market is further segmented by hospital size and geographic location.
- M&A Trends: The past five years have witnessed xx M&A deals in the blood bank software space, reflecting industry consolidation and expansion. These deals have primarily focused on enhancing technological capabilities and expanding geographical reach. Innovation barriers include high development costs, stringent regulatory approvals, and the need for seamless integration with existing healthcare systems.
Blood Bank Management Software Market Growth Trends & Insights
The Blood Bank Management Software market is experiencing robust growth, driven by increasing adoption of electronic health records (EHRs), rising demand for efficient blood management systems, and a growing focus on improving patient safety. Market size is projected to witness a CAGR of xx% during the forecast period (2025-2033), with significant growth in developing economies. Technological disruptions, such as the integration of blockchain technology for enhanced traceability and AI-driven predictive analytics for inventory optimization, are accelerating market expansion. Shifts in consumer behavior, including increased demand for real-time data accessibility and personalized patient care, further contribute to growth. Market penetration is estimated at xx% in 2025 and is expected to reach xx% by 2033.
Dominant Regions, Countries, or Segments in Blood Bank Management Software Market
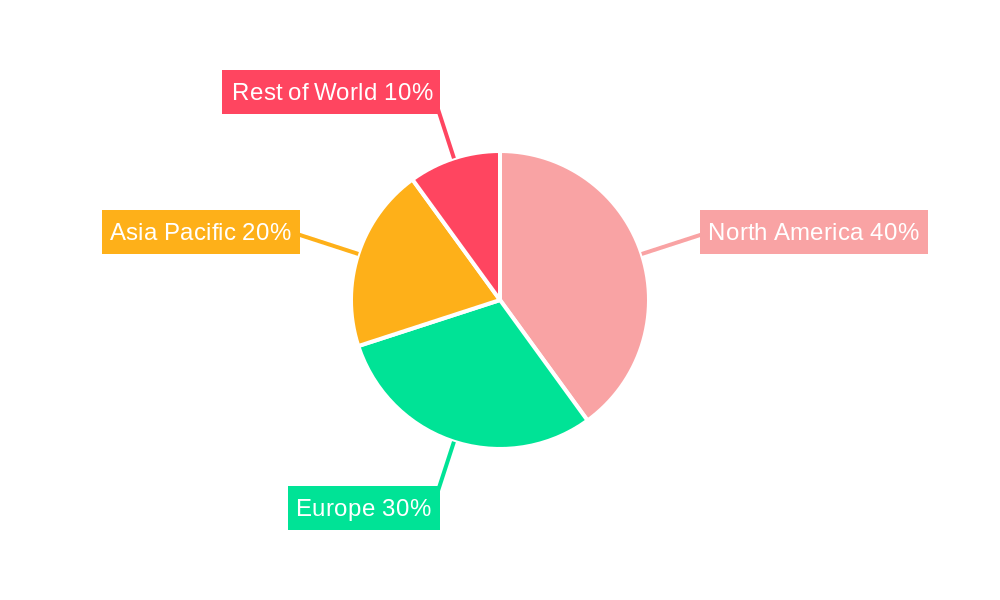
North America currently dominates the Blood Bank Management Software market, driven by high healthcare expenditure, advanced technological infrastructure, and stringent regulatory frameworks. However, the Asia-Pacific region is expected to experience the fastest growth rate during the forecast period due to rapid economic development, rising healthcare investments, and increasing adoption of advanced healthcare technologies.
- North America: High adoption rates of advanced technologies, strong regulatory support, and the presence of major market players drive market dominance.
- Europe: Stringent data privacy regulations and a mature healthcare IT infrastructure influence market growth.
- Asia-Pacific: Rapid economic development, expanding healthcare infrastructure, and a growing need for efficient blood management systems fuel market expansion.
- Rest of the World: Developing economies are witnessing gradual growth, although adoption rates are relatively lower compared to developed regions.
Blood Bank Management Software Market Product Landscape
Blood bank management software solutions range from basic inventory management systems to sophisticated platforms incorporating advanced functionalities like donor management, blood component tracking, and transfusion safety features. Key product innovations include mobile applications for real-time data access, AI-powered predictive analytics for optimized inventory management, and blockchain integration for enhanced traceability and security. Unique selling propositions include ease of use, integration capabilities, and robust security features. Technological advancements are primarily focused on improving data analytics, streamlining workflows, and enhancing patient safety.
Key Drivers, Barriers & Challenges in Blood Bank Management Software Market
Key Drivers:
- Increasing demand for efficient blood management to reduce wastage and improve supply chain efficiency.
- Rising adoption of EHRs and interoperability standards within healthcare settings.
- Government initiatives promoting the adoption of healthcare IT solutions.
- Growing focus on improving patient safety and reducing medical errors.
Challenges and Restraints:
- High implementation costs, including software licensing, hardware upgrades, and training.
- Concerns related to data security and privacy.
- Resistance to adopting new technologies among some healthcare professionals.
- Integration challenges with existing legacy systems. The estimated cost of integration and migration is xx million annually.
Emerging Opportunities in Blood Bank Management Software Market
- Expanding into untapped markets in developing countries.
- Developing specialized software solutions for niche applications, such as cord blood banking.
- Leveraging AI and machine learning to improve predictive analytics and inventory management.
- Integrating mobile technologies to enhance accessibility and real-time data monitoring.
Growth Accelerators in the Blood Bank Management Software Market Industry
Strategic partnerships between software vendors and blood banks are playing a crucial role in accelerating market growth by facilitating technology adoption and streamlining implementation processes. Technological breakthroughs, such as the integration of blockchain and AI, are creating new opportunities for innovation and market expansion. Furthermore, the expansion into new geographic markets and the development of specialized software solutions for niche applications are contributing to long-term growth.
Key Players Shaping the Blood Bank Management Software Market Market
- Oracle (Cerner Corporation)
- Veradigm LLC
- Haemonetics Corporation
- WellSky
- Hemosoft
- Integrated Medical Systems
- Soft Computer Consultants Inc
- IT Synergistics
- Sunquest Information Systems Inc
- Mediware
- *List Not Exhaustive
Notable Milestones in Blood Bank Management Software Market Sector
- November 2023: Blod.in launched Blod+, a transformative healthcare software and logistics platform for blood management and delivery in India, significantly impacting the Indian market.
- June 2023: MAK-System's strategic partnership with New York Blood Center Enterprises (NYBCe) signifies a major step towards revolutionizing blood management and delivery in the US market.
In-Depth Blood Bank Management Software Market Market Outlook
The Blood Bank Management Software market is poised for continued growth, driven by technological advancements, increasing demand for efficient blood management, and a growing focus on patient safety. Strategic partnerships, innovative product development, and expansion into untapped markets will play a crucial role in shaping the future of this market. The long-term outlook remains positive, with significant growth potential across diverse geographical regions and application areas.
Blood Bank Management Software Market Segmentation
-
1. Type
- 1.1. Blood Donor Management Module
- 1.2. Blood Bank Transfusion Service Module
- 1.3. Blood Collection and Processing Module
- 1.4. Other Types
-
2. Application Type
- 2.1. Web-based
- 2.2. Mobile-based
-
3. End User
- 3.1. Hospital
- 3.2. Blood Banks
- 3.3. Blood Processing Centers
Blood Bank Management Software Market Segmentation By Geography
-
1. North America
- 1.1. United States
- 1.2. Canada
- 1.3. Mexico
-
2. Europe
- 2.1. Germany
- 2.2. United Kingdom
- 2.3. France
- 2.4. Italy
- 2.5. Spain
- 2.6. Rest of Europe
-
3. Asia Pacific
- 3.1. China
- 3.2. Japan
- 3.3. India
- 3.4. Australia
- 3.5. South Korea
- 3.6. Rest of Asia Pacific
- 4. Rest of the World
Blood Bank Management Software Market REPORT HIGHLIGHTS
| Aspects | Details |
|---|---|
| Study Period | 2019-2033 |
| Base Year | 2024 |
| Estimated Year | 2025 |
| Forecast Period | 2025-2033 |
| Historical Period | 2019-2024 |
| Growth Rate | CAGR of 9.50% from 2019-2033 |
| Segmentation |
|
Table of Contents
- 1. Introduction
- 1.1. Research Scope
- 1.2. Market Segmentation
- 1.3. Research Methodology
- 1.4. Definitions and Assumptions
- 2. Executive Summary
- 2.1. Introduction
- 3. Market Dynamics
- 3.1. Introduction
- 3.2. Market Drivers
- 3.2.1. Increasing Number of Blood Donors and High Prevalence of Hematologic Diseases; Technological Advancements in Blood Banking Technology
- 3.3. Market Restrains
- 3.3.1. Increasing Number of Blood Donors and High Prevalence of Hematologic Diseases; Technological Advancements in Blood Banking Technology
- 3.4. Market Trends
- 3.4.1. The Blood Banks Segment is Expected to Register Significant Growth in the Market During the Forecast Period
- 4. Market Factor Analysis
- 4.1. Porters Five Forces
- 4.2. Supply/Value Chain
- 4.3. PESTEL analysis
- 4.4. Market Entropy
- 4.5. Patent/Trademark Analysis
- 5. Global Blood Bank Management Software Market Analysis, Insights and Forecast, 2019-2031
- 5.1. Market Analysis, Insights and Forecast - by Type
- 5.1.1. Blood Donor Management Module
- 5.1.2. Blood Bank Transfusion Service Module
- 5.1.3. Blood Collection and Processing Module
- 5.1.4. Other Types
- 5.2. Market Analysis, Insights and Forecast - by Application Type
- 5.2.1. Web-based
- 5.2.2. Mobile-based
- 5.3. Market Analysis, Insights and Forecast - by End User
- 5.3.1. Hospital
- 5.3.2. Blood Banks
- 5.3.3. Blood Processing Centers
- 5.4. Market Analysis, Insights and Forecast - by Region
- 5.4.1. North America
- 5.4.2. Europe
- 5.4.3. Asia Pacific
- 5.4.4. Rest of the World
- 5.1. Market Analysis, Insights and Forecast - by Type
- 6. North America Blood Bank Management Software Market Analysis, Insights and Forecast, 2019-2031
- 6.1. Market Analysis, Insights and Forecast - by Type
- 6.1.1. Blood Donor Management Module
- 6.1.2. Blood Bank Transfusion Service Module
- 6.1.3. Blood Collection and Processing Module
- 6.1.4. Other Types
- 6.2. Market Analysis, Insights and Forecast - by Application Type
- 6.2.1. Web-based
- 6.2.2. Mobile-based
- 6.3. Market Analysis, Insights and Forecast - by End User
- 6.3.1. Hospital
- 6.3.2. Blood Banks
- 6.3.3. Blood Processing Centers
- 6.1. Market Analysis, Insights and Forecast - by Type
- 7. Europe Blood Bank Management Software Market Analysis, Insights and Forecast, 2019-2031
- 7.1. Market Analysis, Insights and Forecast - by Type
- 7.1.1. Blood Donor Management Module
- 7.1.2. Blood Bank Transfusion Service Module
- 7.1.3. Blood Collection and Processing Module
- 7.1.4. Other Types
- 7.2. Market Analysis, Insights and Forecast - by Application Type
- 7.2.1. Web-based
- 7.2.2. Mobile-based
- 7.3. Market Analysis, Insights and Forecast - by End User
- 7.3.1. Hospital
- 7.3.2. Blood Banks
- 7.3.3. Blood Processing Centers
- 7.1. Market Analysis, Insights and Forecast - by Type
- 8. Asia Pacific Blood Bank Management Software Market Analysis, Insights and Forecast, 2019-2031
- 8.1. Market Analysis, Insights and Forecast - by Type
- 8.1.1. Blood Donor Management Module
- 8.1.2. Blood Bank Transfusion Service Module
- 8.1.3. Blood Collection and Processing Module
- 8.1.4. Other Types
- 8.2. Market Analysis, Insights and Forecast - by Application Type
- 8.2.1. Web-based
- 8.2.2. Mobile-based
- 8.3. Market Analysis, Insights and Forecast - by End User
- 8.3.1. Hospital
- 8.3.2. Blood Banks
- 8.3.3. Blood Processing Centers
- 8.1. Market Analysis, Insights and Forecast - by Type
- 9. Rest of the World Blood Bank Management Software Market Analysis, Insights and Forecast, 2019-2031
- 9.1. Market Analysis, Insights and Forecast - by Type
- 9.1.1. Blood Donor Management Module
- 9.1.2. Blood Bank Transfusion Service Module
- 9.1.3. Blood Collection and Processing Module
- 9.1.4. Other Types
- 9.2. Market Analysis, Insights and Forecast - by Application Type
- 9.2.1. Web-based
- 9.2.2. Mobile-based
- 9.3. Market Analysis, Insights and Forecast - by End User
- 9.3.1. Hospital
- 9.3.2. Blood Banks
- 9.3.3. Blood Processing Centers
- 9.1. Market Analysis, Insights and Forecast - by Type
- 10. Competitive Analysis
- 10.1. Global Market Share Analysis 2024
- 10.2. Company Profiles
- 10.2.1 Oracle (Cerner Corporation)
- 10.2.1.1. Overview
- 10.2.1.2. Products
- 10.2.1.3. SWOT Analysis
- 10.2.1.4. Recent Developments
- 10.2.1.5. Financials (Based on Availability)
- 10.2.2 Veradigm LLC
- 10.2.2.1. Overview
- 10.2.2.2. Products
- 10.2.2.3. SWOT Analysis
- 10.2.2.4. Recent Developments
- 10.2.2.5. Financials (Based on Availability)
- 10.2.3 Haemonetics Corporation
- 10.2.3.1. Overview
- 10.2.3.2. Products
- 10.2.3.3. SWOT Analysis
- 10.2.3.4. Recent Developments
- 10.2.3.5. Financials (Based on Availability)
- 10.2.4 WellSky
- 10.2.4.1. Overview
- 10.2.4.2. Products
- 10.2.4.3. SWOT Analysis
- 10.2.4.4. Recent Developments
- 10.2.4.5. Financials (Based on Availability)
- 10.2.5 Hemosoft
- 10.2.5.1. Overview
- 10.2.5.2. Products
- 10.2.5.3. SWOT Analysis
- 10.2.5.4. Recent Developments
- 10.2.5.5. Financials (Based on Availability)
- 10.2.6 Integrated Medical Systems
- 10.2.6.1. Overview
- 10.2.6.2. Products
- 10.2.6.3. SWOT Analysis
- 10.2.6.4. Recent Developments
- 10.2.6.5. Financials (Based on Availability)
- 10.2.7 Soft Computer Consultants Inc
- 10.2.7.1. Overview
- 10.2.7.2. Products
- 10.2.7.3. SWOT Analysis
- 10.2.7.4. Recent Developments
- 10.2.7.5. Financials (Based on Availability)
- 10.2.8 IT Synergistics
- 10.2.8.1. Overview
- 10.2.8.2. Products
- 10.2.8.3. SWOT Analysis
- 10.2.8.4. Recent Developments
- 10.2.8.5. Financials (Based on Availability)
- 10.2.9 Sunquest Information Systems Inc
- 10.2.9.1. Overview
- 10.2.9.2. Products
- 10.2.9.3. SWOT Analysis
- 10.2.9.4. Recent Developments
- 10.2.9.5. Financials (Based on Availability)
- 10.2.10 Mediware*List Not Exhaustive
- 10.2.10.1. Overview
- 10.2.10.2. Products
- 10.2.10.3. SWOT Analysis
- 10.2.10.4. Recent Developments
- 10.2.10.5. Financials (Based on Availability)
- 10.2.1 Oracle (Cerner Corporation)
List of Figures
- Figure 1: Global Blood Bank Management Software Market Revenue Breakdown (Million, %) by Region 2024 & 2032
- Figure 2: Global Blood Bank Management Software Market Volume Breakdown (Billion, %) by Region 2024 & 2032
- Figure 3: North America Blood Bank Management Software Market Revenue (Million), by Type 2024 & 2032
- Figure 4: North America Blood Bank Management Software Market Volume (Billion), by Type 2024 & 2032
- Figure 5: North America Blood Bank Management Software Market Revenue Share (%), by Type 2024 & 2032
- Figure 6: North America Blood Bank Management Software Market Volume Share (%), by Type 2024 & 2032
- Figure 7: North America Blood Bank Management Software Market Revenue (Million), by Application Type 2024 & 2032
- Figure 8: North America Blood Bank Management Software Market Volume (Billion), by Application Type 2024 & 2032
- Figure 9: North America Blood Bank Management Software Market Revenue Share (%), by Application Type 2024 & 2032
- Figure 10: North America Blood Bank Management Software Market Volume Share (%), by Application Type 2024 & 2032
- Figure 11: North America Blood Bank Management Software Market Revenue (Million), by End User 2024 & 2032
- Figure 12: North America Blood Bank Management Software Market Volume (Billion), by End User 2024 & 2032
- Figure 13: North America Blood Bank Management Software Market Revenue Share (%), by End User 2024 & 2032
- Figure 14: North America Blood Bank Management Software Market Volume Share (%), by End User 2024 & 2032
- Figure 15: North America Blood Bank Management Software Market Revenue (Million), by Country 2024 & 2032
- Figure 16: North America Blood Bank Management Software Market Volume (Billion), by Country 2024 & 2032
- Figure 17: North America Blood Bank Management Software Market Revenue Share (%), by Country 2024 & 2032
- Figure 18: North America Blood Bank Management Software Market Volume Share (%), by Country 2024 & 2032
- Figure 19: Europe Blood Bank Management Software Market Revenue (Million), by Type 2024 & 2032
- Figure 20: Europe Blood Bank Management Software Market Volume (Billion), by Type 2024 & 2032
- Figure 21: Europe Blood Bank Management Software Market Revenue Share (%), by Type 2024 & 2032
- Figure 22: Europe Blood Bank Management Software Market Volume Share (%), by Type 2024 & 2032
- Figure 23: Europe Blood Bank Management Software Market Revenue (Million), by Application Type 2024 & 2032
- Figure 24: Europe Blood Bank Management Software Market Volume (Billion), by Application Type 2024 & 2032
- Figure 25: Europe Blood Bank Management Software Market Revenue Share (%), by Application Type 2024 & 2032
- Figure 26: Europe Blood Bank Management Software Market Volume Share (%), by Application Type 2024 & 2032
- Figure 27: Europe Blood Bank Management Software Market Revenue (Million), by End User 2024 & 2032
- Figure 28: Europe Blood Bank Management Software Market Volume (Billion), by End User 2024 & 2032
- Figure 29: Europe Blood Bank Management Software Market Revenue Share (%), by End User 2024 & 2032
- Figure 30: Europe Blood Bank Management Software Market Volume Share (%), by End User 2024 & 2032
- Figure 31: Europe Blood Bank Management Software Market Revenue (Million), by Country 2024 & 2032
- Figure 32: Europe Blood Bank Management Software Market Volume (Billion), by Country 2024 & 2032
- Figure 33: Europe Blood Bank Management Software Market Revenue Share (%), by Country 2024 & 2032
- Figure 34: Europe Blood Bank Management Software Market Volume Share (%), by Country 2024 & 2032
- Figure 35: Asia Pacific Blood Bank Management Software Market Revenue (Million), by Type 2024 & 2032
- Figure 36: Asia Pacific Blood Bank Management Software Market Volume (Billion), by Type 2024 & 2032
- Figure 37: Asia Pacific Blood Bank Management Software Market Revenue Share (%), by Type 2024 & 2032
- Figure 38: Asia Pacific Blood Bank Management Software Market Volume Share (%), by Type 2024 & 2032
- Figure 39: Asia Pacific Blood Bank Management Software Market Revenue (Million), by Application Type 2024 & 2032
- Figure 40: Asia Pacific Blood Bank Management Software Market Volume (Billion), by Application Type 2024 & 2032
- Figure 41: Asia Pacific Blood Bank Management Software Market Revenue Share (%), by Application Type 2024 & 2032
- Figure 42: Asia Pacific Blood Bank Management Software Market Volume Share (%), by Application Type 2024 & 2032
- Figure 43: Asia Pacific Blood Bank Management Software Market Revenue (Million), by End User 2024 & 2032
- Figure 44: Asia Pacific Blood Bank Management Software Market Volume (Billion), by End User 2024 & 2032
- Figure 45: Asia Pacific Blood Bank Management Software Market Revenue Share (%), by End User 2024 & 2032
- Figure 46: Asia Pacific Blood Bank Management Software Market Volume Share (%), by End User 2024 & 2032
- Figure 47: Asia Pacific Blood Bank Management Software Market Revenue (Million), by Country 2024 & 2032
- Figure 48: Asia Pacific Blood Bank Management Software Market Volume (Billion), by Country 2024 & 2032
- Figure 49: Asia Pacific Blood Bank Management Software Market Revenue Share (%), by Country 2024 & 2032
- Figure 50: Asia Pacific Blood Bank Management Software Market Volume Share (%), by Country 2024 & 2032
- Figure 51: Rest of the World Blood Bank Management Software Market Revenue (Million), by Type 2024 & 2032
- Figure 52: Rest of the World Blood Bank Management Software Market Volume (Billion), by Type 2024 & 2032
- Figure 53: Rest of the World Blood Bank Management Software Market Revenue Share (%), by Type 2024 & 2032
- Figure 54: Rest of the World Blood Bank Management Software Market Volume Share (%), by Type 2024 & 2032
- Figure 55: Rest of the World Blood Bank Management Software Market Revenue (Million), by Application Type 2024 & 2032
- Figure 56: Rest of the World Blood Bank Management Software Market Volume (Billion), by Application Type 2024 & 2032
- Figure 57: Rest of the World Blood Bank Management Software Market Revenue Share (%), by Application Type 2024 & 2032
- Figure 58: Rest of the World Blood Bank Management Software Market Volume Share (%), by Application Type 2024 & 2032
- Figure 59: Rest of the World Blood Bank Management Software Market Revenue (Million), by End User 2024 & 2032
- Figure 60: Rest of the World Blood Bank Management Software Market Volume (Billion), by End User 2024 & 2032
- Figure 61: Rest of the World Blood Bank Management Software Market Revenue Share (%), by End User 2024 & 2032
- Figure 62: Rest of the World Blood Bank Management Software Market Volume Share (%), by End User 2024 & 2032
- Figure 63: Rest of the World Blood Bank Management Software Market Revenue (Million), by Country 2024 & 2032
- Figure 64: Rest of the World Blood Bank Management Software Market Volume (Billion), by Country 2024 & 2032
- Figure 65: Rest of the World Blood Bank Management Software Market Revenue Share (%), by Country 2024 & 2032
- Figure 66: Rest of the World Blood Bank Management Software Market Volume Share (%), by Country 2024 & 2032
List of Tables
- Table 1: Global Blood Bank Management Software Market Revenue Million Forecast, by Region 2019 & 2032
- Table 2: Global Blood Bank Management Software Market Volume Billion Forecast, by Region 2019 & 2032
- Table 3: Global Blood Bank Management Software Market Revenue Million Forecast, by Type 2019 & 2032
- Table 4: Global Blood Bank Management Software Market Volume Billion Forecast, by Type 2019 & 2032
- Table 5: Global Blood Bank Management Software Market Revenue Million Forecast, by Application Type 2019 & 2032
- Table 6: Global Blood Bank Management Software Market Volume Billion Forecast, by Application Type 2019 & 2032
- Table 7: Global Blood Bank Management Software Market Revenue Million Forecast, by End User 2019 & 2032
- Table 8: Global Blood Bank Management Software Market Volume Billion Forecast, by End User 2019 & 2032
- Table 9: Global Blood Bank Management Software Market Revenue Million Forecast, by Region 2019 & 2032
- Table 10: Global Blood Bank Management Software Market Volume Billion Forecast, by Region 2019 & 2032
- Table 11: Global Blood Bank Management Software Market Revenue Million Forecast, by Type 2019 & 2032
- Table 12: Global Blood Bank Management Software Market Volume Billion Forecast, by Type 2019 & 2032
- Table 13: Global Blood Bank Management Software Market Revenue Million Forecast, by Application Type 2019 & 2032
- Table 14: Global Blood Bank Management Software Market Volume Billion Forecast, by Application Type 2019 & 2032
- Table 15: Global Blood Bank Management Software Market Revenue Million Forecast, by End User 2019 & 2032
- Table 16: Global Blood Bank Management Software Market Volume Billion Forecast, by End User 2019 & 2032
- Table 17: Global Blood Bank Management Software Market Revenue Million Forecast, by Country 2019 & 2032
- Table 18: Global Blood Bank Management Software Market Volume Billion Forecast, by Country 2019 & 2032
- Table 19: United States Blood Bank Management Software Market Revenue (Million) Forecast, by Application 2019 & 2032
- Table 20: United States Blood Bank Management Software Market Volume (Billion) Forecast, by Application 2019 & 2032
- Table 21: Canada Blood Bank Management Software Market Revenue (Million) Forecast, by Application 2019 & 2032
- Table 22: Canada Blood Bank Management Software Market Volume (Billion) Forecast, by Application 2019 & 2032
- Table 23: Mexico Blood Bank Management Software Market Revenue (Million) Forecast, by Application 2019 & 2032
- Table 24: Mexico Blood Bank Management Software Market Volume (Billion) Forecast, by Application 2019 & 2032
- Table 25: Global Blood Bank Management Software Market Revenue Million Forecast, by Type 2019 & 2032
- Table 26: Global Blood Bank Management Software Market Volume Billion Forecast, by Type 2019 & 2032
- Table 27: Global Blood Bank Management Software Market Revenue Million Forecast, by Application Type 2019 & 2032
- Table 28: Global Blood Bank Management Software Market Volume Billion Forecast, by Application Type 2019 & 2032
- Table 29: Global Blood Bank Management Software Market Revenue Million Forecast, by End User 2019 & 2032
- Table 30: Global Blood Bank Management Software Market Volume Billion Forecast, by End User 2019 & 2032
- Table 31: Global Blood Bank Management Software Market Revenue Million Forecast, by Country 2019 & 2032
- Table 32: Global Blood Bank Management Software Market Volume Billion Forecast, by Country 2019 & 2032
- Table 33: Germany Blood Bank Management Software Market Revenue (Million) Forecast, by Application 2019 & 2032
- Table 34: Germany Blood Bank Management Software Market Volume (Billion) Forecast, by Application 2019 & 2032
- Table 35: United Kingdom Blood Bank Management Software Market Revenue (Million) Forecast, by Application 2019 & 2032
- Table 36: United Kingdom Blood Bank Management Software Market Volume (Billion) Forecast, by Application 2019 & 2032
- Table 37: France Blood Bank Management Software Market Revenue (Million) Forecast, by Application 2019 & 2032
- Table 38: France Blood Bank Management Software Market Volume (Billion) Forecast, by Application 2019 & 2032
- Table 39: Italy Blood Bank Management Software Market Revenue (Million) Forecast, by Application 2019 & 2032
- Table 40: Italy Blood Bank Management Software Market Volume (Billion) Forecast, by Application 2019 & 2032
- Table 41: Spain Blood Bank Management Software Market Revenue (Million) Forecast, by Application 2019 & 2032
- Table 42: Spain Blood Bank Management Software Market Volume (Billion) Forecast, by Application 2019 & 2032
- Table 43: Rest of Europe Blood Bank Management Software Market Revenue (Million) Forecast, by Application 2019 & 2032
- Table 44: Rest of Europe Blood Bank Management Software Market Volume (Billion) Forecast, by Application 2019 & 2032
- Table 45: Global Blood Bank Management Software Market Revenue Million Forecast, by Type 2019 & 2032
- Table 46: Global Blood Bank Management Software Market Volume Billion Forecast, by Type 2019 & 2032
- Table 47: Global Blood Bank Management Software Market Revenue Million Forecast, by Application Type 2019 & 2032
- Table 48: Global Blood Bank Management Software Market Volume Billion Forecast, by Application Type 2019 & 2032
- Table 49: Global Blood Bank Management Software Market Revenue Million Forecast, by End User 2019 & 2032
- Table 50: Global Blood Bank Management Software Market Volume Billion Forecast, by End User 2019 & 2032
- Table 51: Global Blood Bank Management Software Market Revenue Million Forecast, by Country 2019 & 2032
- Table 52: Global Blood Bank Management Software Market Volume Billion Forecast, by Country 2019 & 2032
- Table 53: China Blood Bank Management Software Market Revenue (Million) Forecast, by Application 2019 & 2032
- Table 54: China Blood Bank Management Software Market Volume (Billion) Forecast, by Application 2019 & 2032
- Table 55: Japan Blood Bank Management Software Market Revenue (Million) Forecast, by Application 2019 & 2032
- Table 56: Japan Blood Bank Management Software Market Volume (Billion) Forecast, by Application 2019 & 2032
- Table 57: India Blood Bank Management Software Market Revenue (Million) Forecast, by Application 2019 & 2032
- Table 58: India Blood Bank Management Software Market Volume (Billion) Forecast, by Application 2019 & 2032
- Table 59: Australia Blood Bank Management Software Market Revenue (Million) Forecast, by Application 2019 & 2032
- Table 60: Australia Blood Bank Management Software Market Volume (Billion) Forecast, by Application 2019 & 2032
- Table 61: South Korea Blood Bank Management Software Market Revenue (Million) Forecast, by Application 2019 & 2032
- Table 62: South Korea Blood Bank Management Software Market Volume (Billion) Forecast, by Application 2019 & 2032
- Table 63: Rest of Asia Pacific Blood Bank Management Software Market Revenue (Million) Forecast, by Application 2019 & 2032
- Table 64: Rest of Asia Pacific Blood Bank Management Software Market Volume (Billion) Forecast, by Application 2019 & 2032
- Table 65: Global Blood Bank Management Software Market Revenue Million Forecast, by Type 2019 & 2032
- Table 66: Global Blood Bank Management Software Market Volume Billion Forecast, by Type 2019 & 2032
- Table 67: Global Blood Bank Management Software Market Revenue Million Forecast, by Application Type 2019 & 2032
- Table 68: Global Blood Bank Management Software Market Volume Billion Forecast, by Application Type 2019 & 2032
- Table 69: Global Blood Bank Management Software Market Revenue Million Forecast, by End User 2019 & 2032
- Table 70: Global Blood Bank Management Software Market Volume Billion Forecast, by End User 2019 & 2032
- Table 71: Global Blood Bank Management Software Market Revenue Million Forecast, by Country 2019 & 2032
- Table 72: Global Blood Bank Management Software Market Volume Billion Forecast, by Country 2019 & 2032
Frequently Asked Questions
1. What is the projected Compound Annual Growth Rate (CAGR) of the Blood Bank Management Software Market?
The projected CAGR is approximately 9.50%.
2. Which companies are prominent players in the Blood Bank Management Software Market?
Key companies in the market include Oracle (Cerner Corporation), Veradigm LLC, Haemonetics Corporation, WellSky, Hemosoft, Integrated Medical Systems, Soft Computer Consultants Inc, IT Synergistics, Sunquest Information Systems Inc, Mediware*List Not Exhaustive.
3. What are the main segments of the Blood Bank Management Software Market?
The market segments include Type, Application Type, End User.
4. Can you provide details about the market size?
The market size is estimated to be USD 1.10 Million as of 2022.
5. What are some drivers contributing to market growth?
Increasing Number of Blood Donors and High Prevalence of Hematologic Diseases; Technological Advancements in Blood Banking Technology.
6. What are the notable trends driving market growth?
The Blood Banks Segment is Expected to Register Significant Growth in the Market During the Forecast Period.
7. Are there any restraints impacting market growth?
Increasing Number of Blood Donors and High Prevalence of Hematologic Diseases; Technological Advancements in Blood Banking Technology.
8. Can you provide examples of recent developments in the market?
November 2023: Blod.in launched Blod+, a transformative healthcare software and logistics platform for blood management and delivery in India.
9. What pricing options are available for accessing the report?
Pricing options include single-user, multi-user, and enterprise licenses priced at USD 4750, USD 5250, and USD 8750 respectively.
10. Is the market size provided in terms of value or volume?
The market size is provided in terms of value, measured in Million and volume, measured in Billion.
11. Are there any specific market keywords associated with the report?
Yes, the market keyword associated with the report is "Blood Bank Management Software Market," which aids in identifying and referencing the specific market segment covered.
12. How do I determine which pricing option suits my needs best?
The pricing options vary based on user requirements and access needs. Individual users may opt for single-user licenses, while businesses requiring broader access may choose multi-user or enterprise licenses for cost-effective access to the report.
13. Are there any additional resources or data provided in the Blood Bank Management Software Market report?
While the report offers comprehensive insights, it's advisable to review the specific contents or supplementary materials provided to ascertain if additional resources or data are available.
14. How can I stay updated on further developments or reports in the Blood Bank Management Software Market?
To stay informed about further developments, trends, and reports in the Blood Bank Management Software Market, consider subscribing to industry newsletters, following relevant companies and organizations, or regularly checking reputable industry news sources and publications.
Methodology
Step 1 - Identification of Relevant Samples Size from Population Database


Step 2 - Approaches for Defining Global Market Size (Value, Volume* & Price*)

Note*: In applicable scenarios
Step 3 - Data Sources
Primary Research
- Web Analytics
- Survey Reports
- Research Institute
- Latest Research Reports
- Opinion Leaders
Secondary Research
- Annual Reports
- White Paper
- Latest Press Release
- Industry Association
- Paid Database
- Investor Presentations

Step 4 - Data Triangulation
Involves using different sources of information in order to increase the validity of a study
These sources are likely to be stakeholders in a program - participants, other researchers, program staff, other community members, and so on.
Then we put all data in single framework & apply various statistical tools to find out the dynamic on the market.
During the analysis stage, feedback from the stakeholder groups would be compared to determine areas of agreement as well as areas of divergence


