
Key Insights
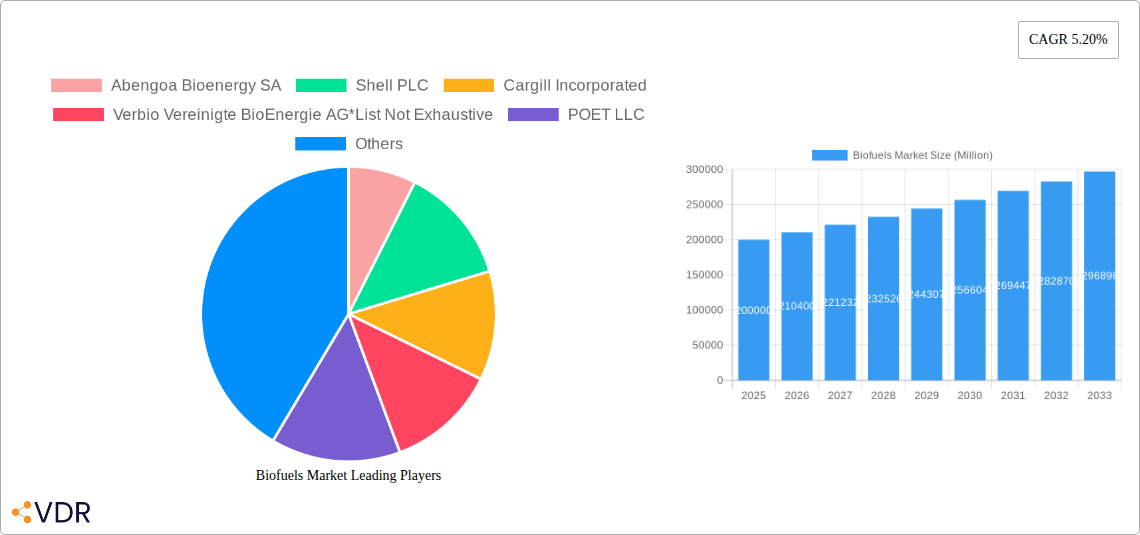
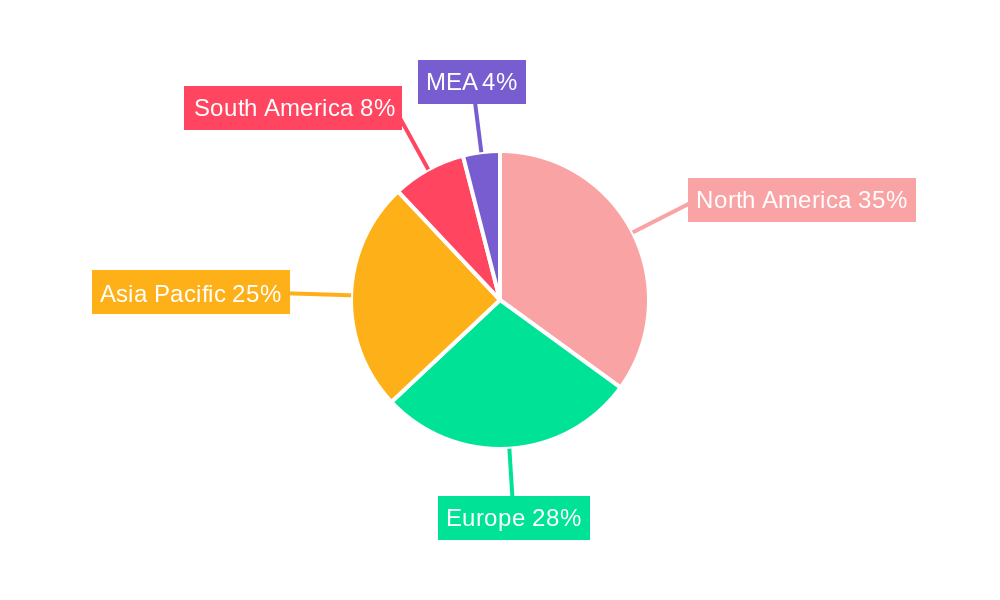
The global biofuels market is experiencing robust growth, projected to reach a substantial size driven by increasing concerns about climate change and the need for sustainable energy sources. The market's 5.20% CAGR from 2019-2033 indicates a significant expansion over the forecast period. Several factors contribute to this growth, including supportive government policies promoting renewable energy adoption, rising crude oil prices making biofuels a more cost-competitive alternative, and growing consumer demand for environmentally friendly products. Key market segments include ethanol and biodiesel fuel types, with feedstocks like palm oil, jatropha, and sugar crops playing significant roles. While palm oil currently dominates, concerns about its environmental impact are driving exploration and adoption of alternative feedstocks like sugar crops and coarse grains, which are more sustainable and better align with environmental regulations. Geopolitically, North America and Europe currently hold the largest market shares, however, the Asia-Pacific region is anticipated to witness the fastest growth due to rising energy demand and government initiatives focusing on biofuel production. Major players like Abengoa Bioenergy SA, Shell PLC, and Cargill Incorporated are strategically investing in research and development, expanding production capacities, and exploring new feedstock options to capitalize on this expanding market.
The market, however, faces some constraints. These include the volatility of feedstock prices, land use concerns associated with large-scale biofuel production, and technological limitations hindering the efficiency and cost-effectiveness of certain biofuel processes. Overcoming these challenges will require technological advancements, improved feedstock management practices, and the development of sustainable and efficient biofuel production processes. Furthermore, the successful integration of biofuels into existing fuel infrastructure and supply chains will be critical to ensuring widespread adoption and market penetration. Despite these challenges, the long-term outlook for the biofuels market remains optimistic, driven by the urgent need for cleaner energy solutions and a favorable regulatory environment. The continuous innovation in feedstock technologies and biofuel production methods promises to further enhance the sustainability and economic viability of biofuels in the coming years.
Biofuels Market Report: A Comprehensive Analysis (2019-2033)
This comprehensive report provides an in-depth analysis of the global biofuels market, encompassing market dynamics, growth trends, regional dominance, product landscape, key players, and future outlook. With a study period spanning 2019-2033, a base year of 2025, and a forecast period of 2025-2033, this report is an indispensable resource for industry professionals, investors, and stakeholders seeking to understand and capitalize on the burgeoning biofuels sector. The report analyzes the parent market of renewable energy and the child market of biofuels, providing a granular view of market segmentation by fuel type (ethanol, biodiesel, other fuel types) and feedstock (palm oil, jatropha, sugar crop, coarse grain, other feedstock). The market size is valued in million units.
Biofuels Market Dynamics & Structure
The global biofuels market is characterized by a moderately concentrated landscape, with key players such as Abengoa Bioenergy SA, Shell PLC, Cargill Incorporated, Verbio Vereinigte BioEnergie AG, POET LLC, Archer Daniels Midland Company, Neste Oyj, Wilmar International Ltd, Renewable Energy Group Inc, and BP PLC holding significant market share. Technological innovation, particularly in second-generation biofuels and advanced biofuels, is a key driver. Stringent environmental regulations and government incentives are further propelling market growth. However, the market faces challenges from competitive pressures from fossil fuels, fluctuations in feedstock prices, and land-use concerns. The report details M&A activities, quantifying deal volumes in the last five years (xx Million deals) and analyzing their impact on market structure.
- Market Concentration: Moderately concentrated, with top 10 players accounting for xx% of market share in 2024.
- Technological Innovation: Focus on 2G biofuels and advanced biofuels utilizing waste streams and non-food feedstocks.
- Regulatory Framework: Government policies and mandates promoting renewable energy adoption play a crucial role.
- Competitive Substitutes: Fossil fuels remain a major competitor, with ongoing price volatility impacting market dynamics.
- End-User Demographics: Primarily transportation, power generation, and industrial sectors.
- M&A Trends: Consolidation is occurring, with xx major M&A deals observed in the period 2019-2024 (estimated).
Biofuels Market Growth Trends & Insights
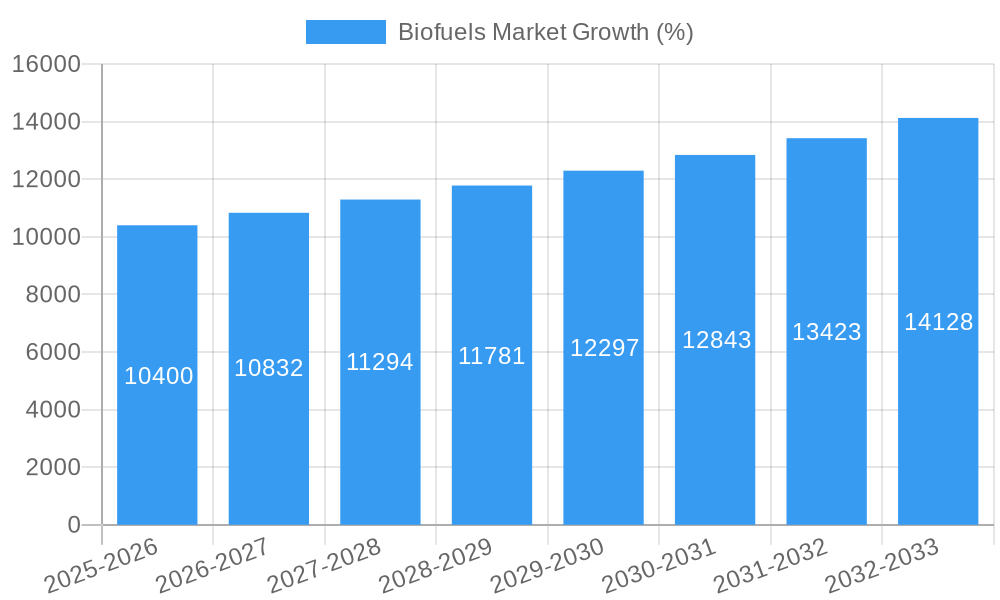
The biofuels market experienced significant growth between 2019 and 2024, with a Compound Annual Growth Rate (CAGR) of xx%. Driven by increasing demand for renewable energy, stringent environmental regulations, and technological advancements, the market is projected to maintain a robust growth trajectory through 2033, reaching xx Million units by 2033, with a CAGR of xx% during the forecast period. This growth is fueled by rising adoption rates in the transportation sector and expansion into new applications, such as sustainable aviation fuel (SAF). Market penetration in key regions is also growing at a rapid rate, with specific regions such as [mention a specific region] exceeding xx% penetration in 2024. Consumer behavior shifts towards environmentally friendly products are further accelerating market adoption. The report delves into detailed regional and application-specific growth trends using data analytics and modelling.
Dominant Regions, Countries, or Segments in Biofuels Market
The [Specify the dominant region, e.g., North America/Europe] region currently dominates the biofuels market, holding the largest market share of xx% in 2024, followed by [Specify the second dominant region, e.g., Asia-Pacific] with xx%. Within fuel types, ethanol leads the market with xx% market share in 2024, driven by established production infrastructure and supportive government policies in key regions like the US and Brazil. The biodiesel segment is also exhibiting robust growth, fueled by rising demand from the transportation sector.
- Key Drivers:
- Favorable government policies and subsidies for renewable energy.
- Well-established infrastructure for ethanol production in key regions.
- Growing demand from transportation and industrial sectors.
- Dominance Factors:
- Large-scale production capacity.
- Availability of feedstock.
- Supportive government regulations.
Biofuels Market Product Landscape
The biofuels market offers a diverse range of products, including ethanol derived from corn, sugarcane, and other feedstocks, biodiesel produced from vegetable oils and animal fats, and other advanced biofuels like SAF and renewable diesel. Recent technological advancements have focused on enhancing the efficiency and sustainability of biofuel production, with second-generation biofuels gaining traction, which use non-food feedstocks like agricultural waste and used cooking oils. The focus is on improving energy content and reducing environmental footprint, with various life-cycle assessments conducted to support this aspect of biofuel production.
Key Drivers, Barriers & Challenges in Biofuels Market
Key Drivers:
- Increasing government regulations and mandates promoting renewable energy use.
- Growing environmental concerns and the need to reduce greenhouse gas emissions.
- Technological advancements leading to cost-effective and efficient biofuel production.
- Rising demand for sustainable transportation fuels, particularly SAF.
Key Challenges and Restraints:
- Fluctuations in feedstock prices can significantly impact the profitability of biofuel production.
- Competition from fossil fuels remains a significant barrier.
- Land use concerns and sustainability issues associated with certain feedstocks need to be addressed.
- The availability of suitable feedstock sources can pose a challenge in some regions. This can affect the production cost and market share of biofuel producers in different geographic locations.
Emerging Opportunities in Biofuels Market
Emerging opportunities in the biofuels market include the development of advanced biofuels from various non-food feedstocks (such as algae, waste streams) and the expansion into new applications like sustainable aviation fuels (SAF) and green chemicals. Moreover, the exploration of new biofuel technologies and partnerships with other energy sectors can further open up market opportunities for biofuel producers and stakeholders. Additionally, the focus on improving the sustainability credentials and reducing the environmental impact of biofuels are opening up new market opportunities.
Growth Accelerators in the Biofuels Market Industry
The long-term growth of the biofuels market will be significantly driven by technological advancements leading to cost-competitive and efficient biofuel production processes, sustainable feedstock development, and strategic partnerships between biofuel producers and energy companies and governments. Government support is also a pivotal aspect of market growth, with both financial and regulatory incentives pushing the market forward. Furthermore, expansion of market reach into currently untapped markets will be key in accelerating long-term growth.
Key Players Shaping the Biofuels Market Market
- Abengoa Bioenergy SA
- Shell PLC
- Cargill Incorporated
- Verbio Vereinigte BioEnergie AG
- POET LLC
- Archer Daniels Midland Company
- Neste Oyj
- Wilmar International Ltd
- Renewable Energy Group Inc
- BP PLC
Notable Milestones in Biofuels Market Sector
- April 2023: Cepsa awarded a contract for the engineering, procurement, and construction management support of a second-generation (2G) biofuels plant in southern Europe to Técnicas Reunidas. This plant will have a capacity of approximately 500,000 tons of renewable diesel and SAF annually. This indicates a significant investment in advanced biofuel production.
- January 2023: Zagros Petrochemical Company and Dalian Petrochemical Company agreed to establish a methanol-to-synthetic ethanol conversion plant in Iran. This plant, with a capacity of 300,000 tons, will mark Iran's entry into ethanol production, potentially changing the regional dynamics of the biofuel market.
In-Depth Biofuels Market Outlook
The biofuels market is poised for significant growth in the coming years, driven by supportive government policies, technological innovations, and rising consumer demand for sustainable energy sources. The shift towards advanced biofuels, utilizing diverse and sustainable feedstocks, will be key to long-term success. Strategic partnerships and investments in research and development will be crucial in unlocking the full potential of this sector and ensuring long-term growth and profitability. This market presents substantial opportunities for companies that can innovate, secure sustainable supply chains, and effectively navigate evolving regulatory landscapes.
Biofuels Market Segmentation
-
1. Fuel Type
- 1.1. Ethanol
- 1.2. Biodiesel
- 1.3. Other Fuel Types
-
2. Feedstock
- 2.1. Palm Oil
- 2.2. Jatropha
- 2.3. Sugar Crop
- 2.4. Coarse Grain
- 2.5. Other Feedstock
Biofuels Market Segmentation By Geography
-
1. North America
- 1.1. United States of America
- 1.2. Canada
- 1.3. Rest of North America
-
2. Europe
- 2.1. Germany
- 2.2. United Kingdom
- 2.3. Denmark
- 2.4. Rest of Europe
-
3. Asia Pacific
- 3.1. China
- 3.2. India
- 3.3. Indonesia
- 3.4. Rest of Asia Pacific
-
4. South America
- 4.1. Brazil
- 4.2. Argentina
- 4.3. Chile
- 4.4. Rest of South America
-
5. Middle East and Africa
- 5.1. United Arab Emirates
- 5.2. Saudi Arabia
- 5.3. South Africa
- 5.4. Rest of Middle East and Africa
Biofuels Market REPORT HIGHLIGHTS
| Aspects | Details |
|---|---|
| Study Period | 2019-2033 |
| Base Year | 2024 |
| Estimated Year | 2025 |
| Forecast Period | 2025-2033 |
| Historical Period | 2019-2024 |
| Growth Rate | CAGR of 5.20% from 2019-2033 |
| Segmentation |
|
Table of Contents
- 1. Introduction
- 1.1. Research Scope
- 1.2. Market Segmentation
- 1.3. Research Methodology
- 1.4. Definitions and Assumptions
- 2. Executive Summary
- 2.1. Introduction
- 3. Market Dynamics
- 3.1. Introduction
- 3.2. Market Drivers
- 3.2.1 4.; Increasing Demand for Secure
- 3.2.2 Sustainable
- 3.2.3 and Clean Energy
- 3.3. Market Restrains
- 3.3.1. 4.; High Cost of Production of Biofuels
- 3.4. Market Trends
- 3.4.1. Ethanol Likely to Experience a Significant Growth
- 4. Market Factor Analysis
- 4.1. Porters Five Forces
- 4.2. Supply/Value Chain
- 4.3. PESTEL analysis
- 4.4. Market Entropy
- 4.5. Patent/Trademark Analysis
- 5. Global Biofuels Market Analysis, Insights and Forecast, 2019-2031
- 5.1. Market Analysis, Insights and Forecast - by Fuel Type
- 5.1.1. Ethanol
- 5.1.2. Biodiesel
- 5.1.3. Other Fuel Types
- 5.2. Market Analysis, Insights and Forecast - by Feedstock
- 5.2.1. Palm Oil
- 5.2.2. Jatropha
- 5.2.3. Sugar Crop
- 5.2.4. Coarse Grain
- 5.2.5. Other Feedstock
- 5.3. Market Analysis, Insights and Forecast - by Region
- 5.3.1. North America
- 5.3.2. Europe
- 5.3.3. Asia Pacific
- 5.3.4. South America
- 5.3.5. Middle East and Africa
- 5.1. Market Analysis, Insights and Forecast - by Fuel Type
- 6. North America Biofuels Market Analysis, Insights and Forecast, 2019-2031
- 6.1. Market Analysis, Insights and Forecast - by Fuel Type
- 6.1.1. Ethanol
- 6.1.2. Biodiesel
- 6.1.3. Other Fuel Types
- 6.2. Market Analysis, Insights and Forecast - by Feedstock
- 6.2.1. Palm Oil
- 6.2.2. Jatropha
- 6.2.3. Sugar Crop
- 6.2.4. Coarse Grain
- 6.2.5. Other Feedstock
- 6.1. Market Analysis, Insights and Forecast - by Fuel Type
- 7. Europe Biofuels Market Analysis, Insights and Forecast, 2019-2031
- 7.1. Market Analysis, Insights and Forecast - by Fuel Type
- 7.1.1. Ethanol
- 7.1.2. Biodiesel
- 7.1.3. Other Fuel Types
- 7.2. Market Analysis, Insights and Forecast - by Feedstock
- 7.2.1. Palm Oil
- 7.2.2. Jatropha
- 7.2.3. Sugar Crop
- 7.2.4. Coarse Grain
- 7.2.5. Other Feedstock
- 7.1. Market Analysis, Insights and Forecast - by Fuel Type
- 8. Asia Pacific Biofuels Market Analysis, Insights and Forecast, 2019-2031
- 8.1. Market Analysis, Insights and Forecast - by Fuel Type
- 8.1.1. Ethanol
- 8.1.2. Biodiesel
- 8.1.3. Other Fuel Types
- 8.2. Market Analysis, Insights and Forecast - by Feedstock
- 8.2.1. Palm Oil
- 8.2.2. Jatropha
- 8.2.3. Sugar Crop
- 8.2.4. Coarse Grain
- 8.2.5. Other Feedstock
- 8.1. Market Analysis, Insights and Forecast - by Fuel Type
- 9. South America Biofuels Market Analysis, Insights and Forecast, 2019-2031
- 9.1. Market Analysis, Insights and Forecast - by Fuel Type
- 9.1.1. Ethanol
- 9.1.2. Biodiesel
- 9.1.3. Other Fuel Types
- 9.2. Market Analysis, Insights and Forecast - by Feedstock
- 9.2.1. Palm Oil
- 9.2.2. Jatropha
- 9.2.3. Sugar Crop
- 9.2.4. Coarse Grain
- 9.2.5. Other Feedstock
- 9.1. Market Analysis, Insights and Forecast - by Fuel Type
- 10. Middle East and Africa Biofuels Market Analysis, Insights and Forecast, 2019-2031
- 10.1. Market Analysis, Insights and Forecast - by Fuel Type
- 10.1.1. Ethanol
- 10.1.2. Biodiesel
- 10.1.3. Other Fuel Types
- 10.2. Market Analysis, Insights and Forecast - by Feedstock
- 10.2.1. Palm Oil
- 10.2.2. Jatropha
- 10.2.3. Sugar Crop
- 10.2.4. Coarse Grain
- 10.2.5. Other Feedstock
- 10.1. Market Analysis, Insights and Forecast - by Fuel Type
- 11. North America Biofuels Market Analysis, Insights and Forecast, 2019-2031
- 11.1. Market Analysis, Insights and Forecast - By Country/Sub-region
- 11.1.1 United States
- 11.1.2 Canada
- 11.1.3 Mexico
- 12. Europe Biofuels Market Analysis, Insights and Forecast, 2019-2031
- 12.1. Market Analysis, Insights and Forecast - By Country/Sub-region
- 12.1.1 Germany
- 12.1.2 United Kingdom
- 12.1.3 France
- 12.1.4 Spain
- 12.1.5 Italy
- 12.1.6 Spain
- 12.1.7 Belgium
- 12.1.8 Netherland
- 12.1.9 Nordics
- 12.1.10 Rest of Europe
- 13. Asia Pacific Biofuels Market Analysis, Insights and Forecast, 2019-2031
- 13.1. Market Analysis, Insights and Forecast - By Country/Sub-region
- 13.1.1 China
- 13.1.2 Japan
- 13.1.3 India
- 13.1.4 South Korea
- 13.1.5 Southeast Asia
- 13.1.6 Australia
- 13.1.7 Indonesia
- 13.1.8 Phillipes
- 13.1.9 Singapore
- 13.1.10 Thailandc
- 13.1.11 Rest of Asia Pacific
- 14. South America Biofuels Market Analysis, Insights and Forecast, 2019-2031
- 14.1. Market Analysis, Insights and Forecast - By Country/Sub-region
- 14.1.1 Brazil
- 14.1.2 Argentina
- 14.1.3 Peru
- 14.1.4 Chile
- 14.1.5 Colombia
- 14.1.6 Ecuador
- 14.1.7 Venezuela
- 14.1.8 Rest of South America
- 15. North America Biofuels Market Analysis, Insights and Forecast, 2019-2031
- 15.1. Market Analysis, Insights and Forecast - By Country/Sub-region
- 15.1.1 United States
- 15.1.2 Canada
- 15.1.3 Mexico
- 16. MEA Biofuels Market Analysis, Insights and Forecast, 2019-2031
- 16.1. Market Analysis, Insights and Forecast - By Country/Sub-region
- 16.1.1 United Arab Emirates
- 16.1.2 Saudi Arabia
- 16.1.3 South Africa
- 16.1.4 Rest of Middle East and Africa
- 17. Competitive Analysis
- 17.1. Global Market Share Analysis 2024
- 17.2. Company Profiles
- 17.2.1 Abengoa Bioenergy SA
- 17.2.1.1. Overview
- 17.2.1.2. Products
- 17.2.1.3. SWOT Analysis
- 17.2.1.4. Recent Developments
- 17.2.1.5. Financials (Based on Availability)
- 17.2.2 Shell PLC
- 17.2.2.1. Overview
- 17.2.2.2. Products
- 17.2.2.3. SWOT Analysis
- 17.2.2.4. Recent Developments
- 17.2.2.5. Financials (Based on Availability)
- 17.2.3 Cargill Incorporated
- 17.2.3.1. Overview
- 17.2.3.2. Products
- 17.2.3.3. SWOT Analysis
- 17.2.3.4. Recent Developments
- 17.2.3.5. Financials (Based on Availability)
- 17.2.4 Verbio Vereinigte BioEnergie AG*List Not Exhaustive
- 17.2.4.1. Overview
- 17.2.4.2. Products
- 17.2.4.3. SWOT Analysis
- 17.2.4.4. Recent Developments
- 17.2.4.5. Financials (Based on Availability)
- 17.2.5 POET LLC
- 17.2.5.1. Overview
- 17.2.5.2. Products
- 17.2.5.3. SWOT Analysis
- 17.2.5.4. Recent Developments
- 17.2.5.5. Financials (Based on Availability)
- 17.2.6 Archer Daniels Midland Company
- 17.2.6.1. Overview
- 17.2.6.2. Products
- 17.2.6.3. SWOT Analysis
- 17.2.6.4. Recent Developments
- 17.2.6.5. Financials (Based on Availability)
- 17.2.7 Neste Oyj
- 17.2.7.1. Overview
- 17.2.7.2. Products
- 17.2.7.3. SWOT Analysis
- 17.2.7.4. Recent Developments
- 17.2.7.5. Financials (Based on Availability)
- 17.2.8 Wilmar International Ltd
- 17.2.8.1. Overview
- 17.2.8.2. Products
- 17.2.8.3. SWOT Analysis
- 17.2.8.4. Recent Developments
- 17.2.8.5. Financials (Based on Availability)
- 17.2.9 Renewable Energy Group Inc
- 17.2.9.1. Overview
- 17.2.9.2. Products
- 17.2.9.3. SWOT Analysis
- 17.2.9.4. Recent Developments
- 17.2.9.5. Financials (Based on Availability)
- 17.2.10 BP PLC
- 17.2.10.1. Overview
- 17.2.10.2. Products
- 17.2.10.3. SWOT Analysis
- 17.2.10.4. Recent Developments
- 17.2.10.5. Financials (Based on Availability)
- 17.2.1 Abengoa Bioenergy SA
List of Figures
- Figure 1: Global Biofuels Market Revenue Breakdown (Million, %) by Region 2024 & 2032
- Figure 2: Global Biofuels Market Volume Breakdown (Million, %) by Region 2024 & 2032
- Figure 3: North America Biofuels Market Revenue (Million), by Country 2024 & 2032
- Figure 4: North America Biofuels Market Volume (Million), by Country 2024 & 2032
- Figure 5: North America Biofuels Market Revenue Share (%), by Country 2024 & 2032
- Figure 6: North America Biofuels Market Volume Share (%), by Country 2024 & 2032
- Figure 7: Europe Biofuels Market Revenue (Million), by Country 2024 & 2032
- Figure 8: Europe Biofuels Market Volume (Million), by Country 2024 & 2032
- Figure 9: Europe Biofuels Market Revenue Share (%), by Country 2024 & 2032
- Figure 10: Europe Biofuels Market Volume Share (%), by Country 2024 & 2032
- Figure 11: Asia Pacific Biofuels Market Revenue (Million), by Country 2024 & 2032
- Figure 12: Asia Pacific Biofuels Market Volume (Million), by Country 2024 & 2032
- Figure 13: Asia Pacific Biofuels Market Revenue Share (%), by Country 2024 & 2032
- Figure 14: Asia Pacific Biofuels Market Volume Share (%), by Country 2024 & 2032
- Figure 15: South America Biofuels Market Revenue (Million), by Country 2024 & 2032
- Figure 16: South America Biofuels Market Volume (Million), by Country 2024 & 2032
- Figure 17: South America Biofuels Market Revenue Share (%), by Country 2024 & 2032
- Figure 18: South America Biofuels Market Volume Share (%), by Country 2024 & 2032
- Figure 19: North America Biofuels Market Revenue (Million), by Country 2024 & 2032
- Figure 20: North America Biofuels Market Volume (Million), by Country 2024 & 2032
- Figure 21: North America Biofuels Market Revenue Share (%), by Country 2024 & 2032
- Figure 22: North America Biofuels Market Volume Share (%), by Country 2024 & 2032
- Figure 23: MEA Biofuels Market Revenue (Million), by Country 2024 & 2032
- Figure 24: MEA Biofuels Market Volume (Million), by Country 2024 & 2032
- Figure 25: MEA Biofuels Market Revenue Share (%), by Country 2024 & 2032
- Figure 26: MEA Biofuels Market Volume Share (%), by Country 2024 & 2032
- Figure 27: North America Biofuels Market Revenue (Million), by Fuel Type 2024 & 2032
- Figure 28: North America Biofuels Market Volume (Million), by Fuel Type 2024 & 2032
- Figure 29: North America Biofuels Market Revenue Share (%), by Fuel Type 2024 & 2032
- Figure 30: North America Biofuels Market Volume Share (%), by Fuel Type 2024 & 2032
- Figure 31: North America Biofuels Market Revenue (Million), by Feedstock 2024 & 2032
- Figure 32: North America Biofuels Market Volume (Million), by Feedstock 2024 & 2032
- Figure 33: North America Biofuels Market Revenue Share (%), by Feedstock 2024 & 2032
- Figure 34: North America Biofuels Market Volume Share (%), by Feedstock 2024 & 2032
- Figure 35: North America Biofuels Market Revenue (Million), by Country 2024 & 2032
- Figure 36: North America Biofuels Market Volume (Million), by Country 2024 & 2032
- Figure 37: North America Biofuels Market Revenue Share (%), by Country 2024 & 2032
- Figure 38: North America Biofuels Market Volume Share (%), by Country 2024 & 2032
- Figure 39: Europe Biofuels Market Revenue (Million), by Fuel Type 2024 & 2032
- Figure 40: Europe Biofuels Market Volume (Million), by Fuel Type 2024 & 2032
- Figure 41: Europe Biofuels Market Revenue Share (%), by Fuel Type 2024 & 2032
- Figure 42: Europe Biofuels Market Volume Share (%), by Fuel Type 2024 & 2032
- Figure 43: Europe Biofuels Market Revenue (Million), by Feedstock 2024 & 2032
- Figure 44: Europe Biofuels Market Volume (Million), by Feedstock 2024 & 2032
- Figure 45: Europe Biofuels Market Revenue Share (%), by Feedstock 2024 & 2032
- Figure 46: Europe Biofuels Market Volume Share (%), by Feedstock 2024 & 2032
- Figure 47: Europe Biofuels Market Revenue (Million), by Country 2024 & 2032
- Figure 48: Europe Biofuels Market Volume (Million), by Country 2024 & 2032
- Figure 49: Europe Biofuels Market Revenue Share (%), by Country 2024 & 2032
- Figure 50: Europe Biofuels Market Volume Share (%), by Country 2024 & 2032
- Figure 51: Asia Pacific Biofuels Market Revenue (Million), by Fuel Type 2024 & 2032
- Figure 52: Asia Pacific Biofuels Market Volume (Million), by Fuel Type 2024 & 2032
- Figure 53: Asia Pacific Biofuels Market Revenue Share (%), by Fuel Type 2024 & 2032
- Figure 54: Asia Pacific Biofuels Market Volume Share (%), by Fuel Type 2024 & 2032
- Figure 55: Asia Pacific Biofuels Market Revenue (Million), by Feedstock 2024 & 2032
- Figure 56: Asia Pacific Biofuels Market Volume (Million), by Feedstock 2024 & 2032
- Figure 57: Asia Pacific Biofuels Market Revenue Share (%), by Feedstock 2024 & 2032
- Figure 58: Asia Pacific Biofuels Market Volume Share (%), by Feedstock 2024 & 2032
- Figure 59: Asia Pacific Biofuels Market Revenue (Million), by Country 2024 & 2032
- Figure 60: Asia Pacific Biofuels Market Volume (Million), by Country 2024 & 2032
- Figure 61: Asia Pacific Biofuels Market Revenue Share (%), by Country 2024 & 2032
- Figure 62: Asia Pacific Biofuels Market Volume Share (%), by Country 2024 & 2032
- Figure 63: South America Biofuels Market Revenue (Million), by Fuel Type 2024 & 2032
- Figure 64: South America Biofuels Market Volume (Million), by Fuel Type 2024 & 2032
- Figure 65: South America Biofuels Market Revenue Share (%), by Fuel Type 2024 & 2032
- Figure 66: South America Biofuels Market Volume Share (%), by Fuel Type 2024 & 2032
- Figure 67: South America Biofuels Market Revenue (Million), by Feedstock 2024 & 2032
- Figure 68: South America Biofuels Market Volume (Million), by Feedstock 2024 & 2032
- Figure 69: South America Biofuels Market Revenue Share (%), by Feedstock 2024 & 2032
- Figure 70: South America Biofuels Market Volume Share (%), by Feedstock 2024 & 2032
- Figure 71: South America Biofuels Market Revenue (Million), by Country 2024 & 2032
- Figure 72: South America Biofuels Market Volume (Million), by Country 2024 & 2032
- Figure 73: South America Biofuels Market Revenue Share (%), by Country 2024 & 2032
- Figure 74: South America Biofuels Market Volume Share (%), by Country 2024 & 2032
- Figure 75: Middle East and Africa Biofuels Market Revenue (Million), by Fuel Type 2024 & 2032
- Figure 76: Middle East and Africa Biofuels Market Volume (Million), by Fuel Type 2024 & 2032
- Figure 77: Middle East and Africa Biofuels Market Revenue Share (%), by Fuel Type 2024 & 2032
- Figure 78: Middle East and Africa Biofuels Market Volume Share (%), by Fuel Type 2024 & 2032
- Figure 79: Middle East and Africa Biofuels Market Revenue (Million), by Feedstock 2024 & 2032
- Figure 80: Middle East and Africa Biofuels Market Volume (Million), by Feedstock 2024 & 2032
- Figure 81: Middle East and Africa Biofuels Market Revenue Share (%), by Feedstock 2024 & 2032
- Figure 82: Middle East and Africa Biofuels Market Volume Share (%), by Feedstock 2024 & 2032
- Figure 83: Middle East and Africa Biofuels Market Revenue (Million), by Country 2024 & 2032
- Figure 84: Middle East and Africa Biofuels Market Volume (Million), by Country 2024 & 2032
- Figure 85: Middle East and Africa Biofuels Market Revenue Share (%), by Country 2024 & 2032
- Figure 86: Middle East and Africa Biofuels Market Volume Share (%), by Country 2024 & 2032
List of Tables
- Table 1: Global Biofuels Market Revenue Million Forecast, by Region 2019 & 2032
- Table 2: Global Biofuels Market Volume Million Forecast, by Region 2019 & 2032
- Table 3: Global Biofuels Market Revenue Million Forecast, by Fuel Type 2019 & 2032
- Table 4: Global Biofuels Market Volume Million Forecast, by Fuel Type 2019 & 2032
- Table 5: Global Biofuels Market Revenue Million Forecast, by Feedstock 2019 & 2032
- Table 6: Global Biofuels Market Volume Million Forecast, by Feedstock 2019 & 2032
- Table 7: Global Biofuels Market Revenue Million Forecast, by Region 2019 & 2032
- Table 8: Global Biofuels Market Volume Million Forecast, by Region 2019 & 2032
- Table 9: Global Biofuels Market Revenue Million Forecast, by Country 2019 & 2032
- Table 10: Global Biofuels Market Volume Million Forecast, by Country 2019 & 2032
- Table 11: United States Biofuels Market Revenue (Million) Forecast, by Application 2019 & 2032
- Table 12: United States Biofuels Market Volume (Million) Forecast, by Application 2019 & 2032
- Table 13: Canada Biofuels Market Revenue (Million) Forecast, by Application 2019 & 2032
- Table 14: Canada Biofuels Market Volume (Million) Forecast, by Application 2019 & 2032
- Table 15: Mexico Biofuels Market Revenue (Million) Forecast, by Application 2019 & 2032
- Table 16: Mexico Biofuels Market Volume (Million) Forecast, by Application 2019 & 2032
- Table 17: Global Biofuels Market Revenue Million Forecast, by Country 2019 & 2032
- Table 18: Global Biofuels Market Volume Million Forecast, by Country 2019 & 2032
- Table 19: Germany Biofuels Market Revenue (Million) Forecast, by Application 2019 & 2032
- Table 20: Germany Biofuels Market Volume (Million) Forecast, by Application 2019 & 2032
- Table 21: United Kingdom Biofuels Market Revenue (Million) Forecast, by Application 2019 & 2032
- Table 22: United Kingdom Biofuels Market Volume (Million) Forecast, by Application 2019 & 2032
- Table 23: France Biofuels Market Revenue (Million) Forecast, by Application 2019 & 2032
- Table 24: France Biofuels Market Volume (Million) Forecast, by Application 2019 & 2032
- Table 25: Spain Biofuels Market Revenue (Million) Forecast, by Application 2019 & 2032
- Table 26: Spain Biofuels Market Volume (Million) Forecast, by Application 2019 & 2032
- Table 27: Italy Biofuels Market Revenue (Million) Forecast, by Application 2019 & 2032
- Table 28: Italy Biofuels Market Volume (Million) Forecast, by Application 2019 & 2032
- Table 29: Spain Biofuels Market Revenue (Million) Forecast, by Application 2019 & 2032
- Table 30: Spain Biofuels Market Volume (Million) Forecast, by Application 2019 & 2032
- Table 31: Belgium Biofuels Market Revenue (Million) Forecast, by Application 2019 & 2032
- Table 32: Belgium Biofuels Market Volume (Million) Forecast, by Application 2019 & 2032
- Table 33: Netherland Biofuels Market Revenue (Million) Forecast, by Application 2019 & 2032
- Table 34: Netherland Biofuels Market Volume (Million) Forecast, by Application 2019 & 2032
- Table 35: Nordics Biofuels Market Revenue (Million) Forecast, by Application 2019 & 2032
- Table 36: Nordics Biofuels Market Volume (Million) Forecast, by Application 2019 & 2032
- Table 37: Rest of Europe Biofuels Market Revenue (Million) Forecast, by Application 2019 & 2032
- Table 38: Rest of Europe Biofuels Market Volume (Million) Forecast, by Application 2019 & 2032
- Table 39: Global Biofuels Market Revenue Million Forecast, by Country 2019 & 2032
- Table 40: Global Biofuels Market Volume Million Forecast, by Country 2019 & 2032
- Table 41: China Biofuels Market Revenue (Million) Forecast, by Application 2019 & 2032
- Table 42: China Biofuels Market Volume (Million) Forecast, by Application 2019 & 2032
- Table 43: Japan Biofuels Market Revenue (Million) Forecast, by Application 2019 & 2032
- Table 44: Japan Biofuels Market Volume (Million) Forecast, by Application 2019 & 2032
- Table 45: India Biofuels Market Revenue (Million) Forecast, by Application 2019 & 2032
- Table 46: India Biofuels Market Volume (Million) Forecast, by Application 2019 & 2032
- Table 47: South Korea Biofuels Market Revenue (Million) Forecast, by Application 2019 & 2032
- Table 48: South Korea Biofuels Market Volume (Million) Forecast, by Application 2019 & 2032
- Table 49: Southeast Asia Biofuels Market Revenue (Million) Forecast, by Application 2019 & 2032
- Table 50: Southeast Asia Biofuels Market Volume (Million) Forecast, by Application 2019 & 2032
- Table 51: Australia Biofuels Market Revenue (Million) Forecast, by Application 2019 & 2032
- Table 52: Australia Biofuels Market Volume (Million) Forecast, by Application 2019 & 2032
- Table 53: Indonesia Biofuels Market Revenue (Million) Forecast, by Application 2019 & 2032
- Table 54: Indonesia Biofuels Market Volume (Million) Forecast, by Application 2019 & 2032
- Table 55: Phillipes Biofuels Market Revenue (Million) Forecast, by Application 2019 & 2032
- Table 56: Phillipes Biofuels Market Volume (Million) Forecast, by Application 2019 & 2032
- Table 57: Singapore Biofuels Market Revenue (Million) Forecast, by Application 2019 & 2032
- Table 58: Singapore Biofuels Market Volume (Million) Forecast, by Application 2019 & 2032
- Table 59: Thailandc Biofuels Market Revenue (Million) Forecast, by Application 2019 & 2032
- Table 60: Thailandc Biofuels Market Volume (Million) Forecast, by Application 2019 & 2032
- Table 61: Rest of Asia Pacific Biofuels Market Revenue (Million) Forecast, by Application 2019 & 2032
- Table 62: Rest of Asia Pacific Biofuels Market Volume (Million) Forecast, by Application 2019 & 2032
- Table 63: Global Biofuels Market Revenue Million Forecast, by Country 2019 & 2032
- Table 64: Global Biofuels Market Volume Million Forecast, by Country 2019 & 2032
- Table 65: Brazil Biofuels Market Revenue (Million) Forecast, by Application 2019 & 2032
- Table 66: Brazil Biofuels Market Volume (Million) Forecast, by Application 2019 & 2032
- Table 67: Argentina Biofuels Market Revenue (Million) Forecast, by Application 2019 & 2032
- Table 68: Argentina Biofuels Market Volume (Million) Forecast, by Application 2019 & 2032
- Table 69: Peru Biofuels Market Revenue (Million) Forecast, by Application 2019 & 2032
- Table 70: Peru Biofuels Market Volume (Million) Forecast, by Application 2019 & 2032
- Table 71: Chile Biofuels Market Revenue (Million) Forecast, by Application 2019 & 2032
- Table 72: Chile Biofuels Market Volume (Million) Forecast, by Application 2019 & 2032
- Table 73: Colombia Biofuels Market Revenue (Million) Forecast, by Application 2019 & 2032
- Table 74: Colombia Biofuels Market Volume (Million) Forecast, by Application 2019 & 2032
- Table 75: Ecuador Biofuels Market Revenue (Million) Forecast, by Application 2019 & 2032
- Table 76: Ecuador Biofuels Market Volume (Million) Forecast, by Application 2019 & 2032
- Table 77: Venezuela Biofuels Market Revenue (Million) Forecast, by Application 2019 & 2032
- Table 78: Venezuela Biofuels Market Volume (Million) Forecast, by Application 2019 & 2032
- Table 79: Rest of South America Biofuels Market Revenue (Million) Forecast, by Application 2019 & 2032
- Table 80: Rest of South America Biofuels Market Volume (Million) Forecast, by Application 2019 & 2032
- Table 81: Global Biofuels Market Revenue Million Forecast, by Country 2019 & 2032
- Table 82: Global Biofuels Market Volume Million Forecast, by Country 2019 & 2032
- Table 83: United States Biofuels Market Revenue (Million) Forecast, by Application 2019 & 2032
- Table 84: United States Biofuels Market Volume (Million) Forecast, by Application 2019 & 2032
- Table 85: Canada Biofuels Market Revenue (Million) Forecast, by Application 2019 & 2032
- Table 86: Canada Biofuels Market Volume (Million) Forecast, by Application 2019 & 2032
- Table 87: Mexico Biofuels Market Revenue (Million) Forecast, by Application 2019 & 2032
- Table 88: Mexico Biofuels Market Volume (Million) Forecast, by Application 2019 & 2032
- Table 89: Global Biofuels Market Revenue Million Forecast, by Country 2019 & 2032
- Table 90: Global Biofuels Market Volume Million Forecast, by Country 2019 & 2032
- Table 91: United Arab Emirates Biofuels Market Revenue (Million) Forecast, by Application 2019 & 2032
- Table 92: United Arab Emirates Biofuels Market Volume (Million) Forecast, by Application 2019 & 2032
- Table 93: Saudi Arabia Biofuels Market Revenue (Million) Forecast, by Application 2019 & 2032
- Table 94: Saudi Arabia Biofuels Market Volume (Million) Forecast, by Application 2019 & 2032
- Table 95: South Africa Biofuels Market Revenue (Million) Forecast, by Application 2019 & 2032
- Table 96: South Africa Biofuels Market Volume (Million) Forecast, by Application 2019 & 2032
- Table 97: Rest of Middle East and Africa Biofuels Market Revenue (Million) Forecast, by Application 2019 & 2032
- Table 98: Rest of Middle East and Africa Biofuels Market Volume (Million) Forecast, by Application 2019 & 2032
- Table 99: Global Biofuels Market Revenue Million Forecast, by Fuel Type 2019 & 2032
- Table 100: Global Biofuels Market Volume Million Forecast, by Fuel Type 2019 & 2032
- Table 101: Global Biofuels Market Revenue Million Forecast, by Feedstock 2019 & 2032
- Table 102: Global Biofuels Market Volume Million Forecast, by Feedstock 2019 & 2032
- Table 103: Global Biofuels Market Revenue Million Forecast, by Country 2019 & 2032
- Table 104: Global Biofuels Market Volume Million Forecast, by Country 2019 & 2032
- Table 105: United States of America Biofuels Market Revenue (Million) Forecast, by Application 2019 & 2032
- Table 106: United States of America Biofuels Market Volume (Million) Forecast, by Application 2019 & 2032
- Table 107: Canada Biofuels Market Revenue (Million) Forecast, by Application 2019 & 2032
- Table 108: Canada Biofuels Market Volume (Million) Forecast, by Application 2019 & 2032
- Table 109: Rest of North America Biofuels Market Revenue (Million) Forecast, by Application 2019 & 2032
- Table 110: Rest of North America Biofuels Market Volume (Million) Forecast, by Application 2019 & 2032
- Table 111: Global Biofuels Market Revenue Million Forecast, by Fuel Type 2019 & 2032
- Table 112: Global Biofuels Market Volume Million Forecast, by Fuel Type 2019 & 2032
- Table 113: Global Biofuels Market Revenue Million Forecast, by Feedstock 2019 & 2032
- Table 114: Global Biofuels Market Volume Million Forecast, by Feedstock 2019 & 2032
- Table 115: Global Biofuels Market Revenue Million Forecast, by Country 2019 & 2032
- Table 116: Global Biofuels Market Volume Million Forecast, by Country 2019 & 2032
- Table 117: Germany Biofuels Market Revenue (Million) Forecast, by Application 2019 & 2032
- Table 118: Germany Biofuels Market Volume (Million) Forecast, by Application 2019 & 2032
- Table 119: United Kingdom Biofuels Market Revenue (Million) Forecast, by Application 2019 & 2032
- Table 120: United Kingdom Biofuels Market Volume (Million) Forecast, by Application 2019 & 2032
- Table 121: Denmark Biofuels Market Revenue (Million) Forecast, by Application 2019 & 2032
- Table 122: Denmark Biofuels Market Volume (Million) Forecast, by Application 2019 & 2032
- Table 123: Rest of Europe Biofuels Market Revenue (Million) Forecast, by Application 2019 & 2032
- Table 124: Rest of Europe Biofuels Market Volume (Million) Forecast, by Application 2019 & 2032
- Table 125: Global Biofuels Market Revenue Million Forecast, by Fuel Type 2019 & 2032
- Table 126: Global Biofuels Market Volume Million Forecast, by Fuel Type 2019 & 2032
- Table 127: Global Biofuels Market Revenue Million Forecast, by Feedstock 2019 & 2032
- Table 128: Global Biofuels Market Volume Million Forecast, by Feedstock 2019 & 2032
- Table 129: Global Biofuels Market Revenue Million Forecast, by Country 2019 & 2032
- Table 130: Global Biofuels Market Volume Million Forecast, by Country 2019 & 2032
- Table 131: China Biofuels Market Revenue (Million) Forecast, by Application 2019 & 2032
- Table 132: China Biofuels Market Volume (Million) Forecast, by Application 2019 & 2032
- Table 133: India Biofuels Market Revenue (Million) Forecast, by Application 2019 & 2032
- Table 134: India Biofuels Market Volume (Million) Forecast, by Application 2019 & 2032
- Table 135: Indonesia Biofuels Market Revenue (Million) Forecast, by Application 2019 & 2032
- Table 136: Indonesia Biofuels Market Volume (Million) Forecast, by Application 2019 & 2032
- Table 137: Rest of Asia Pacific Biofuels Market Revenue (Million) Forecast, by Application 2019 & 2032
- Table 138: Rest of Asia Pacific Biofuels Market Volume (Million) Forecast, by Application 2019 & 2032
- Table 139: Global Biofuels Market Revenue Million Forecast, by Fuel Type 2019 & 2032
- Table 140: Global Biofuels Market Volume Million Forecast, by Fuel Type 2019 & 2032
- Table 141: Global Biofuels Market Revenue Million Forecast, by Feedstock 2019 & 2032
- Table 142: Global Biofuels Market Volume Million Forecast, by Feedstock 2019 & 2032
- Table 143: Global Biofuels Market Revenue Million Forecast, by Country 2019 & 2032
- Table 144: Global Biofuels Market Volume Million Forecast, by Country 2019 & 2032
- Table 145: Brazil Biofuels Market Revenue (Million) Forecast, by Application 2019 & 2032
- Table 146: Brazil Biofuels Market Volume (Million) Forecast, by Application 2019 & 2032
- Table 147: Argentina Biofuels Market Revenue (Million) Forecast, by Application 2019 & 2032
- Table 148: Argentina Biofuels Market Volume (Million) Forecast, by Application 2019 & 2032
- Table 149: Chile Biofuels Market Revenue (Million) Forecast, by Application 2019 & 2032
- Table 150: Chile Biofuels Market Volume (Million) Forecast, by Application 2019 & 2032
- Table 151: Rest of South America Biofuels Market Revenue (Million) Forecast, by Application 2019 & 2032
- Table 152: Rest of South America Biofuels Market Volume (Million) Forecast, by Application 2019 & 2032
- Table 153: Global Biofuels Market Revenue Million Forecast, by Fuel Type 2019 & 2032
- Table 154: Global Biofuels Market Volume Million Forecast, by Fuel Type 2019 & 2032
- Table 155: Global Biofuels Market Revenue Million Forecast, by Feedstock 2019 & 2032
- Table 156: Global Biofuels Market Volume Million Forecast, by Feedstock 2019 & 2032
- Table 157: Global Biofuels Market Revenue Million Forecast, by Country 2019 & 2032
- Table 158: Global Biofuels Market Volume Million Forecast, by Country 2019 & 2032
- Table 159: United Arab Emirates Biofuels Market Revenue (Million) Forecast, by Application 2019 & 2032
- Table 160: United Arab Emirates Biofuels Market Volume (Million) Forecast, by Application 2019 & 2032
- Table 161: Saudi Arabia Biofuels Market Revenue (Million) Forecast, by Application 2019 & 2032
- Table 162: Saudi Arabia Biofuels Market Volume (Million) Forecast, by Application 2019 & 2032
- Table 163: South Africa Biofuels Market Revenue (Million) Forecast, by Application 2019 & 2032
- Table 164: South Africa Biofuels Market Volume (Million) Forecast, by Application 2019 & 2032
- Table 165: Rest of Middle East and Africa Biofuels Market Revenue (Million) Forecast, by Application 2019 & 2032
- Table 166: Rest of Middle East and Africa Biofuels Market Volume (Million) Forecast, by Application 2019 & 2032
Frequently Asked Questions
1. What is the projected Compound Annual Growth Rate (CAGR) of the Biofuels Market?
The projected CAGR is approximately 5.20%.
2. Which companies are prominent players in the Biofuels Market?
Key companies in the market include Abengoa Bioenergy SA, Shell PLC, Cargill Incorporated, Verbio Vereinigte BioEnergie AG*List Not Exhaustive, POET LLC, Archer Daniels Midland Company, Neste Oyj, Wilmar International Ltd, Renewable Energy Group Inc, BP PLC.
3. What are the main segments of the Biofuels Market?
The market segments include Fuel Type, Feedstock.
4. Can you provide details about the market size?
The market size is estimated to be USD XX Million as of 2022.
5. What are some drivers contributing to market growth?
4.; Increasing Demand for Secure. Sustainable. and Clean Energy.
6. What are the notable trends driving market growth?
Ethanol Likely to Experience a Significant Growth.
7. Are there any restraints impacting market growth?
4.; High Cost of Production of Biofuels.
8. Can you provide examples of recent developments in the market?
April 2023: Cepsa awarded a contract for the engineering, procurement, and construction management support of the second-generation (2G) biofuels plant in southern Europe to the Técnicas Reunidas. This new plant will use agricultural waste and used cooking oils as feedstock. it will have two pre-treatment units and a flexible production capacity of around 500,000 tons of renewable diesel and sustainable aviation fuel (SAF) for use in air, sea, and land transport.
9. What pricing options are available for accessing the report?
Pricing options include single-user, multi-user, and enterprise licenses priced at USD 4750, USD 5250, and USD 8750 respectively.
10. Is the market size provided in terms of value or volume?
The market size is provided in terms of value, measured in Million and volume, measured in Million.
11. Are there any specific market keywords associated with the report?
Yes, the market keyword associated with the report is "Biofuels Market," which aids in identifying and referencing the specific market segment covered.
12. How do I determine which pricing option suits my needs best?
The pricing options vary based on user requirements and access needs. Individual users may opt for single-user licenses, while businesses requiring broader access may choose multi-user or enterprise licenses for cost-effective access to the report.
13. Are there any additional resources or data provided in the Biofuels Market report?
While the report offers comprehensive insights, it's advisable to review the specific contents or supplementary materials provided to ascertain if additional resources or data are available.
14. How can I stay updated on further developments or reports in the Biofuels Market?
To stay informed about further developments, trends, and reports in the Biofuels Market, consider subscribing to industry newsletters, following relevant companies and organizations, or regularly checking reputable industry news sources and publications.
Methodology
Step 1 - Identification of Relevant Samples Size from Population Database


Step 2 - Approaches for Defining Global Market Size (Value, Volume* & Price*)

Note*: In applicable scenarios
Step 3 - Data Sources
Primary Research
- Web Analytics
- Survey Reports
- Research Institute
- Latest Research Reports
- Opinion Leaders
Secondary Research
- Annual Reports
- White Paper
- Latest Press Release
- Industry Association
- Paid Database
- Investor Presentations

Step 4 - Data Triangulation
Involves using different sources of information in order to increase the validity of a study
These sources are likely to be stakeholders in a program - participants, other researchers, program staff, other community members, and so on.
Then we put all data in single framework & apply various statistical tools to find out the dynamic on the market.
During the analysis stage, feedback from the stakeholder groups would be compared to determine areas of agreement as well as areas of divergence


