
Key Insights
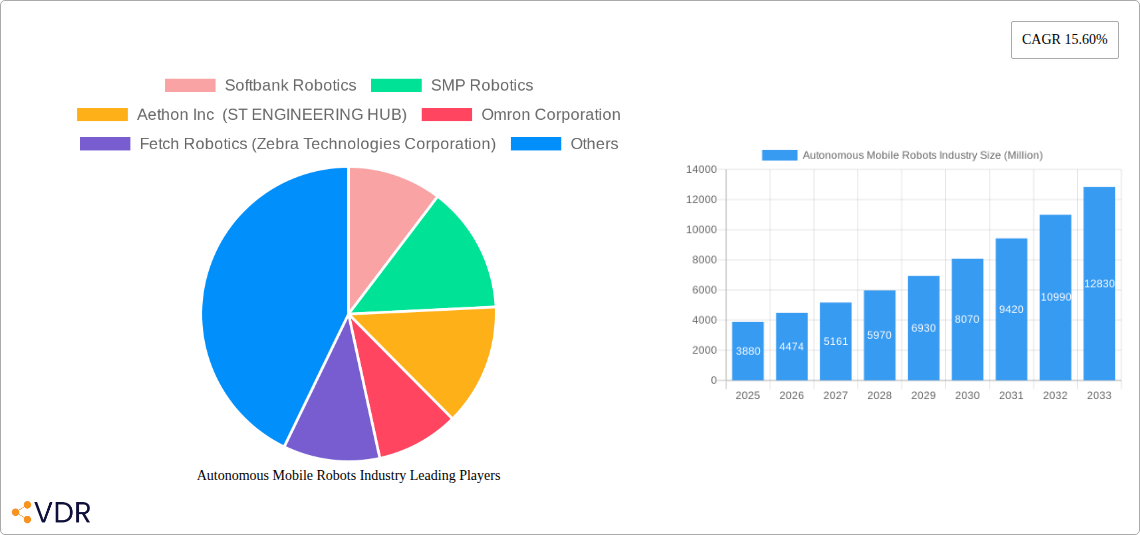
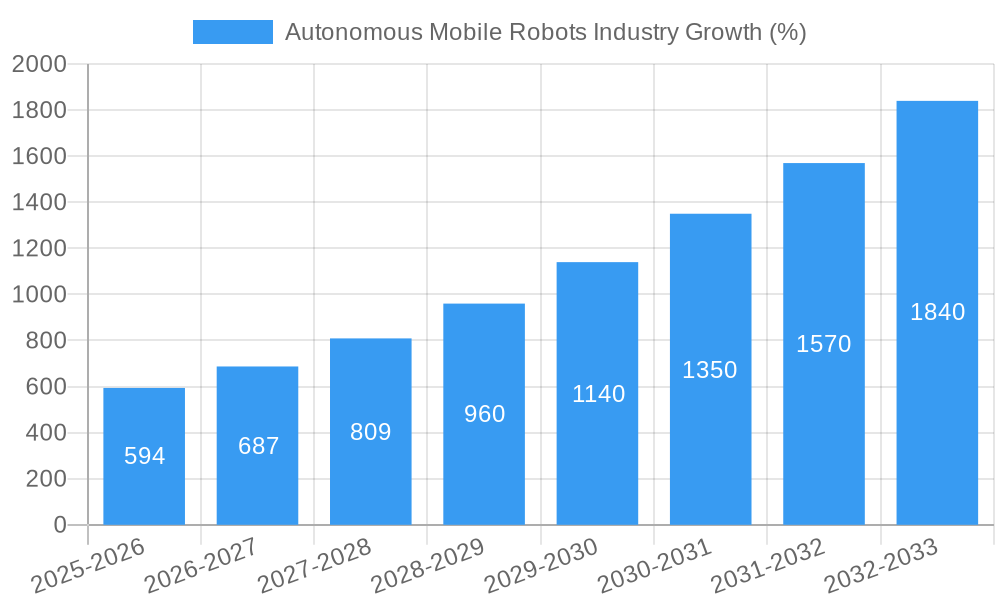
The Autonomous Mobile Robot (AMR) market is experiencing robust growth, projected to reach \$3.88 billion in 2025 and exhibiting a Compound Annual Growth Rate (CAGR) of 15.60% from 2025 to 2033. This expansion is fueled by several key factors. The increasing demand for automation in various industries, particularly logistics, warehousing, and manufacturing, is a primary driver. Businesses are seeking to improve efficiency, reduce operational costs, and enhance worker safety through the deployment of AMRs. Furthermore, advancements in technologies such as AI, machine learning, and computer vision are enhancing the capabilities of AMRs, making them more versatile and adaptable to diverse operational environments. The rising adoption of Industry 4.0 principles and the growing need for flexible automation solutions are also contributing to market growth. While the market faces some challenges, including initial high investment costs and the need for skilled labor for implementation and maintenance, the overall growth trajectory remains positive due to the significant long-term benefits AMRs offer.
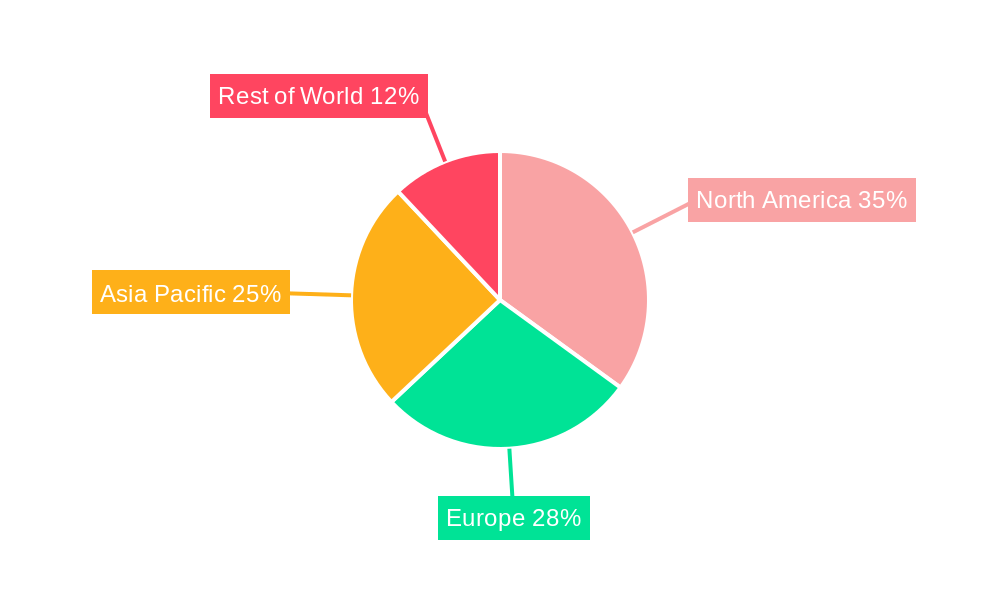
Market segmentation reveals a diverse landscape. Unmanned Ground Vehicles (UGVs) currently dominate the market by type, followed by Unmanned Aerial Vehicles (UAVs) and Humanoid robots. Significant growth is anticipated in the UAV and Humanoid segments, driven by increasing adoption in surveillance, inspection, and service applications. By end-user industry, the defense and security, warehouse and logistics, and manufacturing sectors represent the largest market shares. However, growing interest in the energy and power, and automotive sectors indicates strong future growth potential for AMRs in these areas. Geographically, North America currently holds a significant market share, followed by Europe and Asia-Pacific. However, rapidly expanding economies in Asia-Pacific suggest a substantial increase in regional market share in the coming years due to accelerated industrialization and automation adoption. The competitive landscape features a mix of established players and emerging companies, indicating a dynamic and innovative market poised for continued expansion.
Autonomous Mobile Robots Industry: A Comprehensive Market Report (2019-2033)
This in-depth report provides a comprehensive analysis of the Autonomous Mobile Robots (AMR) industry, encompassing market dynamics, growth trends, dominant segments, key players, and future outlook. The study period covers 2019-2033, with 2025 as the base and estimated year. The report segments the market by type (Unmanned Ground Vehicle, Humanoid, Unmanned Aerial Vehicle, Unmanned Marine Vehicle) and end-user industry (Defense and Security, Warehouse and Logistics, Energy and Power, Automotive, Manufacturing, Oil and Gas, Mining and Minerals, Other End-user Industries), offering granular insights for informed decision-making. The report projects significant growth in the coming years, driven by technological advancements and increasing adoption across various sectors. This report is an invaluable resource for industry professionals, investors, and strategic planners seeking to understand and capitalize on the opportunities within this rapidly evolving market. The global market size in 2025 is estimated at xx Million units.
Autonomous Mobile Robots Industry Market Dynamics & Structure
The Autonomous Mobile Robots (AMR) market exhibits a moderately concentrated structure, with key players like Softbank Robotics, Omron Corporation, and Teradyne Inc. (Mobile Industrial Robots) holding significant market share. Technological innovation, particularly in areas like AI, sensor technology, and navigation systems, is a major growth driver. However, regulatory frameworks concerning data privacy, safety standards, and liability remain evolving, posing challenges for market expansion. The market is also witnessing increasing M&A activity, with strategic investments fueling growth and collaboration. The competitive landscape includes various product substitutes, such as conventional automated guided vehicles (AGVs), but AMRs offer superior flexibility and adaptability.
- Market Concentration: Moderately concentrated, with top 5 players holding xx% market share in 2025.
- Technological Innovation: Significant advancements in AI, LiDAR, and computer vision are key drivers.
- Regulatory Framework: Evolving regulations regarding safety and data privacy create both opportunities and challenges.
- Competitive Substitutes: Conventional AGVs, but AMRs offer superior flexibility and intelligence.
- M&A Activity: Increasing deal volume, reflecting strategic investments and consolidation within the sector. xx deals were recorded in 2024.
- End-User Demographics: Shifting towards adoption in diverse sectors beyond traditional warehousing and logistics.
Autonomous Mobile Robots Industry Growth Trends & Insights
The global AMR market has experienced robust growth during the historical period (2019-2024). Adoption rates have accelerated significantly, driven by factors such as increased automation needs across various industries, labor shortages, and the rising cost of human labor. Technological disruptions, including advancements in AI and machine learning, have enhanced the capabilities and efficiency of AMRs. Consumer behavior shifts towards preference for faster and more efficient delivery and supply chain operations are further fueling market expansion. The market is projected to maintain a strong Compound Annual Growth Rate (CAGR) of xx% during the forecast period (2025-2033), reaching xx Million units by 2033. This growth is anticipated across all major segments, with particularly strong expansion in the warehouse and logistics sector. Market penetration is expected to increase significantly in emerging economies.
Dominant Regions, Countries, or Segments in Autonomous Mobile Robots Industry
North America and Europe currently lead the AMR market, driven by early adoption, strong technological capabilities, and well-developed infrastructure. However, the Asia-Pacific region is poised for rapid growth, fueled by increasing industrial automation initiatives and substantial investments in smart manufacturing. Within the segments, Unmanned Ground Vehicles (UGVs) dominate the market due to their wider applicability across various industries. The Warehouse and Logistics end-user segment exhibits the highest growth potential, driven by the e-commerce boom and the need for efficient order fulfillment.
- Leading Regions: North America and Europe currently hold the largest market share.
- High-Growth Regions: Asia-Pacific region displays strong growth potential due to increased industrialization.
- Dominant Segment (Type): Unmanned Ground Vehicles (UGVs) dominate due to wider applicability.
- Dominant Segment (End-User): Warehouse and Logistics represent the largest and fastest-growing segment.
- Key Drivers (North America): Strong technological infrastructure, early adoption, and high automation investment.
- Key Drivers (Asia-Pacific): Rapid industrialization, rising labor costs, and government initiatives supporting automation.
Autonomous Mobile Robots Industry Product Landscape
The AMR product landscape is characterized by continuous innovation, with advancements focusing on enhanced navigation systems, increased payload capacity, improved safety features, and greater integration with existing enterprise systems. AMRs are deployed across various applications, including material handling, inspection, and surveillance. Key performance metrics include payload capacity, speed, battery life, and navigation accuracy. Unique selling propositions (USPs) often revolve around ease of implementation, flexibility, and cost-effectiveness compared to traditional AGVs.
Key Drivers, Barriers & Challenges in Autonomous Mobile Robots Industry
Key Drivers:
- Rising labor costs and shortages: AMRs offer a cost-effective alternative to human labor.
- Increased demand for automation: Various industries seek to enhance efficiency and productivity.
- Technological advancements: AI, sensor technology, and navigation systems are continually improving.
- Government incentives and regulations: Policies supporting automation and robotics are encouraging adoption.
Key Challenges:
- High initial investment costs: The upfront cost of deploying AMRs can be significant.
- Integration complexities: Seamless integration with existing infrastructure and systems is crucial.
- Safety concerns: Ensuring safe operation in dynamic environments requires robust safety mechanisms.
- Cybersecurity risks: Protecting AMRs from cyberattacks is critical for operational integrity. A xx% increase in cyberattacks on industrial robots is predicted by 2028.
Emerging Opportunities in Autonomous Mobile Robots Industry
Emerging opportunities lie in expanding applications of AMRs into sectors such as healthcare, agriculture, and construction. Innovative applications, such as autonomous delivery robots and AMRs for infrastructure inspection, represent significant untapped potential. Evolving consumer preferences for contactless delivery and improved supply chain efficiency are driving market expansion. Increased use of cloud-based platforms for AMR management presents significant opportunities.
Growth Accelerators in the Autonomous Mobile Robots Industry
Long-term growth will be fueled by continuous technological breakthroughs, particularly in AI and machine learning, enabling greater autonomy and intelligence in AMRs. Strategic partnerships between AMR providers and end-user industries will unlock new applications and drive adoption. Expansion into new geographical markets, particularly in developing economies, will further accelerate market growth. Development of standardized interfaces and protocols will streamline integration and reduce deployment complexity.
Key Players Shaping the Autonomous Mobile Robots Industry Market
- Softbank Robotics
- SMP Robotics
- Aethon Inc (ST ENGINEERING HUB)
- Omron Corporation
- Fetch Robotics (Zebra Technologies Corporation)
- OTTO Motors
- Mobile Industrial Robots (Mir)(Teradyne Inc )
- HiK Robot
- Vecna Robotics Inc
- Seegrid Corporation
- Geek+ Technology Co Ltd
- Clearpath Robotics
Notable Milestones in Autonomous Mobile Robots Industry Sector
- May 2023: Mitsubishi Electric Corporation invests in Clearpath Robotics (OTTO Motors parent company), strengthening their commercial collaboration.
- April 2023: Radial, Inc. deploys nearly 200 Geek+ P800 AMRs in a new fulfillment center, showcasing large-scale AMR adoption in e-commerce.
In-Depth Autonomous Mobile Robots Industry Market Outlook
The AMR market is poised for significant long-term growth, driven by ongoing technological advancements, increasing automation demands across diverse industries, and supportive regulatory frameworks. Strategic partnerships, market expansion into new geographic regions, and the development of innovative applications will further fuel market expansion. The market presents significant opportunities for companies developing advanced technologies, offering integrated solutions, and focusing on specific niche applications. The future holds immense potential for AMRs to revolutionize various industries and reshape the landscape of automation.
Autonomous Mobile Robots Industry Segmentation
-
1. Type
- 1.1. Unmanned Ground Vehicles
- 1.2. Humanoids
- 1.3. Unmanned Aerial Vehicles
- 1.4. Unmanned Marine Vehicles
-
2. End-user Industry
- 2.1. Defense and Security
- 2.2. Warehouse and Logistics
- 2.3. Energy and Power
- 2.4. Automotive
- 2.5. Manufacturing
- 2.6. Oil and Gas
- 2.7. Mining and Minerals
- 2.8. Other End-user Industries
Autonomous Mobile Robots Industry Segmentation By Geography
-
1. North America
- 1.1. United States
- 1.2. Canada
-
2. Europe
- 2.1. United Kingdom
- 2.2. Germany
- 2.3. France
-
3. Asia Pacific
- 3.1. China
- 3.2. Japan
- 3.3. India
- 4. Australia and New Zealand
-
5. Latin America
- 5.1. Brazil
- 5.2. Argentina
-
6. Middle East and Africa
- 6.1. Saudi Arabia
- 6.2. United Arab Emirates
- 6.3. South Africa
Autonomous Mobile Robots Industry REPORT HIGHLIGHTS
| Aspects | Details |
|---|---|
| Study Period | 2019-2033 |
| Base Year | 2024 |
| Estimated Year | 2025 |
| Forecast Period | 2025-2033 |
| Historical Period | 2019-2024 |
| Growth Rate | CAGR of 15.60% from 2019-2033 |
| Segmentation |
|
Table of Contents
- 1. Introduction
- 1.1. Research Scope
- 1.2. Market Segmentation
- 1.3. Research Methodology
- 1.4. Definitions and Assumptions
- 2. Executive Summary
- 2.1. Introduction
- 3. Market Dynamics
- 3.1. Introduction
- 3.2. Market Drivers
- 3.2.1. Increasing Demand for Automation across the End-user Industries; Labor-related Challenges Coupled with Advancements in Technology
- 3.3. Market Restrains
- 3.3.1. Communication and Connectivity Issues; High Capital Requirements
- 3.4. Market Trends
- 3.4.1. Automotive Sector Expected to Register Significant Growth
- 4. Market Factor Analysis
- 4.1. Porters Five Forces
- 4.2. Supply/Value Chain
- 4.3. PESTEL analysis
- 4.4. Market Entropy
- 4.5. Patent/Trademark Analysis
- 5. Global Autonomous Mobile Robots Industry Analysis, Insights and Forecast, 2019-2031
- 5.1. Market Analysis, Insights and Forecast - by Type
- 5.1.1. Unmanned Ground Vehicles
- 5.1.2. Humanoids
- 5.1.3. Unmanned Aerial Vehicles
- 5.1.4. Unmanned Marine Vehicles
- 5.2. Market Analysis, Insights and Forecast - by End-user Industry
- 5.2.1. Defense and Security
- 5.2.2. Warehouse and Logistics
- 5.2.3. Energy and Power
- 5.2.4. Automotive
- 5.2.5. Manufacturing
- 5.2.6. Oil and Gas
- 5.2.7. Mining and Minerals
- 5.2.8. Other End-user Industries
- 5.3. Market Analysis, Insights and Forecast - by Region
- 5.3.1. North America
- 5.3.2. Europe
- 5.3.3. Asia Pacific
- 5.3.4. Australia and New Zealand
- 5.3.5. Latin America
- 5.3.6. Middle East and Africa
- 5.1. Market Analysis, Insights and Forecast - by Type
- 6. North America Autonomous Mobile Robots Industry Analysis, Insights and Forecast, 2019-2031
- 6.1. Market Analysis, Insights and Forecast - by Type
- 6.1.1. Unmanned Ground Vehicles
- 6.1.2. Humanoids
- 6.1.3. Unmanned Aerial Vehicles
- 6.1.4. Unmanned Marine Vehicles
- 6.2. Market Analysis, Insights and Forecast - by End-user Industry
- 6.2.1. Defense and Security
- 6.2.2. Warehouse and Logistics
- 6.2.3. Energy and Power
- 6.2.4. Automotive
- 6.2.5. Manufacturing
- 6.2.6. Oil and Gas
- 6.2.7. Mining and Minerals
- 6.2.8. Other End-user Industries
- 6.1. Market Analysis, Insights and Forecast - by Type
- 7. Europe Autonomous Mobile Robots Industry Analysis, Insights and Forecast, 2019-2031
- 7.1. Market Analysis, Insights and Forecast - by Type
- 7.1.1. Unmanned Ground Vehicles
- 7.1.2. Humanoids
- 7.1.3. Unmanned Aerial Vehicles
- 7.1.4. Unmanned Marine Vehicles
- 7.2. Market Analysis, Insights and Forecast - by End-user Industry
- 7.2.1. Defense and Security
- 7.2.2. Warehouse and Logistics
- 7.2.3. Energy and Power
- 7.2.4. Automotive
- 7.2.5. Manufacturing
- 7.2.6. Oil and Gas
- 7.2.7. Mining and Minerals
- 7.2.8. Other End-user Industries
- 7.1. Market Analysis, Insights and Forecast - by Type
- 8. Asia Pacific Autonomous Mobile Robots Industry Analysis, Insights and Forecast, 2019-2031
- 8.1. Market Analysis, Insights and Forecast - by Type
- 8.1.1. Unmanned Ground Vehicles
- 8.1.2. Humanoids
- 8.1.3. Unmanned Aerial Vehicles
- 8.1.4. Unmanned Marine Vehicles
- 8.2. Market Analysis, Insights and Forecast - by End-user Industry
- 8.2.1. Defense and Security
- 8.2.2. Warehouse and Logistics
- 8.2.3. Energy and Power
- 8.2.4. Automotive
- 8.2.5. Manufacturing
- 8.2.6. Oil and Gas
- 8.2.7. Mining and Minerals
- 8.2.8. Other End-user Industries
- 8.1. Market Analysis, Insights and Forecast - by Type
- 9. Australia and New Zealand Autonomous Mobile Robots Industry Analysis, Insights and Forecast, 2019-2031
- 9.1. Market Analysis, Insights and Forecast - by Type
- 9.1.1. Unmanned Ground Vehicles
- 9.1.2. Humanoids
- 9.1.3. Unmanned Aerial Vehicles
- 9.1.4. Unmanned Marine Vehicles
- 9.2. Market Analysis, Insights and Forecast - by End-user Industry
- 9.2.1. Defense and Security
- 9.2.2. Warehouse and Logistics
- 9.2.3. Energy and Power
- 9.2.4. Automotive
- 9.2.5. Manufacturing
- 9.2.6. Oil and Gas
- 9.2.7. Mining and Minerals
- 9.2.8. Other End-user Industries
- 9.1. Market Analysis, Insights and Forecast - by Type
- 10. Latin America Autonomous Mobile Robots Industry Analysis, Insights and Forecast, 2019-2031
- 10.1. Market Analysis, Insights and Forecast - by Type
- 10.1.1. Unmanned Ground Vehicles
- 10.1.2. Humanoids
- 10.1.3. Unmanned Aerial Vehicles
- 10.1.4. Unmanned Marine Vehicles
- 10.2. Market Analysis, Insights and Forecast - by End-user Industry
- 10.2.1. Defense and Security
- 10.2.2. Warehouse and Logistics
- 10.2.3. Energy and Power
- 10.2.4. Automotive
- 10.2.5. Manufacturing
- 10.2.6. Oil and Gas
- 10.2.7. Mining and Minerals
- 10.2.8. Other End-user Industries
- 10.1. Market Analysis, Insights and Forecast - by Type
- 11. Middle East and Africa Autonomous Mobile Robots Industry Analysis, Insights and Forecast, 2019-2031
- 11.1. Market Analysis, Insights and Forecast - by Type
- 11.1.1. Unmanned Ground Vehicles
- 11.1.2. Humanoids
- 11.1.3. Unmanned Aerial Vehicles
- 11.1.4. Unmanned Marine Vehicles
- 11.2. Market Analysis, Insights and Forecast - by End-user Industry
- 11.2.1. Defense and Security
- 11.2.2. Warehouse and Logistics
- 11.2.3. Energy and Power
- 11.2.4. Automotive
- 11.2.5. Manufacturing
- 11.2.6. Oil and Gas
- 11.2.7. Mining and Minerals
- 11.2.8. Other End-user Industries
- 11.1. Market Analysis, Insights and Forecast - by Type
- 12. North America Autonomous Mobile Robots Industry Analysis, Insights and Forecast, 2019-2031
- 12.1. Market Analysis, Insights and Forecast - By Country/Sub-region
- 12.1.1 United States
- 12.1.2 Canada
- 12.1.3 Mexico
- 13. Europe Autonomous Mobile Robots Industry Analysis, Insights and Forecast, 2019-2031
- 13.1. Market Analysis, Insights and Forecast - By Country/Sub-region
- 13.1.1 Germany
- 13.1.2 United Kingdom
- 13.1.3 France
- 13.1.4 Spain
- 13.1.5 Italy
- 13.1.6 Spain
- 13.1.7 Belgium
- 13.1.8 Netherland
- 13.1.9 Nordics
- 13.1.10 Rest of Europe
- 14. Asia Pacific Autonomous Mobile Robots Industry Analysis, Insights and Forecast, 2019-2031
- 14.1. Market Analysis, Insights and Forecast - By Country/Sub-region
- 14.1.1 China
- 14.1.2 Japan
- 14.1.3 India
- 14.1.4 South Korea
- 14.1.5 Southeast Asia
- 14.1.6 Australia
- 14.1.7 Indonesia
- 14.1.8 Phillipes
- 14.1.9 Singapore
- 14.1.10 Thailandc
- 14.1.11 Rest of Asia Pacific
- 15. South America Autonomous Mobile Robots Industry Analysis, Insights and Forecast, 2019-2031
- 15.1. Market Analysis, Insights and Forecast - By Country/Sub-region
- 15.1.1 Brazil
- 15.1.2 Argentina
- 15.1.3 Peru
- 15.1.4 Chile
- 15.1.5 Colombia
- 15.1.6 Ecuador
- 15.1.7 Venezuela
- 15.1.8 Rest of South America
- 16. North America Autonomous Mobile Robots Industry Analysis, Insights and Forecast, 2019-2031
- 16.1. Market Analysis, Insights and Forecast - By Country/Sub-region
- 16.1.1 United States
- 16.1.2 Canada
- 16.1.3 Mexico
- 17. MEA Autonomous Mobile Robots Industry Analysis, Insights and Forecast, 2019-2031
- 17.1. Market Analysis, Insights and Forecast - By Country/Sub-region
- 17.1.1 United Arab Emirates
- 17.1.2 Saudi Arabia
- 17.1.3 South Africa
- 17.1.4 Rest of Middle East and Africa
- 18. Competitive Analysis
- 18.1. Global Market Share Analysis 2024
- 18.2. Company Profiles
- 18.2.1 Softbank Robotics
- 18.2.1.1. Overview
- 18.2.1.2. Products
- 18.2.1.3. SWOT Analysis
- 18.2.1.4. Recent Developments
- 18.2.1.5. Financials (Based on Availability)
- 18.2.2 SMP Robotics
- 18.2.2.1. Overview
- 18.2.2.2. Products
- 18.2.2.3. SWOT Analysis
- 18.2.2.4. Recent Developments
- 18.2.2.5. Financials (Based on Availability)
- 18.2.3 Aethon Inc (ST ENGINEERING HUB)
- 18.2.3.1. Overview
- 18.2.3.2. Products
- 18.2.3.3. SWOT Analysis
- 18.2.3.4. Recent Developments
- 18.2.3.5. Financials (Based on Availability)
- 18.2.4 Omron Corporation
- 18.2.4.1. Overview
- 18.2.4.2. Products
- 18.2.4.3. SWOT Analysis
- 18.2.4.4. Recent Developments
- 18.2.4.5. Financials (Based on Availability)
- 18.2.5 Fetch Robotics (Zebra Technologies Corporation)
- 18.2.5.1. Overview
- 18.2.5.2. Products
- 18.2.5.3. SWOT Analysis
- 18.2.5.4. Recent Developments
- 18.2.5.5. Financials (Based on Availability)
- 18.2.6 OTTO Motors
- 18.2.6.1. Overview
- 18.2.6.2. Products
- 18.2.6.3. SWOT Analysis
- 18.2.6.4. Recent Developments
- 18.2.6.5. Financials (Based on Availability)
- 18.2.7 Mobile Industrial Robots (Mir)(Teradyne Inc )
- 18.2.7.1. Overview
- 18.2.7.2. Products
- 18.2.7.3. SWOT Analysis
- 18.2.7.4. Recent Developments
- 18.2.7.5. Financials (Based on Availability)
- 18.2.8 HiK Robot
- 18.2.8.1. Overview
- 18.2.8.2. Products
- 18.2.8.3. SWOT Analysis
- 18.2.8.4. Recent Developments
- 18.2.8.5. Financials (Based on Availability)
- 18.2.9 Vecna Robotics Inc
- 18.2.9.1. Overview
- 18.2.9.2. Products
- 18.2.9.3. SWOT Analysis
- 18.2.9.4. Recent Developments
- 18.2.9.5. Financials (Based on Availability)
- 18.2.10 Seegrid Corporation
- 18.2.10.1. Overview
- 18.2.10.2. Products
- 18.2.10.3. SWOT Analysis
- 18.2.10.4. Recent Developments
- 18.2.10.5. Financials (Based on Availability)
- 18.2.11 Geek+ Technology Co Ltd
- 18.2.11.1. Overview
- 18.2.11.2. Products
- 18.2.11.3. SWOT Analysis
- 18.2.11.4. Recent Developments
- 18.2.11.5. Financials (Based on Availability)
- 18.2.12 Clearpath Robotics
- 18.2.12.1. Overview
- 18.2.12.2. Products
- 18.2.12.3. SWOT Analysis
- 18.2.12.4. Recent Developments
- 18.2.12.5. Financials (Based on Availability)
- 18.2.1 Softbank Robotics
List of Figures
- Figure 1: Global Autonomous Mobile Robots Industry Revenue Breakdown (Million, %) by Region 2024 & 2032
- Figure 2: Global Autonomous Mobile Robots Industry Volume Breakdown (K Unit, %) by Region 2024 & 2032
- Figure 3: North America Autonomous Mobile Robots Industry Revenue (Million), by Country 2024 & 2032
- Figure 4: North America Autonomous Mobile Robots Industry Volume (K Unit), by Country 2024 & 2032
- Figure 5: North America Autonomous Mobile Robots Industry Revenue Share (%), by Country 2024 & 2032
- Figure 6: North America Autonomous Mobile Robots Industry Volume Share (%), by Country 2024 & 2032
- Figure 7: Europe Autonomous Mobile Robots Industry Revenue (Million), by Country 2024 & 2032
- Figure 8: Europe Autonomous Mobile Robots Industry Volume (K Unit), by Country 2024 & 2032
- Figure 9: Europe Autonomous Mobile Robots Industry Revenue Share (%), by Country 2024 & 2032
- Figure 10: Europe Autonomous Mobile Robots Industry Volume Share (%), by Country 2024 & 2032
- Figure 11: Asia Pacific Autonomous Mobile Robots Industry Revenue (Million), by Country 2024 & 2032
- Figure 12: Asia Pacific Autonomous Mobile Robots Industry Volume (K Unit), by Country 2024 & 2032
- Figure 13: Asia Pacific Autonomous Mobile Robots Industry Revenue Share (%), by Country 2024 & 2032
- Figure 14: Asia Pacific Autonomous Mobile Robots Industry Volume Share (%), by Country 2024 & 2032
- Figure 15: South America Autonomous Mobile Robots Industry Revenue (Million), by Country 2024 & 2032
- Figure 16: South America Autonomous Mobile Robots Industry Volume (K Unit), by Country 2024 & 2032
- Figure 17: South America Autonomous Mobile Robots Industry Revenue Share (%), by Country 2024 & 2032
- Figure 18: South America Autonomous Mobile Robots Industry Volume Share (%), by Country 2024 & 2032
- Figure 19: North America Autonomous Mobile Robots Industry Revenue (Million), by Country 2024 & 2032
- Figure 20: North America Autonomous Mobile Robots Industry Volume (K Unit), by Country 2024 & 2032
- Figure 21: North America Autonomous Mobile Robots Industry Revenue Share (%), by Country 2024 & 2032
- Figure 22: North America Autonomous Mobile Robots Industry Volume Share (%), by Country 2024 & 2032
- Figure 23: MEA Autonomous Mobile Robots Industry Revenue (Million), by Country 2024 & 2032
- Figure 24: MEA Autonomous Mobile Robots Industry Volume (K Unit), by Country 2024 & 2032
- Figure 25: MEA Autonomous Mobile Robots Industry Revenue Share (%), by Country 2024 & 2032
- Figure 26: MEA Autonomous Mobile Robots Industry Volume Share (%), by Country 2024 & 2032
- Figure 27: North America Autonomous Mobile Robots Industry Revenue (Million), by Type 2024 & 2032
- Figure 28: North America Autonomous Mobile Robots Industry Volume (K Unit), by Type 2024 & 2032
- Figure 29: North America Autonomous Mobile Robots Industry Revenue Share (%), by Type 2024 & 2032
- Figure 30: North America Autonomous Mobile Robots Industry Volume Share (%), by Type 2024 & 2032
- Figure 31: North America Autonomous Mobile Robots Industry Revenue (Million), by End-user Industry 2024 & 2032
- Figure 32: North America Autonomous Mobile Robots Industry Volume (K Unit), by End-user Industry 2024 & 2032
- Figure 33: North America Autonomous Mobile Robots Industry Revenue Share (%), by End-user Industry 2024 & 2032
- Figure 34: North America Autonomous Mobile Robots Industry Volume Share (%), by End-user Industry 2024 & 2032
- Figure 35: North America Autonomous Mobile Robots Industry Revenue (Million), by Country 2024 & 2032
- Figure 36: North America Autonomous Mobile Robots Industry Volume (K Unit), by Country 2024 & 2032
- Figure 37: North America Autonomous Mobile Robots Industry Revenue Share (%), by Country 2024 & 2032
- Figure 38: North America Autonomous Mobile Robots Industry Volume Share (%), by Country 2024 & 2032
- Figure 39: Europe Autonomous Mobile Robots Industry Revenue (Million), by Type 2024 & 2032
- Figure 40: Europe Autonomous Mobile Robots Industry Volume (K Unit), by Type 2024 & 2032
- Figure 41: Europe Autonomous Mobile Robots Industry Revenue Share (%), by Type 2024 & 2032
- Figure 42: Europe Autonomous Mobile Robots Industry Volume Share (%), by Type 2024 & 2032
- Figure 43: Europe Autonomous Mobile Robots Industry Revenue (Million), by End-user Industry 2024 & 2032
- Figure 44: Europe Autonomous Mobile Robots Industry Volume (K Unit), by End-user Industry 2024 & 2032
- Figure 45: Europe Autonomous Mobile Robots Industry Revenue Share (%), by End-user Industry 2024 & 2032
- Figure 46: Europe Autonomous Mobile Robots Industry Volume Share (%), by End-user Industry 2024 & 2032
- Figure 47: Europe Autonomous Mobile Robots Industry Revenue (Million), by Country 2024 & 2032
- Figure 48: Europe Autonomous Mobile Robots Industry Volume (K Unit), by Country 2024 & 2032
- Figure 49: Europe Autonomous Mobile Robots Industry Revenue Share (%), by Country 2024 & 2032
- Figure 50: Europe Autonomous Mobile Robots Industry Volume Share (%), by Country 2024 & 2032
- Figure 51: Asia Pacific Autonomous Mobile Robots Industry Revenue (Million), by Type 2024 & 2032
- Figure 52: Asia Pacific Autonomous Mobile Robots Industry Volume (K Unit), by Type 2024 & 2032
- Figure 53: Asia Pacific Autonomous Mobile Robots Industry Revenue Share (%), by Type 2024 & 2032
- Figure 54: Asia Pacific Autonomous Mobile Robots Industry Volume Share (%), by Type 2024 & 2032
- Figure 55: Asia Pacific Autonomous Mobile Robots Industry Revenue (Million), by End-user Industry 2024 & 2032
- Figure 56: Asia Pacific Autonomous Mobile Robots Industry Volume (K Unit), by End-user Industry 2024 & 2032
- Figure 57: Asia Pacific Autonomous Mobile Robots Industry Revenue Share (%), by End-user Industry 2024 & 2032
- Figure 58: Asia Pacific Autonomous Mobile Robots Industry Volume Share (%), by End-user Industry 2024 & 2032
- Figure 59: Asia Pacific Autonomous Mobile Robots Industry Revenue (Million), by Country 2024 & 2032
- Figure 60: Asia Pacific Autonomous Mobile Robots Industry Volume (K Unit), by Country 2024 & 2032
- Figure 61: Asia Pacific Autonomous Mobile Robots Industry Revenue Share (%), by Country 2024 & 2032
- Figure 62: Asia Pacific Autonomous Mobile Robots Industry Volume Share (%), by Country 2024 & 2032
- Figure 63: Australia and New Zealand Autonomous Mobile Robots Industry Revenue (Million), by Type 2024 & 2032
- Figure 64: Australia and New Zealand Autonomous Mobile Robots Industry Volume (K Unit), by Type 2024 & 2032
- Figure 65: Australia and New Zealand Autonomous Mobile Robots Industry Revenue Share (%), by Type 2024 & 2032
- Figure 66: Australia and New Zealand Autonomous Mobile Robots Industry Volume Share (%), by Type 2024 & 2032
- Figure 67: Australia and New Zealand Autonomous Mobile Robots Industry Revenue (Million), by End-user Industry 2024 & 2032
- Figure 68: Australia and New Zealand Autonomous Mobile Robots Industry Volume (K Unit), by End-user Industry 2024 & 2032
- Figure 69: Australia and New Zealand Autonomous Mobile Robots Industry Revenue Share (%), by End-user Industry 2024 & 2032
- Figure 70: Australia and New Zealand Autonomous Mobile Robots Industry Volume Share (%), by End-user Industry 2024 & 2032
- Figure 71: Australia and New Zealand Autonomous Mobile Robots Industry Revenue (Million), by Country 2024 & 2032
- Figure 72: Australia and New Zealand Autonomous Mobile Robots Industry Volume (K Unit), by Country 2024 & 2032
- Figure 73: Australia and New Zealand Autonomous Mobile Robots Industry Revenue Share (%), by Country 2024 & 2032
- Figure 74: Australia and New Zealand Autonomous Mobile Robots Industry Volume Share (%), by Country 2024 & 2032
- Figure 75: Latin America Autonomous Mobile Robots Industry Revenue (Million), by Type 2024 & 2032
- Figure 76: Latin America Autonomous Mobile Robots Industry Volume (K Unit), by Type 2024 & 2032
- Figure 77: Latin America Autonomous Mobile Robots Industry Revenue Share (%), by Type 2024 & 2032
- Figure 78: Latin America Autonomous Mobile Robots Industry Volume Share (%), by Type 2024 & 2032
- Figure 79: Latin America Autonomous Mobile Robots Industry Revenue (Million), by End-user Industry 2024 & 2032
- Figure 80: Latin America Autonomous Mobile Robots Industry Volume (K Unit), by End-user Industry 2024 & 2032
- Figure 81: Latin America Autonomous Mobile Robots Industry Revenue Share (%), by End-user Industry 2024 & 2032
- Figure 82: Latin America Autonomous Mobile Robots Industry Volume Share (%), by End-user Industry 2024 & 2032
- Figure 83: Latin America Autonomous Mobile Robots Industry Revenue (Million), by Country 2024 & 2032
- Figure 84: Latin America Autonomous Mobile Robots Industry Volume (K Unit), by Country 2024 & 2032
- Figure 85: Latin America Autonomous Mobile Robots Industry Revenue Share (%), by Country 2024 & 2032
- Figure 86: Latin America Autonomous Mobile Robots Industry Volume Share (%), by Country 2024 & 2032
- Figure 87: Middle East and Africa Autonomous Mobile Robots Industry Revenue (Million), by Type 2024 & 2032
- Figure 88: Middle East and Africa Autonomous Mobile Robots Industry Volume (K Unit), by Type 2024 & 2032
- Figure 89: Middle East and Africa Autonomous Mobile Robots Industry Revenue Share (%), by Type 2024 & 2032
- Figure 90: Middle East and Africa Autonomous Mobile Robots Industry Volume Share (%), by Type 2024 & 2032
- Figure 91: Middle East and Africa Autonomous Mobile Robots Industry Revenue (Million), by End-user Industry 2024 & 2032
- Figure 92: Middle East and Africa Autonomous Mobile Robots Industry Volume (K Unit), by End-user Industry 2024 & 2032
- Figure 93: Middle East and Africa Autonomous Mobile Robots Industry Revenue Share (%), by End-user Industry 2024 & 2032
- Figure 94: Middle East and Africa Autonomous Mobile Robots Industry Volume Share (%), by End-user Industry 2024 & 2032
- Figure 95: Middle East and Africa Autonomous Mobile Robots Industry Revenue (Million), by Country 2024 & 2032
- Figure 96: Middle East and Africa Autonomous Mobile Robots Industry Volume (K Unit), by Country 2024 & 2032
- Figure 97: Middle East and Africa Autonomous Mobile Robots Industry Revenue Share (%), by Country 2024 & 2032
- Figure 98: Middle East and Africa Autonomous Mobile Robots Industry Volume Share (%), by Country 2024 & 2032
List of Tables
- Table 1: Global Autonomous Mobile Robots Industry Revenue Million Forecast, by Region 2019 & 2032
- Table 2: Global Autonomous Mobile Robots Industry Volume K Unit Forecast, by Region 2019 & 2032
- Table 3: Global Autonomous Mobile Robots Industry Revenue Million Forecast, by Type 2019 & 2032
- Table 4: Global Autonomous Mobile Robots Industry Volume K Unit Forecast, by Type 2019 & 2032
- Table 5: Global Autonomous Mobile Robots Industry Revenue Million Forecast, by End-user Industry 2019 & 2032
- Table 6: Global Autonomous Mobile Robots Industry Volume K Unit Forecast, by End-user Industry 2019 & 2032
- Table 7: Global Autonomous Mobile Robots Industry Revenue Million Forecast, by Region 2019 & 2032
- Table 8: Global Autonomous Mobile Robots Industry Volume K Unit Forecast, by Region 2019 & 2032
- Table 9: Global Autonomous Mobile Robots Industry Revenue Million Forecast, by Country 2019 & 2032
- Table 10: Global Autonomous Mobile Robots Industry Volume K Unit Forecast, by Country 2019 & 2032
- Table 11: United States Autonomous Mobile Robots Industry Revenue (Million) Forecast, by Application 2019 & 2032
- Table 12: United States Autonomous Mobile Robots Industry Volume (K Unit) Forecast, by Application 2019 & 2032
- Table 13: Canada Autonomous Mobile Robots Industry Revenue (Million) Forecast, by Application 2019 & 2032
- Table 14: Canada Autonomous Mobile Robots Industry Volume (K Unit) Forecast, by Application 2019 & 2032
- Table 15: Mexico Autonomous Mobile Robots Industry Revenue (Million) Forecast, by Application 2019 & 2032
- Table 16: Mexico Autonomous Mobile Robots Industry Volume (K Unit) Forecast, by Application 2019 & 2032
- Table 17: Global Autonomous Mobile Robots Industry Revenue Million Forecast, by Country 2019 & 2032
- Table 18: Global Autonomous Mobile Robots Industry Volume K Unit Forecast, by Country 2019 & 2032
- Table 19: Germany Autonomous Mobile Robots Industry Revenue (Million) Forecast, by Application 2019 & 2032
- Table 20: Germany Autonomous Mobile Robots Industry Volume (K Unit) Forecast, by Application 2019 & 2032
- Table 21: United Kingdom Autonomous Mobile Robots Industry Revenue (Million) Forecast, by Application 2019 & 2032
- Table 22: United Kingdom Autonomous Mobile Robots Industry Volume (K Unit) Forecast, by Application 2019 & 2032
- Table 23: France Autonomous Mobile Robots Industry Revenue (Million) Forecast, by Application 2019 & 2032
- Table 24: France Autonomous Mobile Robots Industry Volume (K Unit) Forecast, by Application 2019 & 2032
- Table 25: Spain Autonomous Mobile Robots Industry Revenue (Million) Forecast, by Application 2019 & 2032
- Table 26: Spain Autonomous Mobile Robots Industry Volume (K Unit) Forecast, by Application 2019 & 2032
- Table 27: Italy Autonomous Mobile Robots Industry Revenue (Million) Forecast, by Application 2019 & 2032
- Table 28: Italy Autonomous Mobile Robots Industry Volume (K Unit) Forecast, by Application 2019 & 2032
- Table 29: Spain Autonomous Mobile Robots Industry Revenue (Million) Forecast, by Application 2019 & 2032
- Table 30: Spain Autonomous Mobile Robots Industry Volume (K Unit) Forecast, by Application 2019 & 2032
- Table 31: Belgium Autonomous Mobile Robots Industry Revenue (Million) Forecast, by Application 2019 & 2032
- Table 32: Belgium Autonomous Mobile Robots Industry Volume (K Unit) Forecast, by Application 2019 & 2032
- Table 33: Netherland Autonomous Mobile Robots Industry Revenue (Million) Forecast, by Application 2019 & 2032
- Table 34: Netherland Autonomous Mobile Robots Industry Volume (K Unit) Forecast, by Application 2019 & 2032
- Table 35: Nordics Autonomous Mobile Robots Industry Revenue (Million) Forecast, by Application 2019 & 2032
- Table 36: Nordics Autonomous Mobile Robots Industry Volume (K Unit) Forecast, by Application 2019 & 2032
- Table 37: Rest of Europe Autonomous Mobile Robots Industry Revenue (Million) Forecast, by Application 2019 & 2032
- Table 38: Rest of Europe Autonomous Mobile Robots Industry Volume (K Unit) Forecast, by Application 2019 & 2032
- Table 39: Global Autonomous Mobile Robots Industry Revenue Million Forecast, by Country 2019 & 2032
- Table 40: Global Autonomous Mobile Robots Industry Volume K Unit Forecast, by Country 2019 & 2032
- Table 41: China Autonomous Mobile Robots Industry Revenue (Million) Forecast, by Application 2019 & 2032
- Table 42: China Autonomous Mobile Robots Industry Volume (K Unit) Forecast, by Application 2019 & 2032
- Table 43: Japan Autonomous Mobile Robots Industry Revenue (Million) Forecast, by Application 2019 & 2032
- Table 44: Japan Autonomous Mobile Robots Industry Volume (K Unit) Forecast, by Application 2019 & 2032
- Table 45: India Autonomous Mobile Robots Industry Revenue (Million) Forecast, by Application 2019 & 2032
- Table 46: India Autonomous Mobile Robots Industry Volume (K Unit) Forecast, by Application 2019 & 2032
- Table 47: South Korea Autonomous Mobile Robots Industry Revenue (Million) Forecast, by Application 2019 & 2032
- Table 48: South Korea Autonomous Mobile Robots Industry Volume (K Unit) Forecast, by Application 2019 & 2032
- Table 49: Southeast Asia Autonomous Mobile Robots Industry Revenue (Million) Forecast, by Application 2019 & 2032
- Table 50: Southeast Asia Autonomous Mobile Robots Industry Volume (K Unit) Forecast, by Application 2019 & 2032
- Table 51: Australia Autonomous Mobile Robots Industry Revenue (Million) Forecast, by Application 2019 & 2032
- Table 52: Australia Autonomous Mobile Robots Industry Volume (K Unit) Forecast, by Application 2019 & 2032
- Table 53: Indonesia Autonomous Mobile Robots Industry Revenue (Million) Forecast, by Application 2019 & 2032
- Table 54: Indonesia Autonomous Mobile Robots Industry Volume (K Unit) Forecast, by Application 2019 & 2032
- Table 55: Phillipes Autonomous Mobile Robots Industry Revenue (Million) Forecast, by Application 2019 & 2032
- Table 56: Phillipes Autonomous Mobile Robots Industry Volume (K Unit) Forecast, by Application 2019 & 2032
- Table 57: Singapore Autonomous Mobile Robots Industry Revenue (Million) Forecast, by Application 2019 & 2032
- Table 58: Singapore Autonomous Mobile Robots Industry Volume (K Unit) Forecast, by Application 2019 & 2032
- Table 59: Thailandc Autonomous Mobile Robots Industry Revenue (Million) Forecast, by Application 2019 & 2032
- Table 60: Thailandc Autonomous Mobile Robots Industry Volume (K Unit) Forecast, by Application 2019 & 2032
- Table 61: Rest of Asia Pacific Autonomous Mobile Robots Industry Revenue (Million) Forecast, by Application 2019 & 2032
- Table 62: Rest of Asia Pacific Autonomous Mobile Robots Industry Volume (K Unit) Forecast, by Application 2019 & 2032
- Table 63: Global Autonomous Mobile Robots Industry Revenue Million Forecast, by Country 2019 & 2032
- Table 64: Global Autonomous Mobile Robots Industry Volume K Unit Forecast, by Country 2019 & 2032
- Table 65: Brazil Autonomous Mobile Robots Industry Revenue (Million) Forecast, by Application 2019 & 2032
- Table 66: Brazil Autonomous Mobile Robots Industry Volume (K Unit) Forecast, by Application 2019 & 2032
- Table 67: Argentina Autonomous Mobile Robots Industry Revenue (Million) Forecast, by Application 2019 & 2032
- Table 68: Argentina Autonomous Mobile Robots Industry Volume (K Unit) Forecast, by Application 2019 & 2032
- Table 69: Peru Autonomous Mobile Robots Industry Revenue (Million) Forecast, by Application 2019 & 2032
- Table 70: Peru Autonomous Mobile Robots Industry Volume (K Unit) Forecast, by Application 2019 & 2032
- Table 71: Chile Autonomous Mobile Robots Industry Revenue (Million) Forecast, by Application 2019 & 2032
- Table 72: Chile Autonomous Mobile Robots Industry Volume (K Unit) Forecast, by Application 2019 & 2032
- Table 73: Colombia Autonomous Mobile Robots Industry Revenue (Million) Forecast, by Application 2019 & 2032
- Table 74: Colombia Autonomous Mobile Robots Industry Volume (K Unit) Forecast, by Application 2019 & 2032
- Table 75: Ecuador Autonomous Mobile Robots Industry Revenue (Million) Forecast, by Application 2019 & 2032
- Table 76: Ecuador Autonomous Mobile Robots Industry Volume (K Unit) Forecast, by Application 2019 & 2032
- Table 77: Venezuela Autonomous Mobile Robots Industry Revenue (Million) Forecast, by Application 2019 & 2032
- Table 78: Venezuela Autonomous Mobile Robots Industry Volume (K Unit) Forecast, by Application 2019 & 2032
- Table 79: Rest of South America Autonomous Mobile Robots Industry Revenue (Million) Forecast, by Application 2019 & 2032
- Table 80: Rest of South America Autonomous Mobile Robots Industry Volume (K Unit) Forecast, by Application 2019 & 2032
- Table 81: Global Autonomous Mobile Robots Industry Revenue Million Forecast, by Country 2019 & 2032
- Table 82: Global Autonomous Mobile Robots Industry Volume K Unit Forecast, by Country 2019 & 2032
- Table 83: United States Autonomous Mobile Robots Industry Revenue (Million) Forecast, by Application 2019 & 2032
- Table 84: United States Autonomous Mobile Robots Industry Volume (K Unit) Forecast, by Application 2019 & 2032
- Table 85: Canada Autonomous Mobile Robots Industry Revenue (Million) Forecast, by Application 2019 & 2032
- Table 86: Canada Autonomous Mobile Robots Industry Volume (K Unit) Forecast, by Application 2019 & 2032
- Table 87: Mexico Autonomous Mobile Robots Industry Revenue (Million) Forecast, by Application 2019 & 2032
- Table 88: Mexico Autonomous Mobile Robots Industry Volume (K Unit) Forecast, by Application 2019 & 2032
- Table 89: Global Autonomous Mobile Robots Industry Revenue Million Forecast, by Country 2019 & 2032
- Table 90: Global Autonomous Mobile Robots Industry Volume K Unit Forecast, by Country 2019 & 2032
- Table 91: United Arab Emirates Autonomous Mobile Robots Industry Revenue (Million) Forecast, by Application 2019 & 2032
- Table 92: United Arab Emirates Autonomous Mobile Robots Industry Volume (K Unit) Forecast, by Application 2019 & 2032
- Table 93: Saudi Arabia Autonomous Mobile Robots Industry Revenue (Million) Forecast, by Application 2019 & 2032
- Table 94: Saudi Arabia Autonomous Mobile Robots Industry Volume (K Unit) Forecast, by Application 2019 & 2032
- Table 95: South Africa Autonomous Mobile Robots Industry Revenue (Million) Forecast, by Application 2019 & 2032
- Table 96: South Africa Autonomous Mobile Robots Industry Volume (K Unit) Forecast, by Application 2019 & 2032
- Table 97: Rest of Middle East and Africa Autonomous Mobile Robots Industry Revenue (Million) Forecast, by Application 2019 & 2032
- Table 98: Rest of Middle East and Africa Autonomous Mobile Robots Industry Volume (K Unit) Forecast, by Application 2019 & 2032
- Table 99: Global Autonomous Mobile Robots Industry Revenue Million Forecast, by Type 2019 & 2032
- Table 100: Global Autonomous Mobile Robots Industry Volume K Unit Forecast, by Type 2019 & 2032
- Table 101: Global Autonomous Mobile Robots Industry Revenue Million Forecast, by End-user Industry 2019 & 2032
- Table 102: Global Autonomous Mobile Robots Industry Volume K Unit Forecast, by End-user Industry 2019 & 2032
- Table 103: Global Autonomous Mobile Robots Industry Revenue Million Forecast, by Country 2019 & 2032
- Table 104: Global Autonomous Mobile Robots Industry Volume K Unit Forecast, by Country 2019 & 2032
- Table 105: United States Autonomous Mobile Robots Industry Revenue (Million) Forecast, by Application 2019 & 2032
- Table 106: United States Autonomous Mobile Robots Industry Volume (K Unit) Forecast, by Application 2019 & 2032
- Table 107: Canada Autonomous Mobile Robots Industry Revenue (Million) Forecast, by Application 2019 & 2032
- Table 108: Canada Autonomous Mobile Robots Industry Volume (K Unit) Forecast, by Application 2019 & 2032
- Table 109: Global Autonomous Mobile Robots Industry Revenue Million Forecast, by Type 2019 & 2032
- Table 110: Global Autonomous Mobile Robots Industry Volume K Unit Forecast, by Type 2019 & 2032
- Table 111: Global Autonomous Mobile Robots Industry Revenue Million Forecast, by End-user Industry 2019 & 2032
- Table 112: Global Autonomous Mobile Robots Industry Volume K Unit Forecast, by End-user Industry 2019 & 2032
- Table 113: Global Autonomous Mobile Robots Industry Revenue Million Forecast, by Country 2019 & 2032
- Table 114: Global Autonomous Mobile Robots Industry Volume K Unit Forecast, by Country 2019 & 2032
- Table 115: United Kingdom Autonomous Mobile Robots Industry Revenue (Million) Forecast, by Application 2019 & 2032
- Table 116: United Kingdom Autonomous Mobile Robots Industry Volume (K Unit) Forecast, by Application 2019 & 2032
- Table 117: Germany Autonomous Mobile Robots Industry Revenue (Million) Forecast, by Application 2019 & 2032
- Table 118: Germany Autonomous Mobile Robots Industry Volume (K Unit) Forecast, by Application 2019 & 2032
- Table 119: France Autonomous Mobile Robots Industry Revenue (Million) Forecast, by Application 2019 & 2032
- Table 120: France Autonomous Mobile Robots Industry Volume (K Unit) Forecast, by Application 2019 & 2032
- Table 121: Global Autonomous Mobile Robots Industry Revenue Million Forecast, by Type 2019 & 2032
- Table 122: Global Autonomous Mobile Robots Industry Volume K Unit Forecast, by Type 2019 & 2032
- Table 123: Global Autonomous Mobile Robots Industry Revenue Million Forecast, by End-user Industry 2019 & 2032
- Table 124: Global Autonomous Mobile Robots Industry Volume K Unit Forecast, by End-user Industry 2019 & 2032
- Table 125: Global Autonomous Mobile Robots Industry Revenue Million Forecast, by Country 2019 & 2032
- Table 126: Global Autonomous Mobile Robots Industry Volume K Unit Forecast, by Country 2019 & 2032
- Table 127: China Autonomous Mobile Robots Industry Revenue (Million) Forecast, by Application 2019 & 2032
- Table 128: China Autonomous Mobile Robots Industry Volume (K Unit) Forecast, by Application 2019 & 2032
- Table 129: Japan Autonomous Mobile Robots Industry Revenue (Million) Forecast, by Application 2019 & 2032
- Table 130: Japan Autonomous Mobile Robots Industry Volume (K Unit) Forecast, by Application 2019 & 2032
- Table 131: India Autonomous Mobile Robots Industry Revenue (Million) Forecast, by Application 2019 & 2032
- Table 132: India Autonomous Mobile Robots Industry Volume (K Unit) Forecast, by Application 2019 & 2032
- Table 133: Global Autonomous Mobile Robots Industry Revenue Million Forecast, by Type 2019 & 2032
- Table 134: Global Autonomous Mobile Robots Industry Volume K Unit Forecast, by Type 2019 & 2032
- Table 135: Global Autonomous Mobile Robots Industry Revenue Million Forecast, by End-user Industry 2019 & 2032
- Table 136: Global Autonomous Mobile Robots Industry Volume K Unit Forecast, by End-user Industry 2019 & 2032
- Table 137: Global Autonomous Mobile Robots Industry Revenue Million Forecast, by Country 2019 & 2032
- Table 138: Global Autonomous Mobile Robots Industry Volume K Unit Forecast, by Country 2019 & 2032
- Table 139: Global Autonomous Mobile Robots Industry Revenue Million Forecast, by Type 2019 & 2032
- Table 140: Global Autonomous Mobile Robots Industry Volume K Unit Forecast, by Type 2019 & 2032
- Table 141: Global Autonomous Mobile Robots Industry Revenue Million Forecast, by End-user Industry 2019 & 2032
- Table 142: Global Autonomous Mobile Robots Industry Volume K Unit Forecast, by End-user Industry 2019 & 2032
- Table 143: Global Autonomous Mobile Robots Industry Revenue Million Forecast, by Country 2019 & 2032
- Table 144: Global Autonomous Mobile Robots Industry Volume K Unit Forecast, by Country 2019 & 2032
- Table 145: Brazil Autonomous Mobile Robots Industry Revenue (Million) Forecast, by Application 2019 & 2032
- Table 146: Brazil Autonomous Mobile Robots Industry Volume (K Unit) Forecast, by Application 2019 & 2032
- Table 147: Argentina Autonomous Mobile Robots Industry Revenue (Million) Forecast, by Application 2019 & 2032
- Table 148: Argentina Autonomous Mobile Robots Industry Volume (K Unit) Forecast, by Application 2019 & 2032
- Table 149: Global Autonomous Mobile Robots Industry Revenue Million Forecast, by Type 2019 & 2032
- Table 150: Global Autonomous Mobile Robots Industry Volume K Unit Forecast, by Type 2019 & 2032
- Table 151: Global Autonomous Mobile Robots Industry Revenue Million Forecast, by End-user Industry 2019 & 2032
- Table 152: Global Autonomous Mobile Robots Industry Volume K Unit Forecast, by End-user Industry 2019 & 2032
- Table 153: Global Autonomous Mobile Robots Industry Revenue Million Forecast, by Country 2019 & 2032
- Table 154: Global Autonomous Mobile Robots Industry Volume K Unit Forecast, by Country 2019 & 2032
- Table 155: Saudi Arabia Autonomous Mobile Robots Industry Revenue (Million) Forecast, by Application 2019 & 2032
- Table 156: Saudi Arabia Autonomous Mobile Robots Industry Volume (K Unit) Forecast, by Application 2019 & 2032
- Table 157: United Arab Emirates Autonomous Mobile Robots Industry Revenue (Million) Forecast, by Application 2019 & 2032
- Table 158: United Arab Emirates Autonomous Mobile Robots Industry Volume (K Unit) Forecast, by Application 2019 & 2032
- Table 159: South Africa Autonomous Mobile Robots Industry Revenue (Million) Forecast, by Application 2019 & 2032
- Table 160: South Africa Autonomous Mobile Robots Industry Volume (K Unit) Forecast, by Application 2019 & 2032
Frequently Asked Questions
1. What is the projected Compound Annual Growth Rate (CAGR) of the Autonomous Mobile Robots Industry?
The projected CAGR is approximately 15.60%.
2. Which companies are prominent players in the Autonomous Mobile Robots Industry?
Key companies in the market include Softbank Robotics, SMP Robotics, Aethon Inc (ST ENGINEERING HUB), Omron Corporation, Fetch Robotics (Zebra Technologies Corporation), OTTO Motors, Mobile Industrial Robots (Mir)(Teradyne Inc ), HiK Robot, Vecna Robotics Inc, Seegrid Corporation, Geek+ Technology Co Ltd, Clearpath Robotics.
3. What are the main segments of the Autonomous Mobile Robots Industry?
The market segments include Type, End-user Industry.
4. Can you provide details about the market size?
The market size is estimated to be USD 3.88 Million as of 2022.
5. What are some drivers contributing to market growth?
Increasing Demand for Automation across the End-user Industries; Labor-related Challenges Coupled with Advancements in Technology.
6. What are the notable trends driving market growth?
Automotive Sector Expected to Register Significant Growth.
7. Are there any restraints impacting market growth?
Communication and Connectivity Issues; High Capital Requirements.
8. Can you provide examples of recent developments in the market?
May 2023: Mitsubishi Electric Corporation, a global leader in factory automation solutions, announced a strategic investment in Clearpath Robotics, the parent company of autonomous mobile robot leader OTTO Motors. The investment will likely expand the strategic relationship between OTTO Motors and Mitsubishi Electric and strengthen the two companies' commercial collaboration.
9. What pricing options are available for accessing the report?
Pricing options include single-user, multi-user, and enterprise licenses priced at USD 4750, USD 5250, and USD 8750 respectively.
10. Is the market size provided in terms of value or volume?
The market size is provided in terms of value, measured in Million and volume, measured in K Unit.
11. Are there any specific market keywords associated with the report?
Yes, the market keyword associated with the report is "Autonomous Mobile Robots Industry," which aids in identifying and referencing the specific market segment covered.
12. How do I determine which pricing option suits my needs best?
The pricing options vary based on user requirements and access needs. Individual users may opt for single-user licenses, while businesses requiring broader access may choose multi-user or enterprise licenses for cost-effective access to the report.
13. Are there any additional resources or data provided in the Autonomous Mobile Robots Industry report?
While the report offers comprehensive insights, it's advisable to review the specific contents or supplementary materials provided to ascertain if additional resources or data are available.
14. How can I stay updated on further developments or reports in the Autonomous Mobile Robots Industry?
To stay informed about further developments, trends, and reports in the Autonomous Mobile Robots Industry, consider subscribing to industry newsletters, following relevant companies and organizations, or regularly checking reputable industry news sources and publications.
Methodology
Step 1 - Identification of Relevant Samples Size from Population Database


Step 2 - Approaches for Defining Global Market Size (Value, Volume* & Price*)

Note*: In applicable scenarios
Step 3 - Data Sources
Primary Research
- Web Analytics
- Survey Reports
- Research Institute
- Latest Research Reports
- Opinion Leaders
Secondary Research
- Annual Reports
- White Paper
- Latest Press Release
- Industry Association
- Paid Database
- Investor Presentations

Step 4 - Data Triangulation
Involves using different sources of information in order to increase the validity of a study
These sources are likely to be stakeholders in a program - participants, other researchers, program staff, other community members, and so on.
Then we put all data in single framework & apply various statistical tools to find out the dynamic on the market.
During the analysis stage, feedback from the stakeholder groups would be compared to determine areas of agreement as well as areas of divergence


