
Key Insights
The automated endoscope reprocessor (AER) market is experiencing robust growth, driven by increasing endoscope procedures, stringent infection control regulations, and a rising awareness of healthcare-associated infections (HAIs). The market's expansion is further fueled by technological advancements in AERs, leading to improved efficiency, reduced processing times, and enhanced safety features. Hospitals and ambulatory surgery centers are the primary adopters of AERs, representing a significant portion of the market share. The high initial investment cost associated with AERs can be a restraint, particularly for smaller healthcare facilities. However, the long-term cost savings achieved through improved efficiency, reduced labor costs, and minimized risk of HAIs often outweigh the initial investment. The market is segmented based on product type (including automated washers, disinfectors, and high-level disinfectants) and end-user (hospitals, ambulatory surgery centers, and others). We project continued market expansion based on current trends, anticipating a significant contribution from the Asia-Pacific region due to increasing healthcare infrastructure development and growing adoption of minimally invasive surgical procedures.
The competitive landscape is characterized by a mix of established players and emerging companies, each offering a range of AER systems and related services. Key players are focused on innovation, strategic partnerships, and geographic expansion to gain a competitive edge. The market is witnessing increasing demand for advanced features such as integrated leak testing, automated documentation, and advanced data analytics capabilities. Furthermore, the growing emphasis on sustainable practices within healthcare is driving the adoption of AERs that are more energy-efficient and minimize water consumption. This focus on sustainability is likely to be a significant driver of future market growth, fostering innovation in environmentally friendly technologies within the AER sector. The forecast period suggests sustained growth, driven by factors outlined above, with the rate of growth potentially influenced by shifts in healthcare spending and technological advancements.
Automated Endoscope Reprocessors Industry Market Report: 2019-2033
This comprehensive report provides a detailed analysis of the Automated Endoscope Reprocessors market, encompassing market dynamics, growth trends, regional segmentation, product landscape, key players, and future outlook. The study period spans from 2019 to 2033, with 2025 serving as the base and estimated year. This report is invaluable for industry professionals, investors, and strategic decision-makers seeking a deep understanding of this vital segment within the broader medical device industry. The report covers a market valued at xx Million units in 2025, projected to reach xx Million units by 2033.
Automated Endoscope Reprocessors Industry Market Dynamics & Structure
The Automated Endoscope Reprocessors market is characterized by a moderately concentrated landscape, with key players like STERIS plc, Getinge AB, and Cantel Medical holding significant market share. Technological innovation is a primary driver, focusing on improved efficiency, automation, and enhanced safety features. Stringent regulatory frameworks, particularly concerning infection control and device safety, significantly influence market dynamics. The market faces competition from traditional manual reprocessing methods, but the growing preference for automated systems due to improved efficiency and reduced risk of infection is driving market growth. Consolidation through mergers and acquisitions (M&A) is also a notable trend, with approximately xx M&A deals observed in the historical period (2019-2024), leading to increased market concentration.
- Market Concentration: Moderately concentrated, with top 5 players holding approximately xx% market share in 2025.
- Technological Drivers: Automation, improved leak detection, faster processing times, and enhanced sterilization capabilities.
- Regulatory Framework: Stringent guidelines from bodies like FDA and other regional regulatory bodies on sterilization and infection control.
- Competitive Substitutes: Manual reprocessing methods, posing a challenge to adoption, especially in resource-constrained settings.
- End-User Demographics: Primarily hospitals and ambulatory surgery centers, with growth potential in other end-user segments like clinics and physician offices.
- M&A Trends: xx M&A deals between 2019-2024, indicating consolidation within the market and leading to increased market share for larger companies. Further consolidation is expected in the forecast period.
Automated Endoscope Reprocessors Industry Growth Trends & Insights
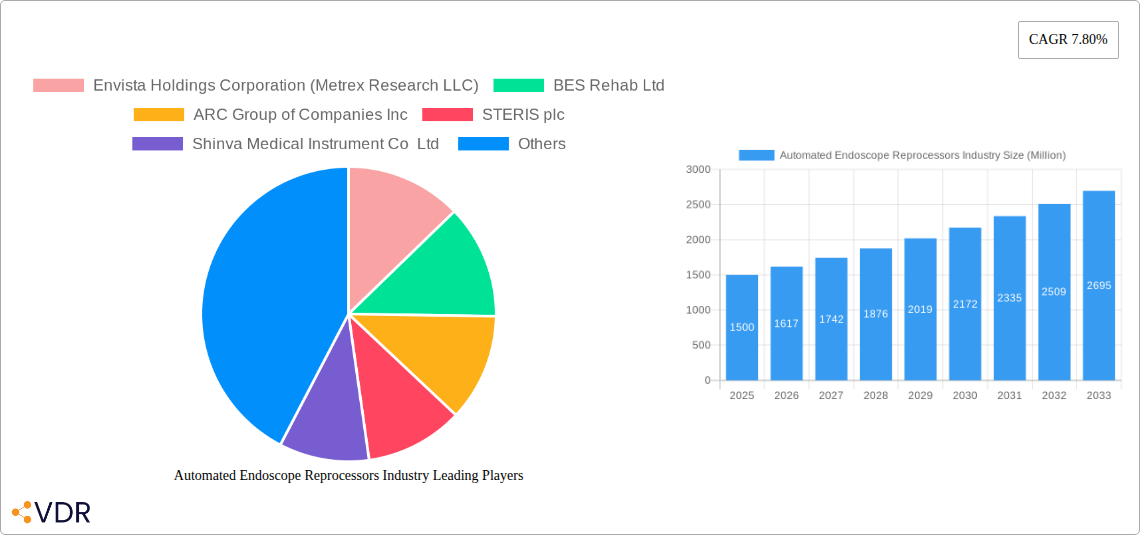
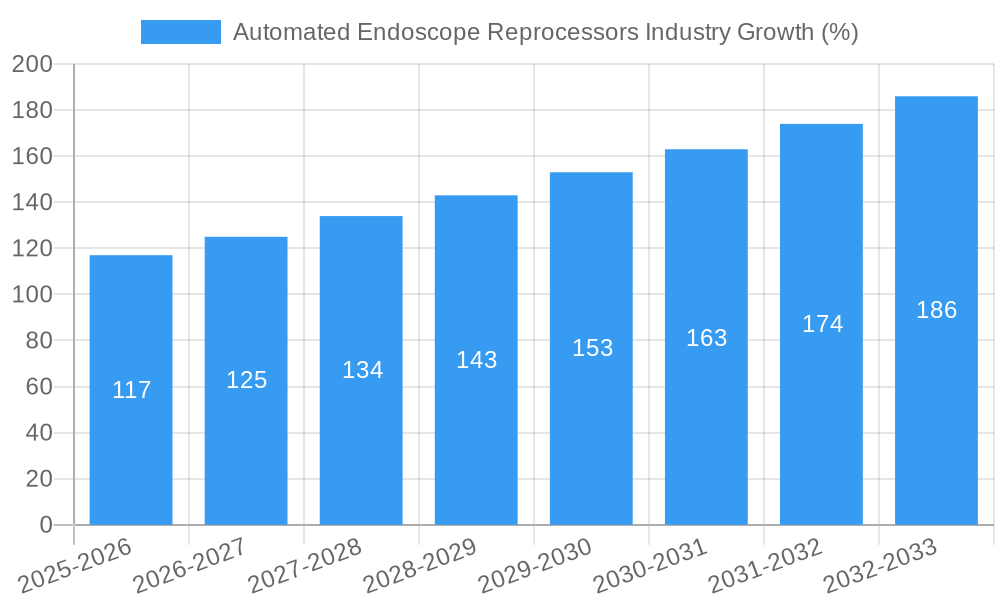
The Automated Endoscope Reprocessors market experienced a Compound Annual Growth Rate (CAGR) of xx% during the historical period (2019-2024), driven by the increasing prevalence of endoscopic procedures and the rising demand for improved infection control measures. The market is expected to maintain a healthy CAGR of xx% during the forecast period (2025-2033). This growth is fueled by technological advancements, including the integration of advanced sensors and automation, which is leading to increased adoption rates. Shifts in consumer behavior, favoring automated systems for their efficiency and safety, further contribute to this growth. Market penetration in developed regions is relatively high, but significant growth opportunities remain in emerging markets due to increasing healthcare infrastructure development and rising awareness of infection control protocols. The market size is expected to grow from xx Million units in 2025 to xx Million units by 2033.
Dominant Regions, Countries, or Segments in Automated Endoscope Reprocessors Industry
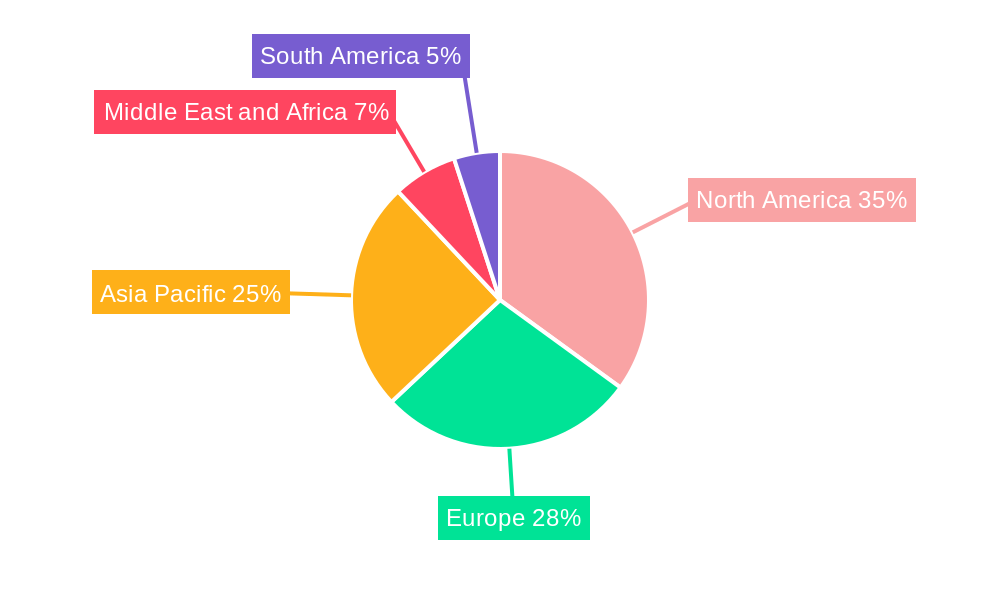
North America currently dominates the Automated Endoscope Reprocessors market, holding the largest market share in 2025 due to high adoption rates, advanced healthcare infrastructure, and favorable regulatory environment. However, the Asia-Pacific region is expected to witness the fastest growth during the forecast period, driven by increasing healthcare expenditure, growing awareness of infection control, and expanding healthcare infrastructure.
Product Segment Dominance: Automated Endoscope Reprocessors account for the largest segment, with high-level disinfectants and test strips following closely.
End-User Segment Dominance: Hospitals form the largest end-user segment, driven by high volume of endoscopic procedures.
- North America: High adoption rates, well-established healthcare infrastructure, and stringent regulatory environment.
- Europe: Significant market presence due to advanced healthcare infrastructure and established healthcare systems.
- Asia-Pacific: Fastest-growing region, driven by rising healthcare spending, expanding healthcare infrastructure, and increasing awareness of infection control.
- Other Regions: Relatively smaller market share but with potential for future growth.
Automated Endoscope Reprocessors Industry Product Landscape
The Automated Endoscope Reprocessors market offers a range of products, from basic automated cleaning and disinfection systems to advanced units integrating leak testing, high-level disinfection, and drying capabilities. Recent innovations focus on improving efficiency, reducing processing time, and enhancing traceability. Key selling points include enhanced safety features to minimize the risk of infection, ease of use, and integration with existing hospital workflows. Technological advancements include improved sensors, automated leak testing, and more efficient disinfection methods.
Key Drivers, Barriers & Challenges in Automated Endoscope Reprocessors Industry
Key Drivers:
- Increasing prevalence of endoscopic procedures.
- Rising awareness of infection control and prevention.
- Technological advancements leading to enhanced efficiency and safety.
- Stringent regulatory requirements promoting the adoption of automated systems.
Challenges & Restraints:
- High initial investment cost for automated systems, potentially acting as a barrier for smaller healthcare facilities.
- Complexity of equipment and the need for specialized training for staff.
- Potential supply chain disruptions impacting the availability of consumables and replacement parts.
- Competition from less expensive manual reprocessing methods in certain markets. This negatively impacts adoption rates in cost-sensitive regions by approximately xx% annually.
Emerging Opportunities in Automated Endoscope Reprocessors Industry
- Expansion into emerging markets with growing healthcare infrastructure.
- Development of innovative solutions for smaller healthcare facilities with limited resources.
- Integration with smart hospital systems for enhanced data management and traceability.
- Focus on developing sustainable and environmentally friendly reprocessing technologies.
Growth Accelerators in the Automated Endoscope Reprocessors Industry Industry
Technological breakthroughs in automation, sensors, and disinfection technologies are accelerating market growth. Strategic partnerships between manufacturers and healthcare providers are streamlining adoption and improving workflow integration. Market expansion strategies, focusing on emerging markets and untapped segments, are further driving growth.
Key Players Shaping the Automated Endoscope Reprocessors Industry Market
- Envista Holdings Corporation (Metrex Research LLC)
- BES Rehab Ltd
- ARC Group of Companies Inc
- STERIS plc
- Shinva Medical Instrument Co Ltd
- Cantel Medical
- Getinge AB
- Custom Ultrasonics
- Fortive Corporation (Advanced Sterilization Products)
- Ecolab Inc
- Endo-Technik W Griesat
- HOYA Corporation
- Olympus Corporation
- Steelco S p A
Notable Milestones in Automated Endoscope Reprocessors Industry Sector
- June 2022: Getinge launched an updated version of the ED-Flow automated endoscope reprocessor, enhancing efficiency and reliability.
- January 2022: Pentax Medical Europe launched the PlasmaTYPHOON ultra-fast endoscope drying and storage solution, improving productivity and traceability.
In-Depth Automated Endoscope Reprocessors Industry Market Outlook
The Automated Endoscope Reprocessors market is poised for significant growth in the coming years, driven by continued technological advancements, rising awareness of infection control, and expanding healthcare infrastructure globally. Strategic partnerships and expansion into new markets will be key factors in realizing this growth potential. Opportunities exist in developing innovative, cost-effective solutions for diverse healthcare settings. The market holds immense potential, with a projected significant increase in both market size and adoption rates across various regions, driven by strong technological advancements and regulatory support.
Automated Endoscope Reprocessors Industry Segmentation
-
1. Product
- 1.1. High-Level Disinfectants and Test Strips
- 1.2. Detergents and Wipes
- 1.3. Automated Endoscope Reprocessors
- 1.4. Endoscope Drying, Storage, and Transport Systems
- 1.5. Other Products
-
2. End User
- 2.1. Hospitals
- 2.2. Ambulatory Surgery Centers
- 2.3. Other End Users
Automated Endoscope Reprocessors Industry Segmentation By Geography
-
1. North America
- 1.1. United States
- 1.2. Canada
- 1.3. Mexico
-
2. Europe
- 2.1. Germany
- 2.2. United Kingdom
- 2.3. France
- 2.4. Italy
- 2.5. Spain
- 2.6. Rest of Europe
-
3. Asia Pacific
- 3.1. China
- 3.2. Japan
- 3.3. India
- 3.4. Australia
- 3.5. South Korea
- 3.6. Rest of Asia Pacific
-
4. Middle East and Africa
- 4.1. GCC
- 4.2. South Africa
- 4.3. Rest of Middle East and Africa
-
5. South America
- 5.1. Brazil
- 5.2. Argentina
- 5.3. Rest of South America
Automated Endoscope Reprocessors Industry REPORT HIGHLIGHTS
| Aspects | Details |
|---|---|
| Study Period | 2019-2033 |
| Base Year | 2024 |
| Estimated Year | 2025 |
| Forecast Period | 2025-2033 |
| Historical Period | 2019-2024 |
| Growth Rate | CAGR of 7.80% from 2019-2033 |
| Segmentation |
|
Table of Contents
- 1. Introduction
- 1.1. Research Scope
- 1.2. Market Segmentation
- 1.3. Research Methodology
- 1.4. Definitions and Assumptions
- 2. Executive Summary
- 2.1. Introduction
- 3. Market Dynamics
- 3.1. Introduction
- 3.2. Market Drivers
- 3.2.1 Rising Burden of Chronic Disorders and Cancer; Growing Preference for Minimally Invasive Surgeries; Growing Hospital Investments in Endoscopy Instruments
- 3.2.2 Coupled With Rising Adoption of Automated Reprocessed Endoscope
- 3.3. Market Restrains
- 3.3.1. Dearth of Skilled Professional; Concerns Regarding the Safety of Reprocessed Instruments
- 3.4. Market Trends
- 3.4.1. Automated Endoscope Reprocessors Segment is Expected to Register Good Growth Over the Forecast Period
- 4. Market Factor Analysis
- 4.1. Porters Five Forces
- 4.2. Supply/Value Chain
- 4.3. PESTEL analysis
- 4.4. Market Entropy
- 4.5. Patent/Trademark Analysis
- 5. Global Automated Endoscope Reprocessors Industry Analysis, Insights and Forecast, 2019-2031
- 5.1. Market Analysis, Insights and Forecast - by Product
- 5.1.1. High-Level Disinfectants and Test Strips
- 5.1.2. Detergents and Wipes
- 5.1.3. Automated Endoscope Reprocessors
- 5.1.4. Endoscope Drying, Storage, and Transport Systems
- 5.1.5. Other Products
- 5.2. Market Analysis, Insights and Forecast - by End User
- 5.2.1. Hospitals
- 5.2.2. Ambulatory Surgery Centers
- 5.2.3. Other End Users
- 5.3. Market Analysis, Insights and Forecast - by Region
- 5.3.1. North America
- 5.3.2. Europe
- 5.3.3. Asia Pacific
- 5.3.4. Middle East and Africa
- 5.3.5. South America
- 5.1. Market Analysis, Insights and Forecast - by Product
- 6. North America Automated Endoscope Reprocessors Industry Analysis, Insights and Forecast, 2019-2031
- 6.1. Market Analysis, Insights and Forecast - by Product
- 6.1.1. High-Level Disinfectants and Test Strips
- 6.1.2. Detergents and Wipes
- 6.1.3. Automated Endoscope Reprocessors
- 6.1.4. Endoscope Drying, Storage, and Transport Systems
- 6.1.5. Other Products
- 6.2. Market Analysis, Insights and Forecast - by End User
- 6.2.1. Hospitals
- 6.2.2. Ambulatory Surgery Centers
- 6.2.3. Other End Users
- 6.1. Market Analysis, Insights and Forecast - by Product
- 7. Europe Automated Endoscope Reprocessors Industry Analysis, Insights and Forecast, 2019-2031
- 7.1. Market Analysis, Insights and Forecast - by Product
- 7.1.1. High-Level Disinfectants and Test Strips
- 7.1.2. Detergents and Wipes
- 7.1.3. Automated Endoscope Reprocessors
- 7.1.4. Endoscope Drying, Storage, and Transport Systems
- 7.1.5. Other Products
- 7.2. Market Analysis, Insights and Forecast - by End User
- 7.2.1. Hospitals
- 7.2.2. Ambulatory Surgery Centers
- 7.2.3. Other End Users
- 7.1. Market Analysis, Insights and Forecast - by Product
- 8. Asia Pacific Automated Endoscope Reprocessors Industry Analysis, Insights and Forecast, 2019-2031
- 8.1. Market Analysis, Insights and Forecast - by Product
- 8.1.1. High-Level Disinfectants and Test Strips
- 8.1.2. Detergents and Wipes
- 8.1.3. Automated Endoscope Reprocessors
- 8.1.4. Endoscope Drying, Storage, and Transport Systems
- 8.1.5. Other Products
- 8.2. Market Analysis, Insights and Forecast - by End User
- 8.2.1. Hospitals
- 8.2.2. Ambulatory Surgery Centers
- 8.2.3. Other End Users
- 8.1. Market Analysis, Insights and Forecast - by Product
- 9. Middle East and Africa Automated Endoscope Reprocessors Industry Analysis, Insights and Forecast, 2019-2031
- 9.1. Market Analysis, Insights and Forecast - by Product
- 9.1.1. High-Level Disinfectants and Test Strips
- 9.1.2. Detergents and Wipes
- 9.1.3. Automated Endoscope Reprocessors
- 9.1.4. Endoscope Drying, Storage, and Transport Systems
- 9.1.5. Other Products
- 9.2. Market Analysis, Insights and Forecast - by End User
- 9.2.1. Hospitals
- 9.2.2. Ambulatory Surgery Centers
- 9.2.3. Other End Users
- 9.1. Market Analysis, Insights and Forecast - by Product
- 10. South America Automated Endoscope Reprocessors Industry Analysis, Insights and Forecast, 2019-2031
- 10.1. Market Analysis, Insights and Forecast - by Product
- 10.1.1. High-Level Disinfectants and Test Strips
- 10.1.2. Detergents and Wipes
- 10.1.3. Automated Endoscope Reprocessors
- 10.1.4. Endoscope Drying, Storage, and Transport Systems
- 10.1.5. Other Products
- 10.2. Market Analysis, Insights and Forecast - by End User
- 10.2.1. Hospitals
- 10.2.2. Ambulatory Surgery Centers
- 10.2.3. Other End Users
- 10.1. Market Analysis, Insights and Forecast - by Product
- 11. North America Automated Endoscope Reprocessors Industry Analysis, Insights and Forecast, 2019-2031
- 11.1. Market Analysis, Insights and Forecast - By Country/Sub-region
- 11.1.1 United States
- 11.1.2 Canada
- 11.1.3 Mexico
- 12. Europe Automated Endoscope Reprocessors Industry Analysis, Insights and Forecast, 2019-2031
- 12.1. Market Analysis, Insights and Forecast - By Country/Sub-region
- 12.1.1 Germany
- 12.1.2 United Kingdom
- 12.1.3 France
- 12.1.4 Italy
- 12.1.5 Spain
- 12.1.6 Rest of Europe
- 13. Asia Pacific Automated Endoscope Reprocessors Industry Analysis, Insights and Forecast, 2019-2031
- 13.1. Market Analysis, Insights and Forecast - By Country/Sub-region
- 13.1.1 China
- 13.1.2 Japan
- 13.1.3 India
- 13.1.4 Australia
- 13.1.5 South Korea
- 13.1.6 Rest of Asia Pacific
- 14. Middle East and Africa Automated Endoscope Reprocessors Industry Analysis, Insights and Forecast, 2019-2031
- 14.1. Market Analysis, Insights and Forecast - By Country/Sub-region
- 14.1.1 GCC
- 14.1.2 South Africa
- 14.1.3 Rest of Middle East and Africa
- 15. South America Automated Endoscope Reprocessors Industry Analysis, Insights and Forecast, 2019-2031
- 15.1. Market Analysis, Insights and Forecast - By Country/Sub-region
- 15.1.1 Brazil
- 15.1.2 Argentina
- 15.1.3 Rest of South America
- 16. Competitive Analysis
- 16.1. Global Market Share Analysis 2024
- 16.2. Company Profiles
- 16.2.1 Envista Holdings Corporation (Metrex Research LLC)
- 16.2.1.1. Overview
- 16.2.1.2. Products
- 16.2.1.3. SWOT Analysis
- 16.2.1.4. Recent Developments
- 16.2.1.5. Financials (Based on Availability)
- 16.2.2 BES Rehab Ltd
- 16.2.2.1. Overview
- 16.2.2.2. Products
- 16.2.2.3. SWOT Analysis
- 16.2.2.4. Recent Developments
- 16.2.2.5. Financials (Based on Availability)
- 16.2.3 ARC Group of Companies Inc
- 16.2.3.1. Overview
- 16.2.3.2. Products
- 16.2.3.3. SWOT Analysis
- 16.2.3.4. Recent Developments
- 16.2.3.5. Financials (Based on Availability)
- 16.2.4 STERIS plc
- 16.2.4.1. Overview
- 16.2.4.2. Products
- 16.2.4.3. SWOT Analysis
- 16.2.4.4. Recent Developments
- 16.2.4.5. Financials (Based on Availability)
- 16.2.5 Shinva Medical Instrument Co Ltd
- 16.2.5.1. Overview
- 16.2.5.2. Products
- 16.2.5.3. SWOT Analysis
- 16.2.5.4. Recent Developments
- 16.2.5.5. Financials (Based on Availability)
- 16.2.6 Cantel Medical
- 16.2.6.1. Overview
- 16.2.6.2. Products
- 16.2.6.3. SWOT Analysis
- 16.2.6.4. Recent Developments
- 16.2.6.5. Financials (Based on Availability)
- 16.2.7 Getinge AB
- 16.2.7.1. Overview
- 16.2.7.2. Products
- 16.2.7.3. SWOT Analysis
- 16.2.7.4. Recent Developments
- 16.2.7.5. Financials (Based on Availability)
- 16.2.8 Custom Ultrasonics
- 16.2.8.1. Overview
- 16.2.8.2. Products
- 16.2.8.3. SWOT Analysis
- 16.2.8.4. Recent Developments
- 16.2.8.5. Financials (Based on Availability)
- 16.2.9 Fortive Corporation (Advanced Sterilization Products)
- 16.2.9.1. Overview
- 16.2.9.2. Products
- 16.2.9.3. SWOT Analysis
- 16.2.9.4. Recent Developments
- 16.2.9.5. Financials (Based on Availability)
- 16.2.10 Ecolab Inc
- 16.2.10.1. Overview
- 16.2.10.2. Products
- 16.2.10.3. SWOT Analysis
- 16.2.10.4. Recent Developments
- 16.2.10.5. Financials (Based on Availability)
- 16.2.11 Endo-Technik W Griesat
- 16.2.11.1. Overview
- 16.2.11.2. Products
- 16.2.11.3. SWOT Analysis
- 16.2.11.4. Recent Developments
- 16.2.11.5. Financials (Based on Availability)
- 16.2.12 HOYA Corporation
- 16.2.12.1. Overview
- 16.2.12.2. Products
- 16.2.12.3. SWOT Analysis
- 16.2.12.4. Recent Developments
- 16.2.12.5. Financials (Based on Availability)
- 16.2.13 Olympus Corporation
- 16.2.13.1. Overview
- 16.2.13.2. Products
- 16.2.13.3. SWOT Analysis
- 16.2.13.4. Recent Developments
- 16.2.13.5. Financials (Based on Availability)
- 16.2.14 Steelco S p A
- 16.2.14.1. Overview
- 16.2.14.2. Products
- 16.2.14.3. SWOT Analysis
- 16.2.14.4. Recent Developments
- 16.2.14.5. Financials (Based on Availability)
- 16.2.1 Envista Holdings Corporation (Metrex Research LLC)
List of Figures
- Figure 1: Global Automated Endoscope Reprocessors Industry Revenue Breakdown (Million, %) by Region 2024 & 2032
- Figure 2: North America Automated Endoscope Reprocessors Industry Revenue (Million), by Country 2024 & 2032
- Figure 3: North America Automated Endoscope Reprocessors Industry Revenue Share (%), by Country 2024 & 2032
- Figure 4: Europe Automated Endoscope Reprocessors Industry Revenue (Million), by Country 2024 & 2032
- Figure 5: Europe Automated Endoscope Reprocessors Industry Revenue Share (%), by Country 2024 & 2032
- Figure 6: Asia Pacific Automated Endoscope Reprocessors Industry Revenue (Million), by Country 2024 & 2032
- Figure 7: Asia Pacific Automated Endoscope Reprocessors Industry Revenue Share (%), by Country 2024 & 2032
- Figure 8: Middle East and Africa Automated Endoscope Reprocessors Industry Revenue (Million), by Country 2024 & 2032
- Figure 9: Middle East and Africa Automated Endoscope Reprocessors Industry Revenue Share (%), by Country 2024 & 2032
- Figure 10: South America Automated Endoscope Reprocessors Industry Revenue (Million), by Country 2024 & 2032
- Figure 11: South America Automated Endoscope Reprocessors Industry Revenue Share (%), by Country 2024 & 2032
- Figure 12: North America Automated Endoscope Reprocessors Industry Revenue (Million), by Product 2024 & 2032
- Figure 13: North America Automated Endoscope Reprocessors Industry Revenue Share (%), by Product 2024 & 2032
- Figure 14: North America Automated Endoscope Reprocessors Industry Revenue (Million), by End User 2024 & 2032
- Figure 15: North America Automated Endoscope Reprocessors Industry Revenue Share (%), by End User 2024 & 2032
- Figure 16: North America Automated Endoscope Reprocessors Industry Revenue (Million), by Country 2024 & 2032
- Figure 17: North America Automated Endoscope Reprocessors Industry Revenue Share (%), by Country 2024 & 2032
- Figure 18: Europe Automated Endoscope Reprocessors Industry Revenue (Million), by Product 2024 & 2032
- Figure 19: Europe Automated Endoscope Reprocessors Industry Revenue Share (%), by Product 2024 & 2032
- Figure 20: Europe Automated Endoscope Reprocessors Industry Revenue (Million), by End User 2024 & 2032
- Figure 21: Europe Automated Endoscope Reprocessors Industry Revenue Share (%), by End User 2024 & 2032
- Figure 22: Europe Automated Endoscope Reprocessors Industry Revenue (Million), by Country 2024 & 2032
- Figure 23: Europe Automated Endoscope Reprocessors Industry Revenue Share (%), by Country 2024 & 2032
- Figure 24: Asia Pacific Automated Endoscope Reprocessors Industry Revenue (Million), by Product 2024 & 2032
- Figure 25: Asia Pacific Automated Endoscope Reprocessors Industry Revenue Share (%), by Product 2024 & 2032
- Figure 26: Asia Pacific Automated Endoscope Reprocessors Industry Revenue (Million), by End User 2024 & 2032
- Figure 27: Asia Pacific Automated Endoscope Reprocessors Industry Revenue Share (%), by End User 2024 & 2032
- Figure 28: Asia Pacific Automated Endoscope Reprocessors Industry Revenue (Million), by Country 2024 & 2032
- Figure 29: Asia Pacific Automated Endoscope Reprocessors Industry Revenue Share (%), by Country 2024 & 2032
- Figure 30: Middle East and Africa Automated Endoscope Reprocessors Industry Revenue (Million), by Product 2024 & 2032
- Figure 31: Middle East and Africa Automated Endoscope Reprocessors Industry Revenue Share (%), by Product 2024 & 2032
- Figure 32: Middle East and Africa Automated Endoscope Reprocessors Industry Revenue (Million), by End User 2024 & 2032
- Figure 33: Middle East and Africa Automated Endoscope Reprocessors Industry Revenue Share (%), by End User 2024 & 2032
- Figure 34: Middle East and Africa Automated Endoscope Reprocessors Industry Revenue (Million), by Country 2024 & 2032
- Figure 35: Middle East and Africa Automated Endoscope Reprocessors Industry Revenue Share (%), by Country 2024 & 2032
- Figure 36: South America Automated Endoscope Reprocessors Industry Revenue (Million), by Product 2024 & 2032
- Figure 37: South America Automated Endoscope Reprocessors Industry Revenue Share (%), by Product 2024 & 2032
- Figure 38: South America Automated Endoscope Reprocessors Industry Revenue (Million), by End User 2024 & 2032
- Figure 39: South America Automated Endoscope Reprocessors Industry Revenue Share (%), by End User 2024 & 2032
- Figure 40: South America Automated Endoscope Reprocessors Industry Revenue (Million), by Country 2024 & 2032
- Figure 41: South America Automated Endoscope Reprocessors Industry Revenue Share (%), by Country 2024 & 2032
List of Tables
- Table 1: Global Automated Endoscope Reprocessors Industry Revenue Million Forecast, by Region 2019 & 2032
- Table 2: Global Automated Endoscope Reprocessors Industry Revenue Million Forecast, by Product 2019 & 2032
- Table 3: Global Automated Endoscope Reprocessors Industry Revenue Million Forecast, by End User 2019 & 2032
- Table 4: Global Automated Endoscope Reprocessors Industry Revenue Million Forecast, by Region 2019 & 2032
- Table 5: Global Automated Endoscope Reprocessors Industry Revenue Million Forecast, by Country 2019 & 2032
- Table 6: United States Automated Endoscope Reprocessors Industry Revenue (Million) Forecast, by Application 2019 & 2032
- Table 7: Canada Automated Endoscope Reprocessors Industry Revenue (Million) Forecast, by Application 2019 & 2032
- Table 8: Mexico Automated Endoscope Reprocessors Industry Revenue (Million) Forecast, by Application 2019 & 2032
- Table 9: Global Automated Endoscope Reprocessors Industry Revenue Million Forecast, by Country 2019 & 2032
- Table 10: Germany Automated Endoscope Reprocessors Industry Revenue (Million) Forecast, by Application 2019 & 2032
- Table 11: United Kingdom Automated Endoscope Reprocessors Industry Revenue (Million) Forecast, by Application 2019 & 2032
- Table 12: France Automated Endoscope Reprocessors Industry Revenue (Million) Forecast, by Application 2019 & 2032
- Table 13: Italy Automated Endoscope Reprocessors Industry Revenue (Million) Forecast, by Application 2019 & 2032
- Table 14: Spain Automated Endoscope Reprocessors Industry Revenue (Million) Forecast, by Application 2019 & 2032
- Table 15: Rest of Europe Automated Endoscope Reprocessors Industry Revenue (Million) Forecast, by Application 2019 & 2032
- Table 16: Global Automated Endoscope Reprocessors Industry Revenue Million Forecast, by Country 2019 & 2032
- Table 17: China Automated Endoscope Reprocessors Industry Revenue (Million) Forecast, by Application 2019 & 2032
- Table 18: Japan Automated Endoscope Reprocessors Industry Revenue (Million) Forecast, by Application 2019 & 2032
- Table 19: India Automated Endoscope Reprocessors Industry Revenue (Million) Forecast, by Application 2019 & 2032
- Table 20: Australia Automated Endoscope Reprocessors Industry Revenue (Million) Forecast, by Application 2019 & 2032
- Table 21: South Korea Automated Endoscope Reprocessors Industry Revenue (Million) Forecast, by Application 2019 & 2032
- Table 22: Rest of Asia Pacific Automated Endoscope Reprocessors Industry Revenue (Million) Forecast, by Application 2019 & 2032
- Table 23: Global Automated Endoscope Reprocessors Industry Revenue Million Forecast, by Country 2019 & 2032
- Table 24: GCC Automated Endoscope Reprocessors Industry Revenue (Million) Forecast, by Application 2019 & 2032
- Table 25: South Africa Automated Endoscope Reprocessors Industry Revenue (Million) Forecast, by Application 2019 & 2032
- Table 26: Rest of Middle East and Africa Automated Endoscope Reprocessors Industry Revenue (Million) Forecast, by Application 2019 & 2032
- Table 27: Global Automated Endoscope Reprocessors Industry Revenue Million Forecast, by Country 2019 & 2032
- Table 28: Brazil Automated Endoscope Reprocessors Industry Revenue (Million) Forecast, by Application 2019 & 2032
- Table 29: Argentina Automated Endoscope Reprocessors Industry Revenue (Million) Forecast, by Application 2019 & 2032
- Table 30: Rest of South America Automated Endoscope Reprocessors Industry Revenue (Million) Forecast, by Application 2019 & 2032
- Table 31: Global Automated Endoscope Reprocessors Industry Revenue Million Forecast, by Product 2019 & 2032
- Table 32: Global Automated Endoscope Reprocessors Industry Revenue Million Forecast, by End User 2019 & 2032
- Table 33: Global Automated Endoscope Reprocessors Industry Revenue Million Forecast, by Country 2019 & 2032
- Table 34: United States Automated Endoscope Reprocessors Industry Revenue (Million) Forecast, by Application 2019 & 2032
- Table 35: Canada Automated Endoscope Reprocessors Industry Revenue (Million) Forecast, by Application 2019 & 2032
- Table 36: Mexico Automated Endoscope Reprocessors Industry Revenue (Million) Forecast, by Application 2019 & 2032
- Table 37: Global Automated Endoscope Reprocessors Industry Revenue Million Forecast, by Product 2019 & 2032
- Table 38: Global Automated Endoscope Reprocessors Industry Revenue Million Forecast, by End User 2019 & 2032
- Table 39: Global Automated Endoscope Reprocessors Industry Revenue Million Forecast, by Country 2019 & 2032
- Table 40: Germany Automated Endoscope Reprocessors Industry Revenue (Million) Forecast, by Application 2019 & 2032
- Table 41: United Kingdom Automated Endoscope Reprocessors Industry Revenue (Million) Forecast, by Application 2019 & 2032
- Table 42: France Automated Endoscope Reprocessors Industry Revenue (Million) Forecast, by Application 2019 & 2032
- Table 43: Italy Automated Endoscope Reprocessors Industry Revenue (Million) Forecast, by Application 2019 & 2032
- Table 44: Spain Automated Endoscope Reprocessors Industry Revenue (Million) Forecast, by Application 2019 & 2032
- Table 45: Rest of Europe Automated Endoscope Reprocessors Industry Revenue (Million) Forecast, by Application 2019 & 2032
- Table 46: Global Automated Endoscope Reprocessors Industry Revenue Million Forecast, by Product 2019 & 2032
- Table 47: Global Automated Endoscope Reprocessors Industry Revenue Million Forecast, by End User 2019 & 2032
- Table 48: Global Automated Endoscope Reprocessors Industry Revenue Million Forecast, by Country 2019 & 2032
- Table 49: China Automated Endoscope Reprocessors Industry Revenue (Million) Forecast, by Application 2019 & 2032
- Table 50: Japan Automated Endoscope Reprocessors Industry Revenue (Million) Forecast, by Application 2019 & 2032
- Table 51: India Automated Endoscope Reprocessors Industry Revenue (Million) Forecast, by Application 2019 & 2032
- Table 52: Australia Automated Endoscope Reprocessors Industry Revenue (Million) Forecast, by Application 2019 & 2032
- Table 53: South Korea Automated Endoscope Reprocessors Industry Revenue (Million) Forecast, by Application 2019 & 2032
- Table 54: Rest of Asia Pacific Automated Endoscope Reprocessors Industry Revenue (Million) Forecast, by Application 2019 & 2032
- Table 55: Global Automated Endoscope Reprocessors Industry Revenue Million Forecast, by Product 2019 & 2032
- Table 56: Global Automated Endoscope Reprocessors Industry Revenue Million Forecast, by End User 2019 & 2032
- Table 57: Global Automated Endoscope Reprocessors Industry Revenue Million Forecast, by Country 2019 & 2032
- Table 58: GCC Automated Endoscope Reprocessors Industry Revenue (Million) Forecast, by Application 2019 & 2032
- Table 59: South Africa Automated Endoscope Reprocessors Industry Revenue (Million) Forecast, by Application 2019 & 2032
- Table 60: Rest of Middle East and Africa Automated Endoscope Reprocessors Industry Revenue (Million) Forecast, by Application 2019 & 2032
- Table 61: Global Automated Endoscope Reprocessors Industry Revenue Million Forecast, by Product 2019 & 2032
- Table 62: Global Automated Endoscope Reprocessors Industry Revenue Million Forecast, by End User 2019 & 2032
- Table 63: Global Automated Endoscope Reprocessors Industry Revenue Million Forecast, by Country 2019 & 2032
- Table 64: Brazil Automated Endoscope Reprocessors Industry Revenue (Million) Forecast, by Application 2019 & 2032
- Table 65: Argentina Automated Endoscope Reprocessors Industry Revenue (Million) Forecast, by Application 2019 & 2032
- Table 66: Rest of South America Automated Endoscope Reprocessors Industry Revenue (Million) Forecast, by Application 2019 & 2032
Frequently Asked Questions
1. What is the projected Compound Annual Growth Rate (CAGR) of the Automated Endoscope Reprocessors Industry?
The projected CAGR is approximately 7.80%.
2. Which companies are prominent players in the Automated Endoscope Reprocessors Industry?
Key companies in the market include Envista Holdings Corporation (Metrex Research LLC), BES Rehab Ltd, ARC Group of Companies Inc, STERIS plc, Shinva Medical Instrument Co Ltd , Cantel Medical, Getinge AB, Custom Ultrasonics, Fortive Corporation (Advanced Sterilization Products), Ecolab Inc, Endo-Technik W Griesat, HOYA Corporation, Olympus Corporation, Steelco S p A.
3. What are the main segments of the Automated Endoscope Reprocessors Industry?
The market segments include Product, End User.
4. Can you provide details about the market size?
The market size is estimated to be USD XX Million as of 2022.
5. What are some drivers contributing to market growth?
Rising Burden of Chronic Disorders and Cancer; Growing Preference for Minimally Invasive Surgeries; Growing Hospital Investments in Endoscopy Instruments. Coupled With Rising Adoption of Automated Reprocessed Endoscope.
6. What are the notable trends driving market growth?
Automated Endoscope Reprocessors Segment is Expected to Register Good Growth Over the Forecast Period.
7. Are there any restraints impacting market growth?
Dearth of Skilled Professional; Concerns Regarding the Safety of Reprocessed Instruments.
8. Can you provide examples of recent developments in the market?
In June 2022, Getinge launched an updated version of the ED-Flow automated endoscope reprocessors. ED-Flow efficiently performs leak testing, cleaning, and high-level disinfection of flexible endoscopes, delivering effective, reliable results.
9. What pricing options are available for accessing the report?
Pricing options include single-user, multi-user, and enterprise licenses priced at USD 4750, USD 5250, and USD 8750 respectively.
10. Is the market size provided in terms of value or volume?
The market size is provided in terms of value, measured in Million.
11. Are there any specific market keywords associated with the report?
Yes, the market keyword associated with the report is "Automated Endoscope Reprocessors Industry," which aids in identifying and referencing the specific market segment covered.
12. How do I determine which pricing option suits my needs best?
The pricing options vary based on user requirements and access needs. Individual users may opt for single-user licenses, while businesses requiring broader access may choose multi-user or enterprise licenses for cost-effective access to the report.
13. Are there any additional resources or data provided in the Automated Endoscope Reprocessors Industry report?
While the report offers comprehensive insights, it's advisable to review the specific contents or supplementary materials provided to ascertain if additional resources or data are available.
14. How can I stay updated on further developments or reports in the Automated Endoscope Reprocessors Industry?
To stay informed about further developments, trends, and reports in the Automated Endoscope Reprocessors Industry, consider subscribing to industry newsletters, following relevant companies and organizations, or regularly checking reputable industry news sources and publications.
Methodology
Step 1 - Identification of Relevant Samples Size from Population Database


Step 2 - Approaches for Defining Global Market Size (Value, Volume* & Price*)

Note*: In applicable scenarios
Step 3 - Data Sources
Primary Research
- Web Analytics
- Survey Reports
- Research Institute
- Latest Research Reports
- Opinion Leaders
Secondary Research
- Annual Reports
- White Paper
- Latest Press Release
- Industry Association
- Paid Database
- Investor Presentations

Step 4 - Data Triangulation
Involves using different sources of information in order to increase the validity of a study
These sources are likely to be stakeholders in a program - participants, other researchers, program staff, other community members, and so on.
Then we put all data in single framework & apply various statistical tools to find out the dynamic on the market.
During the analysis stage, feedback from the stakeholder groups would be compared to determine areas of agreement as well as areas of divergence


