
Key Insights
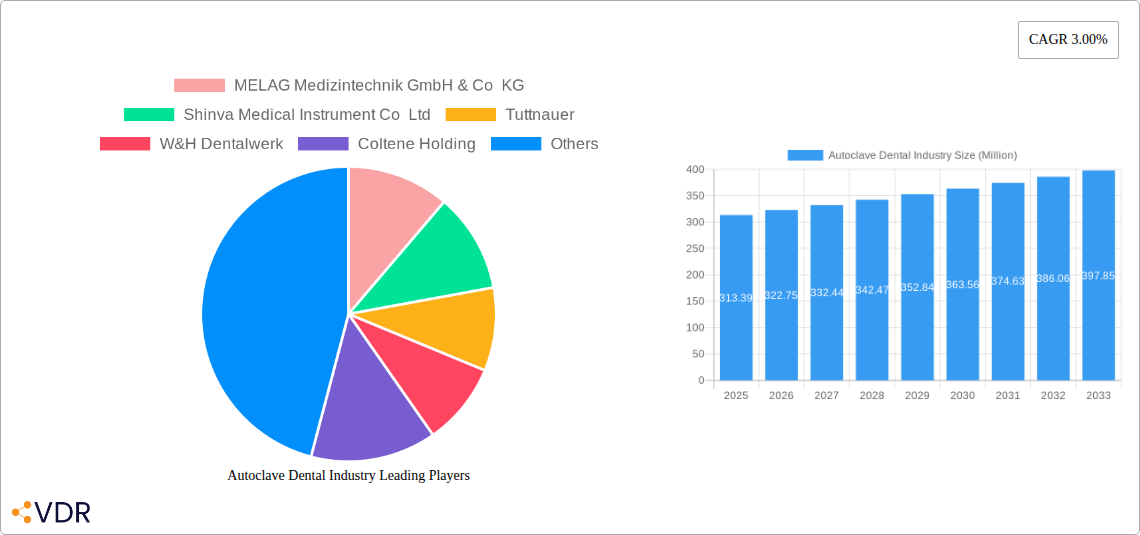
The global dental autoclave market, valued at $313.39 million in 2025, is projected to experience steady growth, driven by several key factors. The increasing prevalence of dental procedures globally, coupled with stringent infection control regulations, necessitates the widespread adoption of autoclaves for sterilizing dental instruments. Technological advancements leading to more efficient, compact, and user-friendly autoclaves are further fueling market expansion. The market segmentation reveals a preference for automatic autoclaves due to their ease of use and enhanced sterilization capabilities compared to semi-automatic and manual models. Hospitals and clinics remain the primary end-users, reflecting the critical role of sterilization in maintaining hygiene and preventing cross-contamination. However, growth in the 'other end-users' segment, encompassing smaller dental practices and laboratories, is also anticipated, contributing to overall market expansion. Geographic analysis indicates a strong market presence in North America and Europe, driven by high healthcare expenditure and established dental infrastructure. However, rapidly developing economies in Asia-Pacific are expected to exhibit significant growth potential in the coming years, owing to increasing dental tourism and rising disposable incomes. Competition among established players like MELAG, Shinva, Tuttnauer, and Dentsply Sirona is intense, fostering innovation and driving down prices, making autoclaves more accessible. While the market faces constraints such as high initial investment costs for advanced autoclaves and potential maintenance expenses, the overall growth trajectory remains positive, driven by the irreplaceable role of sterilization in modern dentistry.
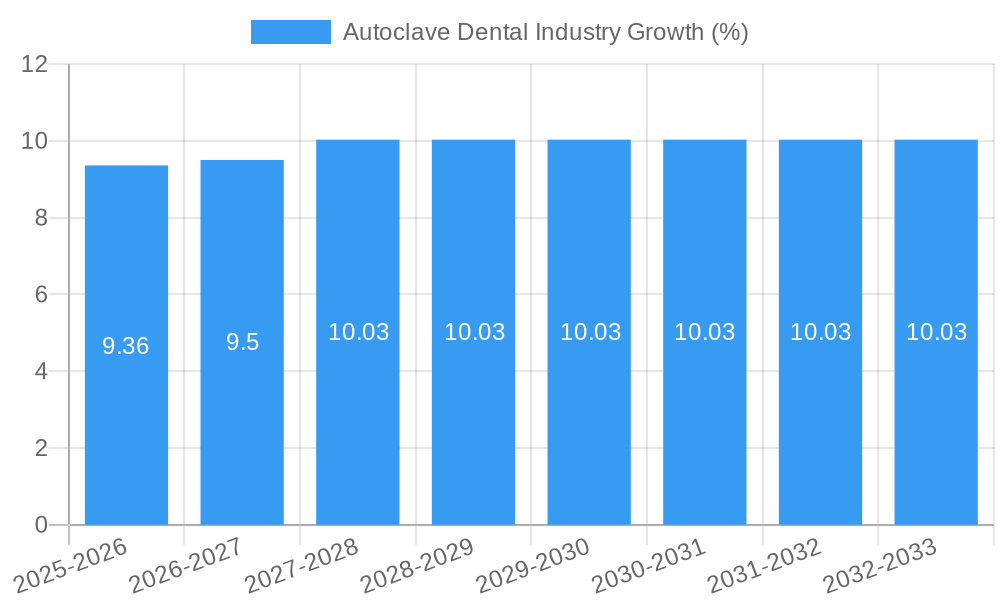
The forecast period (2025-2033) anticipates continued growth, projected at a Compound Annual Growth Rate (CAGR) of 3.00%. This growth will be influenced by the evolving needs of dental professionals, including a demand for more sustainable and energy-efficient autoclaves. Further market penetration in emerging economies and the development of innovative sterilization technologies, such as plasma sterilization, will also shape the market landscape. The competitive landscape will likely witness increased mergers and acquisitions, as companies strive to expand their product portfolios and global reach. Regulatory changes concerning sterilization standards and the ongoing development of advanced materials and technologies will continue to influence the market's trajectory throughout the forecast period. The overall outlook for the dental autoclave market remains optimistic, with substantial growth opportunities in both developed and developing nations.
Autoclave Dental Industry Market Report: 2019-2033
This comprehensive report provides an in-depth analysis of the global autoclave dental industry, offering valuable insights for industry professionals, investors, and stakeholders. The study covers the period from 2019 to 2033, with a focus on the forecast period of 2025-2033 and a base year of 2025. The market is segmented by product type (semi-automatic, automatic, manual) and end-user (hospitals and clinics, other end-users), offering a granular understanding of market dynamics. The report’s quantitative and qualitative analysis evaluates key players, including MELAG Medizintechnik GmbH & Co KG, Shinva Medical Instrument Co Ltd, Tuttnauer, W&H Dentalwerk, Coltene Holding, Dentsply Sirona, Getinge AB, Euronda, Midmark Corp, and Mocom. The total market size in 2025 is estimated at xx Million units.
Autoclave Dental Industry Market Dynamics & Structure
The autoclave dental market is characterized by moderate concentration, with a few major players holding significant market share. Technological innovation, driven by increasing demand for efficient and safe sterilization, is a key market driver. Stringent regulatory frameworks, particularly concerning sterilization efficacy and safety standards, shape industry practices. Competitive product substitutes, such as chemical disinfectants, exist but offer less comprehensive sterilization. The end-user demographic is primarily composed of dental clinics and hospitals, with a growing contribution from other end-users like research facilities. M&A activity in recent years has been relatively low (xx deals in the past 5 years), indicating a focus on organic growth among existing players.
- Market Concentration: Moderately concentrated, with the top 5 players holding approximately xx% market share in 2025.
- Technological Innovation: Focus on automated systems, improved sterilization cycles, and enhanced safety features.
- Regulatory Landscape: Stringent regulations governing sterilization processes and device safety.
- Competitive Substitutes: Chemical disinfectants pose a limited threat due to their lower efficacy.
- End-User Demographics: Primarily dental clinics and hospitals, with expanding penetration in other segments.
- M&A Activity: Relatively low, primarily driven by strategic acquisitions for technology enhancement or market expansion.
Autoclave Dental Industry Growth Trends & Insights
The global autoclave dental market experienced steady growth during the historical period (2019-2024), with a Compound Annual Growth Rate (CAGR) of xx%. This growth is primarily fueled by factors such as increasing dental procedures, rising prevalence of infectious diseases, and growing awareness of sterilization best practices. Technological advancements, particularly the introduction of automatic and semi-automatic autoclaves, have significantly improved efficiency and adoption rates. Consumer behavior shifts towards prioritizing infection control and improved sterilization methods further boost market growth. The market is projected to maintain its growth momentum in the forecast period (2025-2033), with an estimated CAGR of xx%, driven by factors outlined above and further advancements in sterilization technology.
Dominant Regions, Countries, or Segments in Autoclave Dental Industry
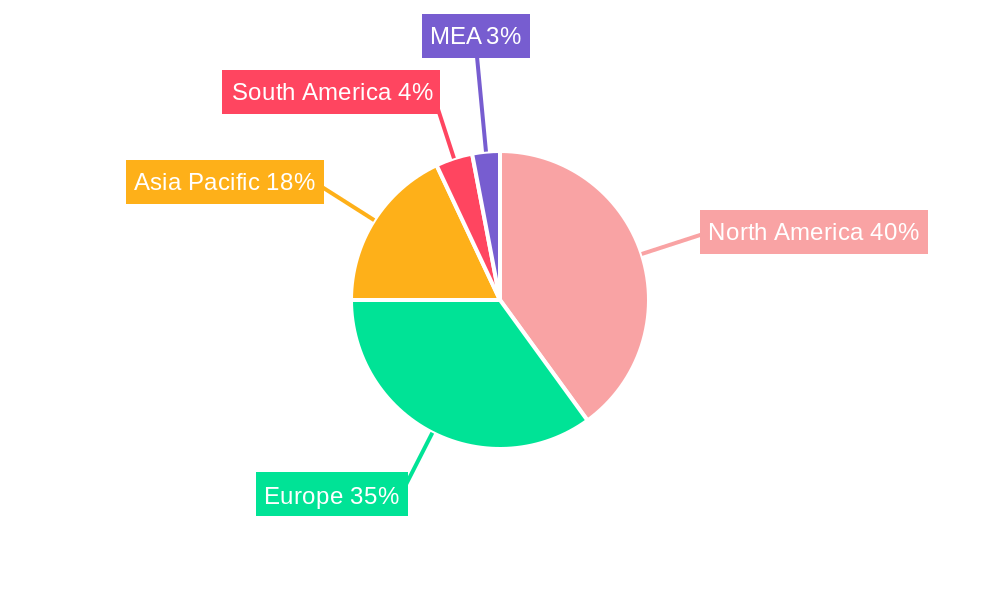
North America currently dominates the autoclave dental market, followed by Europe and Asia Pacific. Within product types, automatic autoclaves hold the largest market share due to their efficiency and ease of use (xx% in 2025). Hospitals and clinics remain the major end-users (xx% in 2025), owing to their higher volume of sterilization needs.
- North America Dominance: Driven by high adoption rates, advanced healthcare infrastructure, and stringent regulations.
- European Market Growth: Driven by increasing investment in dental care and rising adoption of advanced sterilization techniques.
- Asia Pacific Growth Potential: Rapid economic growth, expanding healthcare infrastructure, and growing awareness of infection control measures.
- Automatic Autoclaves: High market share due to convenience, efficiency, and improved safety features.
- Hospitals & Clinics: Predominant end-users due to high sterilization demands and stringent infection control protocols.
Autoclave Dental Industry Product Landscape
Autoclave dental products range from basic manual units to sophisticated automatic models incorporating advanced features like pre-programmed cycles, automated drying, and data logging capabilities. These advancements cater to diverse user needs and enhance sterilization efficacy. Key performance indicators include sterilization time, temperature accuracy, and ease of operation. Unique selling propositions often focus on efficiency gains, improved safety features, and reduced operational costs.
Key Drivers, Barriers & Challenges in Autoclave Dental Industry
Key Drivers:
- Rising prevalence of infectious diseases in dental settings.
- Increasing demand for efficient and safe sterilization methods.
- Technological advancements leading to improved product features and performance.
- Stringent regulatory requirements emphasizing sterilization efficacy.
Key Challenges:
- High initial investment costs for advanced autoclave systems can pose a barrier for smaller clinics.
- Ongoing maintenance and servicing costs can impact operational budgets.
- Supply chain disruptions impacting the availability of components and raw materials.
- Intense competition among existing players necessitates continuous innovation and differentiation.
Emerging Opportunities in Autoclave Dental Industry
Emerging opportunities include the development of portable and compact autoclaves for use in remote areas or mobile dental clinics. Moreover, integrating smart technologies, such as remote monitoring and predictive maintenance, can enhance efficiency and reduce downtime. The increasing demand for sterilization solutions in emerging markets presents significant untapped potential.
Growth Accelerators in the Autoclave Dental Industry Industry
Technological breakthroughs, such as the development of more efficient and environmentally friendly sterilization technologies, will be key drivers of market expansion. Strategic partnerships between autoclave manufacturers and dental equipment distributors can facilitate wider market access and improved product distribution. Expansion into emerging markets with unmet sterilization needs will further propel growth.
Key Players Shaping the Autoclave Dental Industry Market
- MELAG Medizintechnik GmbH & Co KG
- Shinva Medical Instrument Co Ltd
- Tuttnauer
- W&H Dentalwerk
- Coltene Holding
- Dentsply Sirona
- Getinge AB
- Euronda
- Midmark Corp
- Mocom
Notable Milestones in Autoclave Dental Industry Sector
- 2020: Dentsply Sirona launched a new line of autoclaves with advanced features.
- 2022: Tuttnauer secured FDA approval for a novel sterilization technology.
- 2023: A major merger occurred between two smaller autoclave manufacturers. (Further details unavailable, xx).
In-Depth Autoclave Dental Industry Market Outlook
The autoclave dental market is poised for sustained growth, fueled by technological innovation and increasing awareness of infection control practices. The forecast period (2025-2033) presents significant opportunities for companies to capitalize on expanding markets, particularly in developing economies. Strategic investments in research and development, coupled with effective marketing strategies targeting key user segments, will be critical for success.
Autoclave Dental Industry Segmentation
-
1. Product Type
- 1.1. Semi-automatic
- 1.2. Automatic
- 1.3. Manual
-
2. End Users
- 2.1. Hospitals and Clinics
- 2.2. Other End Users
Autoclave Dental Industry Segmentation By Geography
-
1. North America
- 1.1. US
- 1.2. Canada
- 1.3. Mexico
-
2. Europe
- 2.1. Germany
- 2.2. UK
- 2.3. France
- 2.4. Italy
- 2.5. Spain
- 2.6. Rest of Europe
-
3. Asia Pacific
- 3.1. China
- 3.2. Japan
- 3.3. India
- 3.4. Australia
- 3.5. South Korea
- 3.6. Rest of Asia Pacific
- 4. Rest of the World
Autoclave Dental Industry REPORT HIGHLIGHTS
| Aspects | Details |
|---|---|
| Study Period | 2019-2033 |
| Base Year | 2024 |
| Estimated Year | 2025 |
| Forecast Period | 2025-2033 |
| Historical Period | 2019-2024 |
| Growth Rate | CAGR of 3.00% from 2019-2033 |
| Segmentation |
|
Table of Contents
- 1. Introduction
- 1.1. Research Scope
- 1.2. Market Segmentation
- 1.3. Research Methodology
- 1.4. Definitions and Assumptions
- 2. Executive Summary
- 2.1. Introduction
- 3. Market Dynamics
- 3.1. Introduction
- 3.2. Market Drivers
- 3.2.1. Increasing Incidences of Dental Disorders and Dental Cosmetic Surgeries; Rising Patient Awareness Levels Pertaining to Sterilization; Government Initiatives toward Hygiene Policy and Sanitization
- 3.3. Market Restrains
- 3.3.1. Lack of Awareness about Dental Hygiene in Developing Countries; High Cost of Dental Autoclave
- 3.4. Market Trends
- 3.4.1. Automatic Dental Autoclave Segment Expected to Account for a Major Market Share During the Forecast Period
- 4. Market Factor Analysis
- 4.1. Porters Five Forces
- 4.2. Supply/Value Chain
- 4.3. PESTEL analysis
- 4.4. Market Entropy
- 4.5. Patent/Trademark Analysis
- 5. Global Autoclave Dental Industry Analysis, Insights and Forecast, 2019-2031
- 5.1. Market Analysis, Insights and Forecast - by Product Type
- 5.1.1. Semi-automatic
- 5.1.2. Automatic
- 5.1.3. Manual
- 5.2. Market Analysis, Insights and Forecast - by End Users
- 5.2.1. Hospitals and Clinics
- 5.2.2. Other End Users
- 5.3. Market Analysis, Insights and Forecast - by Region
- 5.3.1. North America
- 5.3.2. Europe
- 5.3.3. Asia Pacific
- 5.3.4. Rest of the World
- 5.1. Market Analysis, Insights and Forecast - by Product Type
- 6. North America Autoclave Dental Industry Analysis, Insights and Forecast, 2019-2031
- 6.1. Market Analysis, Insights and Forecast - by Product Type
- 6.1.1. Semi-automatic
- 6.1.2. Automatic
- 6.1.3. Manual
- 6.2. Market Analysis, Insights and Forecast - by End Users
- 6.2.1. Hospitals and Clinics
- 6.2.2. Other End Users
- 6.1. Market Analysis, Insights and Forecast - by Product Type
- 7. Europe Autoclave Dental Industry Analysis, Insights and Forecast, 2019-2031
- 7.1. Market Analysis, Insights and Forecast - by Product Type
- 7.1.1. Semi-automatic
- 7.1.2. Automatic
- 7.1.3. Manual
- 7.2. Market Analysis, Insights and Forecast - by End Users
- 7.2.1. Hospitals and Clinics
- 7.2.2. Other End Users
- 7.1. Market Analysis, Insights and Forecast - by Product Type
- 8. Asia Pacific Autoclave Dental Industry Analysis, Insights and Forecast, 2019-2031
- 8.1. Market Analysis, Insights and Forecast - by Product Type
- 8.1.1. Semi-automatic
- 8.1.2. Automatic
- 8.1.3. Manual
- 8.2. Market Analysis, Insights and Forecast - by End Users
- 8.2.1. Hospitals and Clinics
- 8.2.2. Other End Users
- 8.1. Market Analysis, Insights and Forecast - by Product Type
- 9. Rest of the World Autoclave Dental Industry Analysis, Insights and Forecast, 2019-2031
- 9.1. Market Analysis, Insights and Forecast - by Product Type
- 9.1.1. Semi-automatic
- 9.1.2. Automatic
- 9.1.3. Manual
- 9.2. Market Analysis, Insights and Forecast - by End Users
- 9.2.1. Hospitals and Clinics
- 9.2.2. Other End Users
- 9.1. Market Analysis, Insights and Forecast - by Product Type
- 10. North America Autoclave Dental Industry Analysis, Insights and Forecast, 2019-2031
- 10.1. Market Analysis, Insights and Forecast - By Country/Sub-region
- 10.1.1 United States
- 10.1.2 Canada
- 10.1.3 Mexico
- 11. Europe Autoclave Dental Industry Analysis, Insights and Forecast, 2019-2031
- 11.1. Market Analysis, Insights and Forecast - By Country/Sub-region
- 11.1.1 Germany
- 11.1.2 United Kingdom
- 11.1.3 France
- 11.1.4 Spain
- 11.1.5 Italy
- 11.1.6 Spain
- 11.1.7 Belgium
- 11.1.8 Netherland
- 11.1.9 Nordics
- 11.1.10 Rest of Europe
- 12. Asia Pacific Autoclave Dental Industry Analysis, Insights and Forecast, 2019-2031
- 12.1. Market Analysis, Insights and Forecast - By Country/Sub-region
- 12.1.1 China
- 12.1.2 Japan
- 12.1.3 India
- 12.1.4 South Korea
- 12.1.5 Southeast Asia
- 12.1.6 Australia
- 12.1.7 Indonesia
- 12.1.8 Phillipes
- 12.1.9 Singapore
- 12.1.10 Thailandc
- 12.1.11 Rest of Asia Pacific
- 13. South America Autoclave Dental Industry Analysis, Insights and Forecast, 2019-2031
- 13.1. Market Analysis, Insights and Forecast - By Country/Sub-region
- 13.1.1 Brazil
- 13.1.2 Argentina
- 13.1.3 Peru
- 13.1.4 Chile
- 13.1.5 Colombia
- 13.1.6 Ecuador
- 13.1.7 Venezuela
- 13.1.8 Rest of South America
- 14. North America Autoclave Dental Industry Analysis, Insights and Forecast, 2019-2031
- 14.1. Market Analysis, Insights and Forecast - By Country/Sub-region
- 14.1.1 United States
- 14.1.2 Canada
- 14.1.3 Mexico
- 15. MEA Autoclave Dental Industry Analysis, Insights and Forecast, 2019-2031
- 15.1. Market Analysis, Insights and Forecast - By Country/Sub-region
- 15.1.1 United Arab Emirates
- 15.1.2 Saudi Arabia
- 15.1.3 South Africa
- 15.1.4 Rest of Middle East and Africa
- 16. Competitive Analysis
- 16.1. Global Market Share Analysis 2024
- 16.2. Company Profiles
- 16.2.1 MELAG Medizintechnik GmbH & Co KG
- 16.2.1.1. Overview
- 16.2.1.2. Products
- 16.2.1.3. SWOT Analysis
- 16.2.1.4. Recent Developments
- 16.2.1.5. Financials (Based on Availability)
- 16.2.2 Shinva Medical Instrument Co Ltd
- 16.2.2.1. Overview
- 16.2.2.2. Products
- 16.2.2.3. SWOT Analysis
- 16.2.2.4. Recent Developments
- 16.2.2.5. Financials (Based on Availability)
- 16.2.3 Tuttnauer
- 16.2.3.1. Overview
- 16.2.3.2. Products
- 16.2.3.3. SWOT Analysis
- 16.2.3.4. Recent Developments
- 16.2.3.5. Financials (Based on Availability)
- 16.2.4 W&H Dentalwerk
- 16.2.4.1. Overview
- 16.2.4.2. Products
- 16.2.4.3. SWOT Analysis
- 16.2.4.4. Recent Developments
- 16.2.4.5. Financials (Based on Availability)
- 16.2.5 Coltene Holding
- 16.2.5.1. Overview
- 16.2.5.2. Products
- 16.2.5.3. SWOT Analysis
- 16.2.5.4. Recent Developments
- 16.2.5.5. Financials (Based on Availability)
- 16.2.6 Dentsply Sirona
- 16.2.6.1. Overview
- 16.2.6.2. Products
- 16.2.6.3. SWOT Analysis
- 16.2.6.4. Recent Developments
- 16.2.6.5. Financials (Based on Availability)
- 16.2.7 Getinge AB
- 16.2.7.1. Overview
- 16.2.7.2. Products
- 16.2.7.3. SWOT Analysis
- 16.2.7.4. Recent Developments
- 16.2.7.5. Financials (Based on Availability)
- 16.2.8 Euronda
- 16.2.8.1. Overview
- 16.2.8.2. Products
- 16.2.8.3. SWOT Analysis
- 16.2.8.4. Recent Developments
- 16.2.8.5. Financials (Based on Availability)
- 16.2.9 Midmark Corp
- 16.2.9.1. Overview
- 16.2.9.2. Products
- 16.2.9.3. SWOT Analysis
- 16.2.9.4. Recent Developments
- 16.2.9.5. Financials (Based on Availability)
- 16.2.10 Mocom
- 16.2.10.1. Overview
- 16.2.10.2. Products
- 16.2.10.3. SWOT Analysis
- 16.2.10.4. Recent Developments
- 16.2.10.5. Financials (Based on Availability)
- 16.2.1 MELAG Medizintechnik GmbH & Co KG
List of Figures
- Figure 1: Global Autoclave Dental Industry Revenue Breakdown (Million, %) by Region 2024 & 2032
- Figure 2: Global Autoclave Dental Industry Volume Breakdown (K Unit, %) by Region 2024 & 2032
- Figure 3: North America Autoclave Dental Industry Revenue (Million), by Country 2024 & 2032
- Figure 4: North America Autoclave Dental Industry Volume (K Unit), by Country 2024 & 2032
- Figure 5: North America Autoclave Dental Industry Revenue Share (%), by Country 2024 & 2032
- Figure 6: North America Autoclave Dental Industry Volume Share (%), by Country 2024 & 2032
- Figure 7: Europe Autoclave Dental Industry Revenue (Million), by Country 2024 & 2032
- Figure 8: Europe Autoclave Dental Industry Volume (K Unit), by Country 2024 & 2032
- Figure 9: Europe Autoclave Dental Industry Revenue Share (%), by Country 2024 & 2032
- Figure 10: Europe Autoclave Dental Industry Volume Share (%), by Country 2024 & 2032
- Figure 11: Asia Pacific Autoclave Dental Industry Revenue (Million), by Country 2024 & 2032
- Figure 12: Asia Pacific Autoclave Dental Industry Volume (K Unit), by Country 2024 & 2032
- Figure 13: Asia Pacific Autoclave Dental Industry Revenue Share (%), by Country 2024 & 2032
- Figure 14: Asia Pacific Autoclave Dental Industry Volume Share (%), by Country 2024 & 2032
- Figure 15: South America Autoclave Dental Industry Revenue (Million), by Country 2024 & 2032
- Figure 16: South America Autoclave Dental Industry Volume (K Unit), by Country 2024 & 2032
- Figure 17: South America Autoclave Dental Industry Revenue Share (%), by Country 2024 & 2032
- Figure 18: South America Autoclave Dental Industry Volume Share (%), by Country 2024 & 2032
- Figure 19: North America Autoclave Dental Industry Revenue (Million), by Country 2024 & 2032
- Figure 20: North America Autoclave Dental Industry Volume (K Unit), by Country 2024 & 2032
- Figure 21: North America Autoclave Dental Industry Revenue Share (%), by Country 2024 & 2032
- Figure 22: North America Autoclave Dental Industry Volume Share (%), by Country 2024 & 2032
- Figure 23: MEA Autoclave Dental Industry Revenue (Million), by Country 2024 & 2032
- Figure 24: MEA Autoclave Dental Industry Volume (K Unit), by Country 2024 & 2032
- Figure 25: MEA Autoclave Dental Industry Revenue Share (%), by Country 2024 & 2032
- Figure 26: MEA Autoclave Dental Industry Volume Share (%), by Country 2024 & 2032
- Figure 27: North America Autoclave Dental Industry Revenue (Million), by Product Type 2024 & 2032
- Figure 28: North America Autoclave Dental Industry Volume (K Unit), by Product Type 2024 & 2032
- Figure 29: North America Autoclave Dental Industry Revenue Share (%), by Product Type 2024 & 2032
- Figure 30: North America Autoclave Dental Industry Volume Share (%), by Product Type 2024 & 2032
- Figure 31: North America Autoclave Dental Industry Revenue (Million), by End Users 2024 & 2032
- Figure 32: North America Autoclave Dental Industry Volume (K Unit), by End Users 2024 & 2032
- Figure 33: North America Autoclave Dental Industry Revenue Share (%), by End Users 2024 & 2032
- Figure 34: North America Autoclave Dental Industry Volume Share (%), by End Users 2024 & 2032
- Figure 35: North America Autoclave Dental Industry Revenue (Million), by Country 2024 & 2032
- Figure 36: North America Autoclave Dental Industry Volume (K Unit), by Country 2024 & 2032
- Figure 37: North America Autoclave Dental Industry Revenue Share (%), by Country 2024 & 2032
- Figure 38: North America Autoclave Dental Industry Volume Share (%), by Country 2024 & 2032
- Figure 39: Europe Autoclave Dental Industry Revenue (Million), by Product Type 2024 & 2032
- Figure 40: Europe Autoclave Dental Industry Volume (K Unit), by Product Type 2024 & 2032
- Figure 41: Europe Autoclave Dental Industry Revenue Share (%), by Product Type 2024 & 2032
- Figure 42: Europe Autoclave Dental Industry Volume Share (%), by Product Type 2024 & 2032
- Figure 43: Europe Autoclave Dental Industry Revenue (Million), by End Users 2024 & 2032
- Figure 44: Europe Autoclave Dental Industry Volume (K Unit), by End Users 2024 & 2032
- Figure 45: Europe Autoclave Dental Industry Revenue Share (%), by End Users 2024 & 2032
- Figure 46: Europe Autoclave Dental Industry Volume Share (%), by End Users 2024 & 2032
- Figure 47: Europe Autoclave Dental Industry Revenue (Million), by Country 2024 & 2032
- Figure 48: Europe Autoclave Dental Industry Volume (K Unit), by Country 2024 & 2032
- Figure 49: Europe Autoclave Dental Industry Revenue Share (%), by Country 2024 & 2032
- Figure 50: Europe Autoclave Dental Industry Volume Share (%), by Country 2024 & 2032
- Figure 51: Asia Pacific Autoclave Dental Industry Revenue (Million), by Product Type 2024 & 2032
- Figure 52: Asia Pacific Autoclave Dental Industry Volume (K Unit), by Product Type 2024 & 2032
- Figure 53: Asia Pacific Autoclave Dental Industry Revenue Share (%), by Product Type 2024 & 2032
- Figure 54: Asia Pacific Autoclave Dental Industry Volume Share (%), by Product Type 2024 & 2032
- Figure 55: Asia Pacific Autoclave Dental Industry Revenue (Million), by End Users 2024 & 2032
- Figure 56: Asia Pacific Autoclave Dental Industry Volume (K Unit), by End Users 2024 & 2032
- Figure 57: Asia Pacific Autoclave Dental Industry Revenue Share (%), by End Users 2024 & 2032
- Figure 58: Asia Pacific Autoclave Dental Industry Volume Share (%), by End Users 2024 & 2032
- Figure 59: Asia Pacific Autoclave Dental Industry Revenue (Million), by Country 2024 & 2032
- Figure 60: Asia Pacific Autoclave Dental Industry Volume (K Unit), by Country 2024 & 2032
- Figure 61: Asia Pacific Autoclave Dental Industry Revenue Share (%), by Country 2024 & 2032
- Figure 62: Asia Pacific Autoclave Dental Industry Volume Share (%), by Country 2024 & 2032
- Figure 63: Rest of the World Autoclave Dental Industry Revenue (Million), by Product Type 2024 & 2032
- Figure 64: Rest of the World Autoclave Dental Industry Volume (K Unit), by Product Type 2024 & 2032
- Figure 65: Rest of the World Autoclave Dental Industry Revenue Share (%), by Product Type 2024 & 2032
- Figure 66: Rest of the World Autoclave Dental Industry Volume Share (%), by Product Type 2024 & 2032
- Figure 67: Rest of the World Autoclave Dental Industry Revenue (Million), by End Users 2024 & 2032
- Figure 68: Rest of the World Autoclave Dental Industry Volume (K Unit), by End Users 2024 & 2032
- Figure 69: Rest of the World Autoclave Dental Industry Revenue Share (%), by End Users 2024 & 2032
- Figure 70: Rest of the World Autoclave Dental Industry Volume Share (%), by End Users 2024 & 2032
- Figure 71: Rest of the World Autoclave Dental Industry Revenue (Million), by Country 2024 & 2032
- Figure 72: Rest of the World Autoclave Dental Industry Volume (K Unit), by Country 2024 & 2032
- Figure 73: Rest of the World Autoclave Dental Industry Revenue Share (%), by Country 2024 & 2032
- Figure 74: Rest of the World Autoclave Dental Industry Volume Share (%), by Country 2024 & 2032
List of Tables
- Table 1: Global Autoclave Dental Industry Revenue Million Forecast, by Region 2019 & 2032
- Table 2: Global Autoclave Dental Industry Volume K Unit Forecast, by Region 2019 & 2032
- Table 3: Global Autoclave Dental Industry Revenue Million Forecast, by Product Type 2019 & 2032
- Table 4: Global Autoclave Dental Industry Volume K Unit Forecast, by Product Type 2019 & 2032
- Table 5: Global Autoclave Dental Industry Revenue Million Forecast, by End Users 2019 & 2032
- Table 6: Global Autoclave Dental Industry Volume K Unit Forecast, by End Users 2019 & 2032
- Table 7: Global Autoclave Dental Industry Revenue Million Forecast, by Region 2019 & 2032
- Table 8: Global Autoclave Dental Industry Volume K Unit Forecast, by Region 2019 & 2032
- Table 9: Global Autoclave Dental Industry Revenue Million Forecast, by Country 2019 & 2032
- Table 10: Global Autoclave Dental Industry Volume K Unit Forecast, by Country 2019 & 2032
- Table 11: United States Autoclave Dental Industry Revenue (Million) Forecast, by Application 2019 & 2032
- Table 12: United States Autoclave Dental Industry Volume (K Unit) Forecast, by Application 2019 & 2032
- Table 13: Canada Autoclave Dental Industry Revenue (Million) Forecast, by Application 2019 & 2032
- Table 14: Canada Autoclave Dental Industry Volume (K Unit) Forecast, by Application 2019 & 2032
- Table 15: Mexico Autoclave Dental Industry Revenue (Million) Forecast, by Application 2019 & 2032
- Table 16: Mexico Autoclave Dental Industry Volume (K Unit) Forecast, by Application 2019 & 2032
- Table 17: Global Autoclave Dental Industry Revenue Million Forecast, by Country 2019 & 2032
- Table 18: Global Autoclave Dental Industry Volume K Unit Forecast, by Country 2019 & 2032
- Table 19: Germany Autoclave Dental Industry Revenue (Million) Forecast, by Application 2019 & 2032
- Table 20: Germany Autoclave Dental Industry Volume (K Unit) Forecast, by Application 2019 & 2032
- Table 21: United Kingdom Autoclave Dental Industry Revenue (Million) Forecast, by Application 2019 & 2032
- Table 22: United Kingdom Autoclave Dental Industry Volume (K Unit) Forecast, by Application 2019 & 2032
- Table 23: France Autoclave Dental Industry Revenue (Million) Forecast, by Application 2019 & 2032
- Table 24: France Autoclave Dental Industry Volume (K Unit) Forecast, by Application 2019 & 2032
- Table 25: Spain Autoclave Dental Industry Revenue (Million) Forecast, by Application 2019 & 2032
- Table 26: Spain Autoclave Dental Industry Volume (K Unit) Forecast, by Application 2019 & 2032
- Table 27: Italy Autoclave Dental Industry Revenue (Million) Forecast, by Application 2019 & 2032
- Table 28: Italy Autoclave Dental Industry Volume (K Unit) Forecast, by Application 2019 & 2032
- Table 29: Spain Autoclave Dental Industry Revenue (Million) Forecast, by Application 2019 & 2032
- Table 30: Spain Autoclave Dental Industry Volume (K Unit) Forecast, by Application 2019 & 2032
- Table 31: Belgium Autoclave Dental Industry Revenue (Million) Forecast, by Application 2019 & 2032
- Table 32: Belgium Autoclave Dental Industry Volume (K Unit) Forecast, by Application 2019 & 2032
- Table 33: Netherland Autoclave Dental Industry Revenue (Million) Forecast, by Application 2019 & 2032
- Table 34: Netherland Autoclave Dental Industry Volume (K Unit) Forecast, by Application 2019 & 2032
- Table 35: Nordics Autoclave Dental Industry Revenue (Million) Forecast, by Application 2019 & 2032
- Table 36: Nordics Autoclave Dental Industry Volume (K Unit) Forecast, by Application 2019 & 2032
- Table 37: Rest of Europe Autoclave Dental Industry Revenue (Million) Forecast, by Application 2019 & 2032
- Table 38: Rest of Europe Autoclave Dental Industry Volume (K Unit) Forecast, by Application 2019 & 2032
- Table 39: Global Autoclave Dental Industry Revenue Million Forecast, by Country 2019 & 2032
- Table 40: Global Autoclave Dental Industry Volume K Unit Forecast, by Country 2019 & 2032
- Table 41: China Autoclave Dental Industry Revenue (Million) Forecast, by Application 2019 & 2032
- Table 42: China Autoclave Dental Industry Volume (K Unit) Forecast, by Application 2019 & 2032
- Table 43: Japan Autoclave Dental Industry Revenue (Million) Forecast, by Application 2019 & 2032
- Table 44: Japan Autoclave Dental Industry Volume (K Unit) Forecast, by Application 2019 & 2032
- Table 45: India Autoclave Dental Industry Revenue (Million) Forecast, by Application 2019 & 2032
- Table 46: India Autoclave Dental Industry Volume (K Unit) Forecast, by Application 2019 & 2032
- Table 47: South Korea Autoclave Dental Industry Revenue (Million) Forecast, by Application 2019 & 2032
- Table 48: South Korea Autoclave Dental Industry Volume (K Unit) Forecast, by Application 2019 & 2032
- Table 49: Southeast Asia Autoclave Dental Industry Revenue (Million) Forecast, by Application 2019 & 2032
- Table 50: Southeast Asia Autoclave Dental Industry Volume (K Unit) Forecast, by Application 2019 & 2032
- Table 51: Australia Autoclave Dental Industry Revenue (Million) Forecast, by Application 2019 & 2032
- Table 52: Australia Autoclave Dental Industry Volume (K Unit) Forecast, by Application 2019 & 2032
- Table 53: Indonesia Autoclave Dental Industry Revenue (Million) Forecast, by Application 2019 & 2032
- Table 54: Indonesia Autoclave Dental Industry Volume (K Unit) Forecast, by Application 2019 & 2032
- Table 55: Phillipes Autoclave Dental Industry Revenue (Million) Forecast, by Application 2019 & 2032
- Table 56: Phillipes Autoclave Dental Industry Volume (K Unit) Forecast, by Application 2019 & 2032
- Table 57: Singapore Autoclave Dental Industry Revenue (Million) Forecast, by Application 2019 & 2032
- Table 58: Singapore Autoclave Dental Industry Volume (K Unit) Forecast, by Application 2019 & 2032
- Table 59: Thailandc Autoclave Dental Industry Revenue (Million) Forecast, by Application 2019 & 2032
- Table 60: Thailandc Autoclave Dental Industry Volume (K Unit) Forecast, by Application 2019 & 2032
- Table 61: Rest of Asia Pacific Autoclave Dental Industry Revenue (Million) Forecast, by Application 2019 & 2032
- Table 62: Rest of Asia Pacific Autoclave Dental Industry Volume (K Unit) Forecast, by Application 2019 & 2032
- Table 63: Global Autoclave Dental Industry Revenue Million Forecast, by Country 2019 & 2032
- Table 64: Global Autoclave Dental Industry Volume K Unit Forecast, by Country 2019 & 2032
- Table 65: Brazil Autoclave Dental Industry Revenue (Million) Forecast, by Application 2019 & 2032
- Table 66: Brazil Autoclave Dental Industry Volume (K Unit) Forecast, by Application 2019 & 2032
- Table 67: Argentina Autoclave Dental Industry Revenue (Million) Forecast, by Application 2019 & 2032
- Table 68: Argentina Autoclave Dental Industry Volume (K Unit) Forecast, by Application 2019 & 2032
- Table 69: Peru Autoclave Dental Industry Revenue (Million) Forecast, by Application 2019 & 2032
- Table 70: Peru Autoclave Dental Industry Volume (K Unit) Forecast, by Application 2019 & 2032
- Table 71: Chile Autoclave Dental Industry Revenue (Million) Forecast, by Application 2019 & 2032
- Table 72: Chile Autoclave Dental Industry Volume (K Unit) Forecast, by Application 2019 & 2032
- Table 73: Colombia Autoclave Dental Industry Revenue (Million) Forecast, by Application 2019 & 2032
- Table 74: Colombia Autoclave Dental Industry Volume (K Unit) Forecast, by Application 2019 & 2032
- Table 75: Ecuador Autoclave Dental Industry Revenue (Million) Forecast, by Application 2019 & 2032
- Table 76: Ecuador Autoclave Dental Industry Volume (K Unit) Forecast, by Application 2019 & 2032
- Table 77: Venezuela Autoclave Dental Industry Revenue (Million) Forecast, by Application 2019 & 2032
- Table 78: Venezuela Autoclave Dental Industry Volume (K Unit) Forecast, by Application 2019 & 2032
- Table 79: Rest of South America Autoclave Dental Industry Revenue (Million) Forecast, by Application 2019 & 2032
- Table 80: Rest of South America Autoclave Dental Industry Volume (K Unit) Forecast, by Application 2019 & 2032
- Table 81: Global Autoclave Dental Industry Revenue Million Forecast, by Country 2019 & 2032
- Table 82: Global Autoclave Dental Industry Volume K Unit Forecast, by Country 2019 & 2032
- Table 83: United States Autoclave Dental Industry Revenue (Million) Forecast, by Application 2019 & 2032
- Table 84: United States Autoclave Dental Industry Volume (K Unit) Forecast, by Application 2019 & 2032
- Table 85: Canada Autoclave Dental Industry Revenue (Million) Forecast, by Application 2019 & 2032
- Table 86: Canada Autoclave Dental Industry Volume (K Unit) Forecast, by Application 2019 & 2032
- Table 87: Mexico Autoclave Dental Industry Revenue (Million) Forecast, by Application 2019 & 2032
- Table 88: Mexico Autoclave Dental Industry Volume (K Unit) Forecast, by Application 2019 & 2032
- Table 89: Global Autoclave Dental Industry Revenue Million Forecast, by Country 2019 & 2032
- Table 90: Global Autoclave Dental Industry Volume K Unit Forecast, by Country 2019 & 2032
- Table 91: United Arab Emirates Autoclave Dental Industry Revenue (Million) Forecast, by Application 2019 & 2032
- Table 92: United Arab Emirates Autoclave Dental Industry Volume (K Unit) Forecast, by Application 2019 & 2032
- Table 93: Saudi Arabia Autoclave Dental Industry Revenue (Million) Forecast, by Application 2019 & 2032
- Table 94: Saudi Arabia Autoclave Dental Industry Volume (K Unit) Forecast, by Application 2019 & 2032
- Table 95: South Africa Autoclave Dental Industry Revenue (Million) Forecast, by Application 2019 & 2032
- Table 96: South Africa Autoclave Dental Industry Volume (K Unit) Forecast, by Application 2019 & 2032
- Table 97: Rest of Middle East and Africa Autoclave Dental Industry Revenue (Million) Forecast, by Application 2019 & 2032
- Table 98: Rest of Middle East and Africa Autoclave Dental Industry Volume (K Unit) Forecast, by Application 2019 & 2032
- Table 99: Global Autoclave Dental Industry Revenue Million Forecast, by Product Type 2019 & 2032
- Table 100: Global Autoclave Dental Industry Volume K Unit Forecast, by Product Type 2019 & 2032
- Table 101: Global Autoclave Dental Industry Revenue Million Forecast, by End Users 2019 & 2032
- Table 102: Global Autoclave Dental Industry Volume K Unit Forecast, by End Users 2019 & 2032
- Table 103: Global Autoclave Dental Industry Revenue Million Forecast, by Country 2019 & 2032
- Table 104: Global Autoclave Dental Industry Volume K Unit Forecast, by Country 2019 & 2032
- Table 105: US Autoclave Dental Industry Revenue (Million) Forecast, by Application 2019 & 2032
- Table 106: US Autoclave Dental Industry Volume (K Unit) Forecast, by Application 2019 & 2032
- Table 107: Canada Autoclave Dental Industry Revenue (Million) Forecast, by Application 2019 & 2032
- Table 108: Canada Autoclave Dental Industry Volume (K Unit) Forecast, by Application 2019 & 2032
- Table 109: Mexico Autoclave Dental Industry Revenue (Million) Forecast, by Application 2019 & 2032
- Table 110: Mexico Autoclave Dental Industry Volume (K Unit) Forecast, by Application 2019 & 2032
- Table 111: Global Autoclave Dental Industry Revenue Million Forecast, by Product Type 2019 & 2032
- Table 112: Global Autoclave Dental Industry Volume K Unit Forecast, by Product Type 2019 & 2032
- Table 113: Global Autoclave Dental Industry Revenue Million Forecast, by End Users 2019 & 2032
- Table 114: Global Autoclave Dental Industry Volume K Unit Forecast, by End Users 2019 & 2032
- Table 115: Global Autoclave Dental Industry Revenue Million Forecast, by Country 2019 & 2032
- Table 116: Global Autoclave Dental Industry Volume K Unit Forecast, by Country 2019 & 2032
- Table 117: Germany Autoclave Dental Industry Revenue (Million) Forecast, by Application 2019 & 2032
- Table 118: Germany Autoclave Dental Industry Volume (K Unit) Forecast, by Application 2019 & 2032
- Table 119: UK Autoclave Dental Industry Revenue (Million) Forecast, by Application 2019 & 2032
- Table 120: UK Autoclave Dental Industry Volume (K Unit) Forecast, by Application 2019 & 2032
- Table 121: France Autoclave Dental Industry Revenue (Million) Forecast, by Application 2019 & 2032
- Table 122: France Autoclave Dental Industry Volume (K Unit) Forecast, by Application 2019 & 2032
- Table 123: Italy Autoclave Dental Industry Revenue (Million) Forecast, by Application 2019 & 2032
- Table 124: Italy Autoclave Dental Industry Volume (K Unit) Forecast, by Application 2019 & 2032
- Table 125: Spain Autoclave Dental Industry Revenue (Million) Forecast, by Application 2019 & 2032
- Table 126: Spain Autoclave Dental Industry Volume (K Unit) Forecast, by Application 2019 & 2032
- Table 127: Rest of Europe Autoclave Dental Industry Revenue (Million) Forecast, by Application 2019 & 2032
- Table 128: Rest of Europe Autoclave Dental Industry Volume (K Unit) Forecast, by Application 2019 & 2032
- Table 129: Global Autoclave Dental Industry Revenue Million Forecast, by Product Type 2019 & 2032
- Table 130: Global Autoclave Dental Industry Volume K Unit Forecast, by Product Type 2019 & 2032
- Table 131: Global Autoclave Dental Industry Revenue Million Forecast, by End Users 2019 & 2032
- Table 132: Global Autoclave Dental Industry Volume K Unit Forecast, by End Users 2019 & 2032
- Table 133: Global Autoclave Dental Industry Revenue Million Forecast, by Country 2019 & 2032
- Table 134: Global Autoclave Dental Industry Volume K Unit Forecast, by Country 2019 & 2032
- Table 135: China Autoclave Dental Industry Revenue (Million) Forecast, by Application 2019 & 2032
- Table 136: China Autoclave Dental Industry Volume (K Unit) Forecast, by Application 2019 & 2032
- Table 137: Japan Autoclave Dental Industry Revenue (Million) Forecast, by Application 2019 & 2032
- Table 138: Japan Autoclave Dental Industry Volume (K Unit) Forecast, by Application 2019 & 2032
- Table 139: India Autoclave Dental Industry Revenue (Million) Forecast, by Application 2019 & 2032
- Table 140: India Autoclave Dental Industry Volume (K Unit) Forecast, by Application 2019 & 2032
- Table 141: Australia Autoclave Dental Industry Revenue (Million) Forecast, by Application 2019 & 2032
- Table 142: Australia Autoclave Dental Industry Volume (K Unit) Forecast, by Application 2019 & 2032
- Table 143: South Korea Autoclave Dental Industry Revenue (Million) Forecast, by Application 2019 & 2032
- Table 144: South Korea Autoclave Dental Industry Volume (K Unit) Forecast, by Application 2019 & 2032
- Table 145: Rest of Asia Pacific Autoclave Dental Industry Revenue (Million) Forecast, by Application 2019 & 2032
- Table 146: Rest of Asia Pacific Autoclave Dental Industry Volume (K Unit) Forecast, by Application 2019 & 2032
- Table 147: Global Autoclave Dental Industry Revenue Million Forecast, by Product Type 2019 & 2032
- Table 148: Global Autoclave Dental Industry Volume K Unit Forecast, by Product Type 2019 & 2032
- Table 149: Global Autoclave Dental Industry Revenue Million Forecast, by End Users 2019 & 2032
- Table 150: Global Autoclave Dental Industry Volume K Unit Forecast, by End Users 2019 & 2032
- Table 151: Global Autoclave Dental Industry Revenue Million Forecast, by Country 2019 & 2032
- Table 152: Global Autoclave Dental Industry Volume K Unit Forecast, by Country 2019 & 2032
Frequently Asked Questions
1. What is the projected Compound Annual Growth Rate (CAGR) of the Autoclave Dental Industry?
The projected CAGR is approximately 3.00%.
2. Which companies are prominent players in the Autoclave Dental Industry?
Key companies in the market include MELAG Medizintechnik GmbH & Co KG, Shinva Medical Instrument Co Ltd, Tuttnauer, W&H Dentalwerk, Coltene Holding, Dentsply Sirona, Getinge AB, Euronda, Midmark Corp, Mocom.
3. What are the main segments of the Autoclave Dental Industry?
The market segments include Product Type, End Users.
4. Can you provide details about the market size?
The market size is estimated to be USD 313.39 Million as of 2022.
5. What are some drivers contributing to market growth?
Increasing Incidences of Dental Disorders and Dental Cosmetic Surgeries; Rising Patient Awareness Levels Pertaining to Sterilization; Government Initiatives toward Hygiene Policy and Sanitization.
6. What are the notable trends driving market growth?
Automatic Dental Autoclave Segment Expected to Account for a Major Market Share During the Forecast Period.
7. Are there any restraints impacting market growth?
Lack of Awareness about Dental Hygiene in Developing Countries; High Cost of Dental Autoclave.
8. Can you provide examples of recent developments in the market?
N/A
9. What pricing options are available for accessing the report?
Pricing options include single-user, multi-user, and enterprise licenses priced at USD 4750, USD 5250, and USD 8750 respectively.
10. Is the market size provided in terms of value or volume?
The market size is provided in terms of value, measured in Million and volume, measured in K Unit.
11. Are there any specific market keywords associated with the report?
Yes, the market keyword associated with the report is "Autoclave Dental Industry," which aids in identifying and referencing the specific market segment covered.
12. How do I determine which pricing option suits my needs best?
The pricing options vary based on user requirements and access needs. Individual users may opt for single-user licenses, while businesses requiring broader access may choose multi-user or enterprise licenses for cost-effective access to the report.
13. Are there any additional resources or data provided in the Autoclave Dental Industry report?
While the report offers comprehensive insights, it's advisable to review the specific contents or supplementary materials provided to ascertain if additional resources or data are available.
14. How can I stay updated on further developments or reports in the Autoclave Dental Industry?
To stay informed about further developments, trends, and reports in the Autoclave Dental Industry, consider subscribing to industry newsletters, following relevant companies and organizations, or regularly checking reputable industry news sources and publications.
Methodology
Step 1 - Identification of Relevant Samples Size from Population Database


Step 2 - Approaches for Defining Global Market Size (Value, Volume* & Price*)

Note*: In applicable scenarios
Step 3 - Data Sources
Primary Research
- Web Analytics
- Survey Reports
- Research Institute
- Latest Research Reports
- Opinion Leaders
Secondary Research
- Annual Reports
- White Paper
- Latest Press Release
- Industry Association
- Paid Database
- Investor Presentations

Step 4 - Data Triangulation
Involves using different sources of information in order to increase the validity of a study
These sources are likely to be stakeholders in a program - participants, other researchers, program staff, other community members, and so on.
Then we put all data in single framework & apply various statistical tools to find out the dynamic on the market.
During the analysis stage, feedback from the stakeholder groups would be compared to determine areas of agreement as well as areas of divergence


