
Key Insights
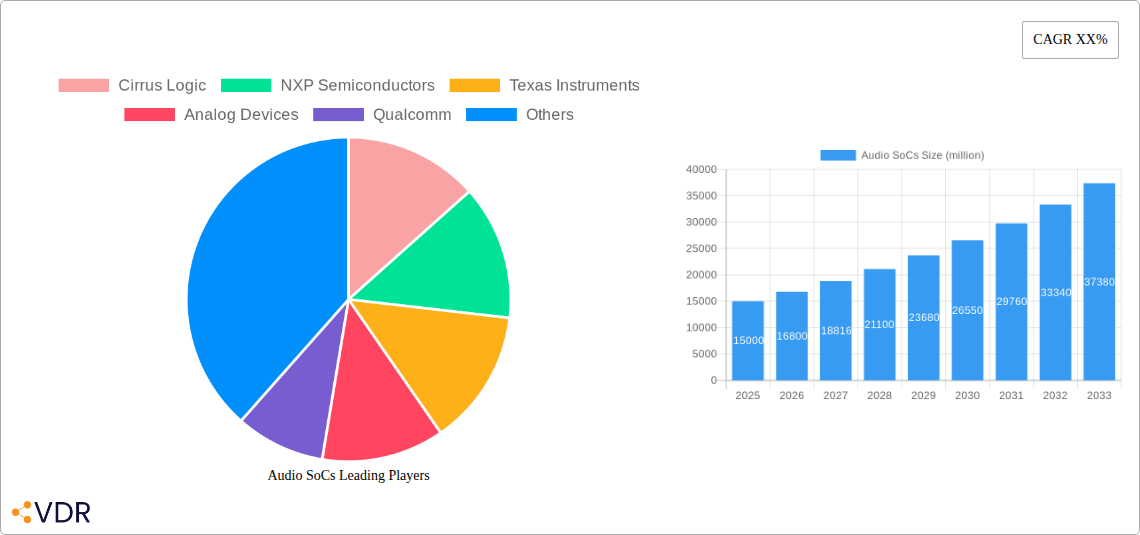
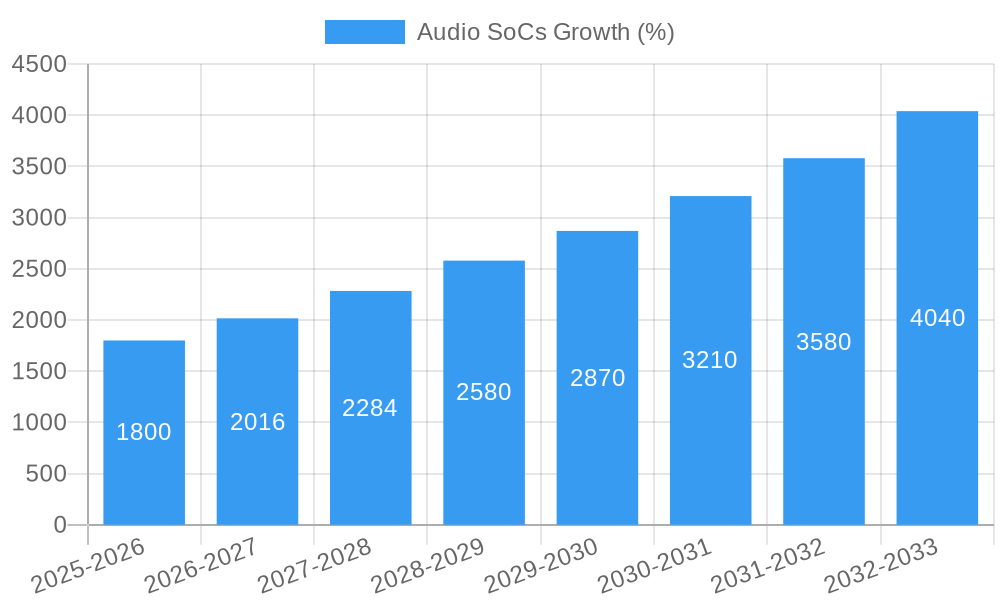
The global Audio System on a Chip (Audio SoC) market is experiencing robust growth, driven by the increasing demand for high-quality audio in diverse applications. The market, estimated at $15 billion in 2025, is projected to exhibit a Compound Annual Growth Rate (CAGR) of 12% from 2025 to 2033, reaching approximately $40 billion by 2033. This growth is fueled by several key factors, including the proliferation of smart devices (smartphones, wearables, smart speakers), the rising adoption of advanced audio technologies like noise cancellation and high-fidelity audio, and the increasing penetration of the Internet of Things (IoT). The automotive sector is also a significant contributor, with the integration of sophisticated infotainment systems and advanced driver-assistance systems (ADAS) driving demand for high-performance Audio SoCs. Leading players like Cirrus Logic, Texas Instruments, and Qualcomm are strategically investing in research and development to enhance audio processing capabilities and cater to the evolving market needs.
The market segmentation reveals a strong preference for advanced features. Segments like high-fidelity audio and noise-cancellation solutions are experiencing above-average growth rates, reflecting consumer preference for superior audio experiences. Geographical expansion is also a major driver, with emerging economies in Asia-Pacific and Latin America demonstrating significant growth potential. However, challenges such as intense competition, price pressures, and the need for continuous technological innovation pose restraints to the market's growth. To maintain competitiveness, manufacturers are focusing on providing differentiated solutions through strategic partnerships, mergers and acquisitions, and ongoing innovation in areas such as low-power consumption and miniaturization. The forecast period suggests a continued upward trajectory, with market growth likely to be propelled by technological advancements and the expansion of application areas for Audio SoCs.
Audio SoCs Market Report: 2019-2033
This comprehensive report provides an in-depth analysis of the Audio SoCs market, encompassing market dynamics, growth trends, regional segmentation, product landscape, competitive analysis, and future outlook. The study period covers 2019-2033, with 2025 as the base and estimated year. The report leverages extensive primary and secondary research to deliver actionable insights for industry professionals, investors, and strategic decision-makers. This report projects xx million units in the global Audio SoCs market by 2033. The parent market is the semiconductor market, and the child market is the audio and wearable electronics market.
Audio SoCs Market Dynamics & Structure
The Audio SoCs market is characterized by moderate concentration, with key players such as Cirrus Logic, NXP Semiconductors, Texas Instruments, Analog Devices, Qualcomm, and others holding significant market share. Technological innovation, particularly in low-power consumption and high-fidelity audio processing, is a major driver. Regulatory frameworks concerning electronic waste and energy efficiency are also influential. Competitive product substitutes include discrete audio components, but SoCs offer advantages in integration and cost-effectiveness. The end-user demographic is expanding rapidly, driven by the increasing adoption of smartphones, wearables, and hearables. M&A activity has been moderate, with xx deals recorded between 2019 and 2024, resulting in a market share shift of approximately xx%.
- Market Concentration: Moderately concentrated, with top 5 players holding xx% market share in 2024.
- Technological Drivers: Low-power consumption, high-fidelity audio, AI-powered noise cancellation.
- Regulatory Landscape: Focus on energy efficiency and e-waste management impacting component choices.
- Competitive Substitutes: Discrete audio components facing pressure from SoC integration benefits.
- End-User Demographics: Growth fueled by rising smartphone, wearable, and hearable adoption.
- M&A Activity: xx deals between 2019-2024, resulting in xx% market share shift. Innovation barriers include high R&D costs and complexities in miniaturization.
Audio SoCs Growth Trends & Insights
The Audio SoCs market experienced robust growth during the historical period (2019-2024), with a CAGR of xx%. This growth is primarily attributed to the increasing demand for high-quality audio in consumer electronics and the rising adoption of smart devices. The market size reached xx million units in 2024, and is projected to reach xx million units by 2025, and further expand to xx million units by 2033, exhibiting a CAGR of xx% during the forecast period (2025-2033). Technological advancements such as the integration of AI for enhanced noise cancellation and improved audio processing capabilities are driving market adoption. Consumer preference for superior audio quality and immersive sound experiences is further fueling growth. Market penetration is expected to increase from xx% in 2024 to xx% in 2033. Disruptions from new technologies, such as advancements in spatial audio and haptic feedback integration, will further shape market evolution.
Dominant Regions, Countries, or Segments in Audio SoCs
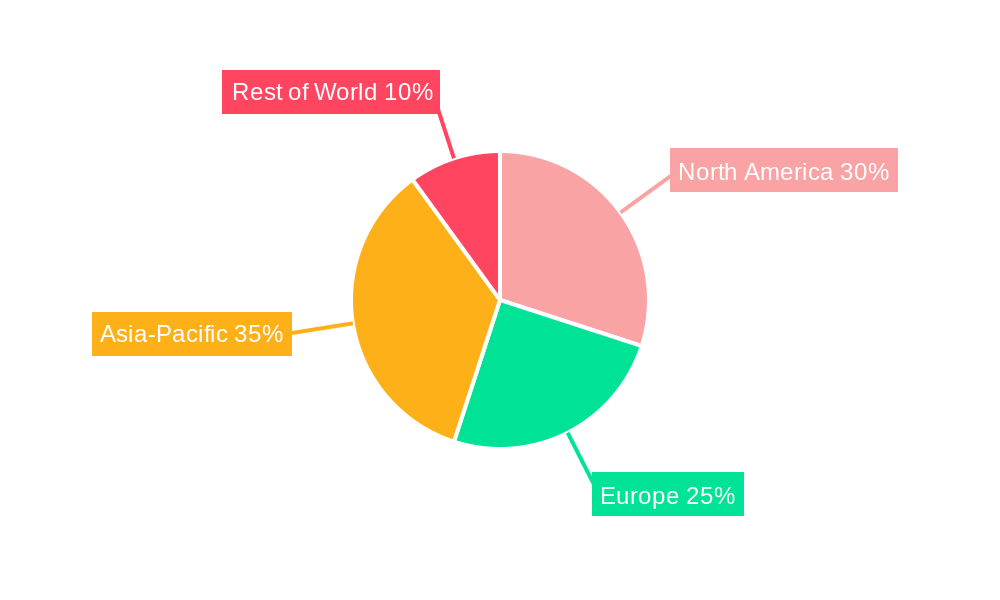
North America currently holds the largest market share in the Audio SoCs market, driven by strong demand from the consumer electronics sector and a robust technological ecosystem. Asia-Pacific is anticipated to witness the fastest growth due to increasing smartphone and wearable device penetration and expanding manufacturing capabilities. Europe also presents significant growth potential with a focus on high-quality audio experiences. Within segments, the hearables segment (smart earbuds and hearing aids) demonstrates high growth potential, driven by the increasing adoption of wireless audio devices and improved audio quality requirements for hearing aids.
- North America: High market share due to strong consumer electronics demand and technological advancements.
- Asia-Pacific: Fastest growth rate due to rising smartphone and wearable penetration, and manufacturing base.
- Europe: Significant growth potential driven by focus on high-quality audio and innovation.
- Hearables Segment: High growth potential due to increasing adoption of wireless earbuds and advanced hearing aids.
- Key Drivers: Strong consumer spending (North America), manufacturing base (Asia-Pacific), technological innovation, and government policies supporting technology adoption.
Audio SoCs Product Landscape
Audio SoCs offer a wide range of features including high-fidelity audio processing, advanced noise cancellation, low-power consumption, and multi-microphone support. These SoCs are increasingly being integrated into smartphones, wearables, hearables, and automotive applications. Unique selling propositions include advanced algorithms for noise cancellation and spatial audio rendering. Continuous improvements in power efficiency and miniaturization remain key technological advancements. New features such as support for lossless audio codecs and integration of biometric sensors are emerging.
Key Drivers, Barriers & Challenges in Audio SoCs
Key Drivers:
- Increasing demand for high-quality audio in consumer electronics.
- Rising adoption of smartphones, wearables, and hearables.
- Technological advancements in audio processing and power efficiency.
- Growing demand for immersive audio experiences.
Key Barriers & Challenges:
- Intense competition among established and emerging players.
- High R&D costs for developing advanced audio processing technologies.
- Supply chain disruptions impacting component availability and cost.
- Stringent regulatory requirements for electronic devices. The impact of supply chain issues on production costs is estimated to be xx% in 2025.
Emerging Opportunities in Audio SoCs
Emerging opportunities lie in untapped markets like the automotive sector (advanced driver-assistance systems) and the healthcare sector (hearing aids with improved sound processing and connectivity). Innovative applications like immersive audio for virtual and augmented reality and high-fidelity audio for gaming consoles represent substantial growth potential. Evolving consumer preferences for personalized audio experiences are also driving demand for advanced features. The market for high-resolution audio SoCs is expected to see substantial growth.
Growth Accelerators in the Audio SoCs Industry
Technological breakthroughs, particularly in AI-powered noise cancellation and spatial audio, are major growth accelerators. Strategic partnerships between SoC manufacturers and audio equipment makers are crucial for market expansion. The increasing integration of Audio SoCs into Internet of Things (IoT) devices and the automotive sector are driving further market expansion.
Key Players Shaping the Audio SoCs Market
- Cirrus Logic
- NXP Semiconductors
- Texas Instruments
- Analog Devices
- Qualcomm
- Realtek Semiconductor
- Conexant Systems
- Maxim Integrated
- STMicroelectronics
- Asahi Kasei Microdevices (AKM)
- Silicon Labs
Notable Milestones in Audio SoCs Sector
- 2020: Qualcomm introduced its flagship Snapdragon SoC with advanced audio capabilities.
- 2021: Texas Instruments launched a new generation of low-power audio SoCs.
- 2022: Cirrus Logic and a major hearing aid manufacturer announced a strategic partnership.
- 2023: Several key players released SoCs with support for high-resolution audio codecs. (Further milestones can be added based on actual data)
In-Depth Audio SoCs Market Outlook
The Audio SoCs market is poised for continued robust growth driven by technological innovation, expansion into new markets, and increasing demand from consumer electronics. The market’s future potential is substantial, particularly in segments like hearables and automotive applications. Strategic opportunities lie in developing advanced audio processing technologies, expanding into emerging markets, and forging strategic partnerships to enhance market penetration and establish strong brand presence.
Audio SoCs Segmentation
-
1. Application
- 1.1. Consumer Electronics
- 1.2. Automotive Systems
- 1.3. Professional Audio Equipment
-
2. Types
- 2.1. Stereo SoCs
- 2.2. Multi-channel SoCs
- 2.3. Voice SoCs
Audio SoCs Segmentation By Geography
-
1. North America
- 1.1. United States
- 1.2. Canada
- 1.3. Mexico
-
2. South America
- 2.1. Brazil
- 2.2. Argentina
- 2.3. Rest of South America
-
3. Europe
- 3.1. United Kingdom
- 3.2. Germany
- 3.3. France
- 3.4. Italy
- 3.5. Spain
- 3.6. Russia
- 3.7. Benelux
- 3.8. Nordics
- 3.9. Rest of Europe
-
4. Middle East & Africa
- 4.1. Turkey
- 4.2. Israel
- 4.3. GCC
- 4.4. North Africa
- 4.5. South Africa
- 4.6. Rest of Middle East & Africa
-
5. Asia Pacific
- 5.1. China
- 5.2. India
- 5.3. Japan
- 5.4. South Korea
- 5.5. ASEAN
- 5.6. Oceania
- 5.7. Rest of Asia Pacific
Audio SoCs REPORT HIGHLIGHTS
| Aspects | Details |
|---|---|
| Study Period | 2019-2033 |
| Base Year | 2024 |
| Estimated Year | 2025 |
| Forecast Period | 2025-2033 |
| Historical Period | 2019-2024 |
| Growth Rate | CAGR of XX% from 2019-2033 |
| Segmentation |
|
Table of Contents
- 1. Introduction
- 1.1. Research Scope
- 1.2. Market Segmentation
- 1.3. Research Methodology
- 1.4. Definitions and Assumptions
- 2. Executive Summary
- 2.1. Introduction
- 3. Market Dynamics
- 3.1. Introduction
- 3.2. Market Drivers
- 3.3. Market Restrains
- 3.4. Market Trends
- 4. Market Factor Analysis
- 4.1. Porters Five Forces
- 4.2. Supply/Value Chain
- 4.3. PESTEL analysis
- 4.4. Market Entropy
- 4.5. Patent/Trademark Analysis
- 5. Global Audio SoCs Analysis, Insights and Forecast, 2019-2031
- 5.1. Market Analysis, Insights and Forecast - by Application
- 5.1.1. Consumer Electronics
- 5.1.2. Automotive Systems
- 5.1.3. Professional Audio Equipment
- 5.2. Market Analysis, Insights and Forecast - by Types
- 5.2.1. Stereo SoCs
- 5.2.2. Multi-channel SoCs
- 5.2.3. Voice SoCs
- 5.3. Market Analysis, Insights and Forecast - by Region
- 5.3.1. North America
- 5.3.2. South America
- 5.3.3. Europe
- 5.3.4. Middle East & Africa
- 5.3.5. Asia Pacific
- 5.1. Market Analysis, Insights and Forecast - by Application
- 6. North America Audio SoCs Analysis, Insights and Forecast, 2019-2031
- 6.1. Market Analysis, Insights and Forecast - by Application
- 6.1.1. Consumer Electronics
- 6.1.2. Automotive Systems
- 6.1.3. Professional Audio Equipment
- 6.2. Market Analysis, Insights and Forecast - by Types
- 6.2.1. Stereo SoCs
- 6.2.2. Multi-channel SoCs
- 6.2.3. Voice SoCs
- 6.1. Market Analysis, Insights and Forecast - by Application
- 7. South America Audio SoCs Analysis, Insights and Forecast, 2019-2031
- 7.1. Market Analysis, Insights and Forecast - by Application
- 7.1.1. Consumer Electronics
- 7.1.2. Automotive Systems
- 7.1.3. Professional Audio Equipment
- 7.2. Market Analysis, Insights and Forecast - by Types
- 7.2.1. Stereo SoCs
- 7.2.2. Multi-channel SoCs
- 7.2.3. Voice SoCs
- 7.1. Market Analysis, Insights and Forecast - by Application
- 8. Europe Audio SoCs Analysis, Insights and Forecast, 2019-2031
- 8.1. Market Analysis, Insights and Forecast - by Application
- 8.1.1. Consumer Electronics
- 8.1.2. Automotive Systems
- 8.1.3. Professional Audio Equipment
- 8.2. Market Analysis, Insights and Forecast - by Types
- 8.2.1. Stereo SoCs
- 8.2.2. Multi-channel SoCs
- 8.2.3. Voice SoCs
- 8.1. Market Analysis, Insights and Forecast - by Application
- 9. Middle East & Africa Audio SoCs Analysis, Insights and Forecast, 2019-2031
- 9.1. Market Analysis, Insights and Forecast - by Application
- 9.1.1. Consumer Electronics
- 9.1.2. Automotive Systems
- 9.1.3. Professional Audio Equipment
- 9.2. Market Analysis, Insights and Forecast - by Types
- 9.2.1. Stereo SoCs
- 9.2.2. Multi-channel SoCs
- 9.2.3. Voice SoCs
- 9.1. Market Analysis, Insights and Forecast - by Application
- 10. Asia Pacific Audio SoCs Analysis, Insights and Forecast, 2019-2031
- 10.1. Market Analysis, Insights and Forecast - by Application
- 10.1.1. Consumer Electronics
- 10.1.2. Automotive Systems
- 10.1.3. Professional Audio Equipment
- 10.2. Market Analysis, Insights and Forecast - by Types
- 10.2.1. Stereo SoCs
- 10.2.2. Multi-channel SoCs
- 10.2.3. Voice SoCs
- 10.1. Market Analysis, Insights and Forecast - by Application
- 11. Competitive Analysis
- 11.1. Global Market Share Analysis 2024
- 11.2. Company Profiles
- 11.2.1 Cirrus Logic
- 11.2.1.1. Overview
- 11.2.1.2. Products
- 11.2.1.3. SWOT Analysis
- 11.2.1.4. Recent Developments
- 11.2.1.5. Financials (Based on Availability)
- 11.2.2 NXP Semiconductors
- 11.2.2.1. Overview
- 11.2.2.2. Products
- 11.2.2.3. SWOT Analysis
- 11.2.2.4. Recent Developments
- 11.2.2.5. Financials (Based on Availability)
- 11.2.3 Texas Instruments
- 11.2.3.1. Overview
- 11.2.3.2. Products
- 11.2.3.3. SWOT Analysis
- 11.2.3.4. Recent Developments
- 11.2.3.5. Financials (Based on Availability)
- 11.2.4 Analog Devices
- 11.2.4.1. Overview
- 11.2.4.2. Products
- 11.2.4.3. SWOT Analysis
- 11.2.4.4. Recent Developments
- 11.2.4.5. Financials (Based on Availability)
- 11.2.5 Qualcomm
- 11.2.5.1. Overview
- 11.2.5.2. Products
- 11.2.5.3. SWOT Analysis
- 11.2.5.4. Recent Developments
- 11.2.5.5. Financials (Based on Availability)
- 11.2.6 Realtek Semiconductor
- 11.2.6.1. Overview
- 11.2.6.2. Products
- 11.2.6.3. SWOT Analysis
- 11.2.6.4. Recent Developments
- 11.2.6.5. Financials (Based on Availability)
- 11.2.7 Conexant Systems
- 11.2.7.1. Overview
- 11.2.7.2. Products
- 11.2.7.3. SWOT Analysis
- 11.2.7.4. Recent Developments
- 11.2.7.5. Financials (Based on Availability)
- 11.2.8 Maxim Integrated
- 11.2.8.1. Overview
- 11.2.8.2. Products
- 11.2.8.3. SWOT Analysis
- 11.2.8.4. Recent Developments
- 11.2.8.5. Financials (Based on Availability)
- 11.2.9 STMicroelectronics
- 11.2.9.1. Overview
- 11.2.9.2. Products
- 11.2.9.3. SWOT Analysis
- 11.2.9.4. Recent Developments
- 11.2.9.5. Financials (Based on Availability)
- 11.2.10 Asahi Kasei Microdevices (AKM)
- 11.2.10.1. Overview
- 11.2.10.2. Products
- 11.2.10.3. SWOT Analysis
- 11.2.10.4. Recent Developments
- 11.2.10.5. Financials (Based on Availability)
- 11.2.11 Silicon Labs
- 11.2.11.1. Overview
- 11.2.11.2. Products
- 11.2.11.3. SWOT Analysis
- 11.2.11.4. Recent Developments
- 11.2.11.5. Financials (Based on Availability)
- 11.2.1 Cirrus Logic
List of Figures
- Figure 1: Global Audio SoCs Revenue Breakdown (million, %) by Region 2024 & 2032
- Figure 2: Global Audio SoCs Volume Breakdown (K, %) by Region 2024 & 2032
- Figure 3: North America Audio SoCs Revenue (million), by Application 2024 & 2032
- Figure 4: North America Audio SoCs Volume (K), by Application 2024 & 2032
- Figure 5: North America Audio SoCs Revenue Share (%), by Application 2024 & 2032
- Figure 6: North America Audio SoCs Volume Share (%), by Application 2024 & 2032
- Figure 7: North America Audio SoCs Revenue (million), by Types 2024 & 2032
- Figure 8: North America Audio SoCs Volume (K), by Types 2024 & 2032
- Figure 9: North America Audio SoCs Revenue Share (%), by Types 2024 & 2032
- Figure 10: North America Audio SoCs Volume Share (%), by Types 2024 & 2032
- Figure 11: North America Audio SoCs Revenue (million), by Country 2024 & 2032
- Figure 12: North America Audio SoCs Volume (K), by Country 2024 & 2032
- Figure 13: North America Audio SoCs Revenue Share (%), by Country 2024 & 2032
- Figure 14: North America Audio SoCs Volume Share (%), by Country 2024 & 2032
- Figure 15: South America Audio SoCs Revenue (million), by Application 2024 & 2032
- Figure 16: South America Audio SoCs Volume (K), by Application 2024 & 2032
- Figure 17: South America Audio SoCs Revenue Share (%), by Application 2024 & 2032
- Figure 18: South America Audio SoCs Volume Share (%), by Application 2024 & 2032
- Figure 19: South America Audio SoCs Revenue (million), by Types 2024 & 2032
- Figure 20: South America Audio SoCs Volume (K), by Types 2024 & 2032
- Figure 21: South America Audio SoCs Revenue Share (%), by Types 2024 & 2032
- Figure 22: South America Audio SoCs Volume Share (%), by Types 2024 & 2032
- Figure 23: South America Audio SoCs Revenue (million), by Country 2024 & 2032
- Figure 24: South America Audio SoCs Volume (K), by Country 2024 & 2032
- Figure 25: South America Audio SoCs Revenue Share (%), by Country 2024 & 2032
- Figure 26: South America Audio SoCs Volume Share (%), by Country 2024 & 2032
- Figure 27: Europe Audio SoCs Revenue (million), by Application 2024 & 2032
- Figure 28: Europe Audio SoCs Volume (K), by Application 2024 & 2032
- Figure 29: Europe Audio SoCs Revenue Share (%), by Application 2024 & 2032
- Figure 30: Europe Audio SoCs Volume Share (%), by Application 2024 & 2032
- Figure 31: Europe Audio SoCs Revenue (million), by Types 2024 & 2032
- Figure 32: Europe Audio SoCs Volume (K), by Types 2024 & 2032
- Figure 33: Europe Audio SoCs Revenue Share (%), by Types 2024 & 2032
- Figure 34: Europe Audio SoCs Volume Share (%), by Types 2024 & 2032
- Figure 35: Europe Audio SoCs Revenue (million), by Country 2024 & 2032
- Figure 36: Europe Audio SoCs Volume (K), by Country 2024 & 2032
- Figure 37: Europe Audio SoCs Revenue Share (%), by Country 2024 & 2032
- Figure 38: Europe Audio SoCs Volume Share (%), by Country 2024 & 2032
- Figure 39: Middle East & Africa Audio SoCs Revenue (million), by Application 2024 & 2032
- Figure 40: Middle East & Africa Audio SoCs Volume (K), by Application 2024 & 2032
- Figure 41: Middle East & Africa Audio SoCs Revenue Share (%), by Application 2024 & 2032
- Figure 42: Middle East & Africa Audio SoCs Volume Share (%), by Application 2024 & 2032
- Figure 43: Middle East & Africa Audio SoCs Revenue (million), by Types 2024 & 2032
- Figure 44: Middle East & Africa Audio SoCs Volume (K), by Types 2024 & 2032
- Figure 45: Middle East & Africa Audio SoCs Revenue Share (%), by Types 2024 & 2032
- Figure 46: Middle East & Africa Audio SoCs Volume Share (%), by Types 2024 & 2032
- Figure 47: Middle East & Africa Audio SoCs Revenue (million), by Country 2024 & 2032
- Figure 48: Middle East & Africa Audio SoCs Volume (K), by Country 2024 & 2032
- Figure 49: Middle East & Africa Audio SoCs Revenue Share (%), by Country 2024 & 2032
- Figure 50: Middle East & Africa Audio SoCs Volume Share (%), by Country 2024 & 2032
- Figure 51: Asia Pacific Audio SoCs Revenue (million), by Application 2024 & 2032
- Figure 52: Asia Pacific Audio SoCs Volume (K), by Application 2024 & 2032
- Figure 53: Asia Pacific Audio SoCs Revenue Share (%), by Application 2024 & 2032
- Figure 54: Asia Pacific Audio SoCs Volume Share (%), by Application 2024 & 2032
- Figure 55: Asia Pacific Audio SoCs Revenue (million), by Types 2024 & 2032
- Figure 56: Asia Pacific Audio SoCs Volume (K), by Types 2024 & 2032
- Figure 57: Asia Pacific Audio SoCs Revenue Share (%), by Types 2024 & 2032
- Figure 58: Asia Pacific Audio SoCs Volume Share (%), by Types 2024 & 2032
- Figure 59: Asia Pacific Audio SoCs Revenue (million), by Country 2024 & 2032
- Figure 60: Asia Pacific Audio SoCs Volume (K), by Country 2024 & 2032
- Figure 61: Asia Pacific Audio SoCs Revenue Share (%), by Country 2024 & 2032
- Figure 62: Asia Pacific Audio SoCs Volume Share (%), by Country 2024 & 2032
List of Tables
- Table 1: Global Audio SoCs Revenue million Forecast, by Region 2019 & 2032
- Table 2: Global Audio SoCs Volume K Forecast, by Region 2019 & 2032
- Table 3: Global Audio SoCs Revenue million Forecast, by Application 2019 & 2032
- Table 4: Global Audio SoCs Volume K Forecast, by Application 2019 & 2032
- Table 5: Global Audio SoCs Revenue million Forecast, by Types 2019 & 2032
- Table 6: Global Audio SoCs Volume K Forecast, by Types 2019 & 2032
- Table 7: Global Audio SoCs Revenue million Forecast, by Region 2019 & 2032
- Table 8: Global Audio SoCs Volume K Forecast, by Region 2019 & 2032
- Table 9: Global Audio SoCs Revenue million Forecast, by Application 2019 & 2032
- Table 10: Global Audio SoCs Volume K Forecast, by Application 2019 & 2032
- Table 11: Global Audio SoCs Revenue million Forecast, by Types 2019 & 2032
- Table 12: Global Audio SoCs Volume K Forecast, by Types 2019 & 2032
- Table 13: Global Audio SoCs Revenue million Forecast, by Country 2019 & 2032
- Table 14: Global Audio SoCs Volume K Forecast, by Country 2019 & 2032
- Table 15: United States Audio SoCs Revenue (million) Forecast, by Application 2019 & 2032
- Table 16: United States Audio SoCs Volume (K) Forecast, by Application 2019 & 2032
- Table 17: Canada Audio SoCs Revenue (million) Forecast, by Application 2019 & 2032
- Table 18: Canada Audio SoCs Volume (K) Forecast, by Application 2019 & 2032
- Table 19: Mexico Audio SoCs Revenue (million) Forecast, by Application 2019 & 2032
- Table 20: Mexico Audio SoCs Volume (K) Forecast, by Application 2019 & 2032
- Table 21: Global Audio SoCs Revenue million Forecast, by Application 2019 & 2032
- Table 22: Global Audio SoCs Volume K Forecast, by Application 2019 & 2032
- Table 23: Global Audio SoCs Revenue million Forecast, by Types 2019 & 2032
- Table 24: Global Audio SoCs Volume K Forecast, by Types 2019 & 2032
- Table 25: Global Audio SoCs Revenue million Forecast, by Country 2019 & 2032
- Table 26: Global Audio SoCs Volume K Forecast, by Country 2019 & 2032
- Table 27: Brazil Audio SoCs Revenue (million) Forecast, by Application 2019 & 2032
- Table 28: Brazil Audio SoCs Volume (K) Forecast, by Application 2019 & 2032
- Table 29: Argentina Audio SoCs Revenue (million) Forecast, by Application 2019 & 2032
- Table 30: Argentina Audio SoCs Volume (K) Forecast, by Application 2019 & 2032
- Table 31: Rest of South America Audio SoCs Revenue (million) Forecast, by Application 2019 & 2032
- Table 32: Rest of South America Audio SoCs Volume (K) Forecast, by Application 2019 & 2032
- Table 33: Global Audio SoCs Revenue million Forecast, by Application 2019 & 2032
- Table 34: Global Audio SoCs Volume K Forecast, by Application 2019 & 2032
- Table 35: Global Audio SoCs Revenue million Forecast, by Types 2019 & 2032
- Table 36: Global Audio SoCs Volume K Forecast, by Types 2019 & 2032
- Table 37: Global Audio SoCs Revenue million Forecast, by Country 2019 & 2032
- Table 38: Global Audio SoCs Volume K Forecast, by Country 2019 & 2032
- Table 39: United Kingdom Audio SoCs Revenue (million) Forecast, by Application 2019 & 2032
- Table 40: United Kingdom Audio SoCs Volume (K) Forecast, by Application 2019 & 2032
- Table 41: Germany Audio SoCs Revenue (million) Forecast, by Application 2019 & 2032
- Table 42: Germany Audio SoCs Volume (K) Forecast, by Application 2019 & 2032
- Table 43: France Audio SoCs Revenue (million) Forecast, by Application 2019 & 2032
- Table 44: France Audio SoCs Volume (K) Forecast, by Application 2019 & 2032
- Table 45: Italy Audio SoCs Revenue (million) Forecast, by Application 2019 & 2032
- Table 46: Italy Audio SoCs Volume (K) Forecast, by Application 2019 & 2032
- Table 47: Spain Audio SoCs Revenue (million) Forecast, by Application 2019 & 2032
- Table 48: Spain Audio SoCs Volume (K) Forecast, by Application 2019 & 2032
- Table 49: Russia Audio SoCs Revenue (million) Forecast, by Application 2019 & 2032
- Table 50: Russia Audio SoCs Volume (K) Forecast, by Application 2019 & 2032
- Table 51: Benelux Audio SoCs Revenue (million) Forecast, by Application 2019 & 2032
- Table 52: Benelux Audio SoCs Volume (K) Forecast, by Application 2019 & 2032
- Table 53: Nordics Audio SoCs Revenue (million) Forecast, by Application 2019 & 2032
- Table 54: Nordics Audio SoCs Volume (K) Forecast, by Application 2019 & 2032
- Table 55: Rest of Europe Audio SoCs Revenue (million) Forecast, by Application 2019 & 2032
- Table 56: Rest of Europe Audio SoCs Volume (K) Forecast, by Application 2019 & 2032
- Table 57: Global Audio SoCs Revenue million Forecast, by Application 2019 & 2032
- Table 58: Global Audio SoCs Volume K Forecast, by Application 2019 & 2032
- Table 59: Global Audio SoCs Revenue million Forecast, by Types 2019 & 2032
- Table 60: Global Audio SoCs Volume K Forecast, by Types 2019 & 2032
- Table 61: Global Audio SoCs Revenue million Forecast, by Country 2019 & 2032
- Table 62: Global Audio SoCs Volume K Forecast, by Country 2019 & 2032
- Table 63: Turkey Audio SoCs Revenue (million) Forecast, by Application 2019 & 2032
- Table 64: Turkey Audio SoCs Volume (K) Forecast, by Application 2019 & 2032
- Table 65: Israel Audio SoCs Revenue (million) Forecast, by Application 2019 & 2032
- Table 66: Israel Audio SoCs Volume (K) Forecast, by Application 2019 & 2032
- Table 67: GCC Audio SoCs Revenue (million) Forecast, by Application 2019 & 2032
- Table 68: GCC Audio SoCs Volume (K) Forecast, by Application 2019 & 2032
- Table 69: North Africa Audio SoCs Revenue (million) Forecast, by Application 2019 & 2032
- Table 70: North Africa Audio SoCs Volume (K) Forecast, by Application 2019 & 2032
- Table 71: South Africa Audio SoCs Revenue (million) Forecast, by Application 2019 & 2032
- Table 72: South Africa Audio SoCs Volume (K) Forecast, by Application 2019 & 2032
- Table 73: Rest of Middle East & Africa Audio SoCs Revenue (million) Forecast, by Application 2019 & 2032
- Table 74: Rest of Middle East & Africa Audio SoCs Volume (K) Forecast, by Application 2019 & 2032
- Table 75: Global Audio SoCs Revenue million Forecast, by Application 2019 & 2032
- Table 76: Global Audio SoCs Volume K Forecast, by Application 2019 & 2032
- Table 77: Global Audio SoCs Revenue million Forecast, by Types 2019 & 2032
- Table 78: Global Audio SoCs Volume K Forecast, by Types 2019 & 2032
- Table 79: Global Audio SoCs Revenue million Forecast, by Country 2019 & 2032
- Table 80: Global Audio SoCs Volume K Forecast, by Country 2019 & 2032
- Table 81: China Audio SoCs Revenue (million) Forecast, by Application 2019 & 2032
- Table 82: China Audio SoCs Volume (K) Forecast, by Application 2019 & 2032
- Table 83: India Audio SoCs Revenue (million) Forecast, by Application 2019 & 2032
- Table 84: India Audio SoCs Volume (K) Forecast, by Application 2019 & 2032
- Table 85: Japan Audio SoCs Revenue (million) Forecast, by Application 2019 & 2032
- Table 86: Japan Audio SoCs Volume (K) Forecast, by Application 2019 & 2032
- Table 87: South Korea Audio SoCs Revenue (million) Forecast, by Application 2019 & 2032
- Table 88: South Korea Audio SoCs Volume (K) Forecast, by Application 2019 & 2032
- Table 89: ASEAN Audio SoCs Revenue (million) Forecast, by Application 2019 & 2032
- Table 90: ASEAN Audio SoCs Volume (K) Forecast, by Application 2019 & 2032
- Table 91: Oceania Audio SoCs Revenue (million) Forecast, by Application 2019 & 2032
- Table 92: Oceania Audio SoCs Volume (K) Forecast, by Application 2019 & 2032
- Table 93: Rest of Asia Pacific Audio SoCs Revenue (million) Forecast, by Application 2019 & 2032
- Table 94: Rest of Asia Pacific Audio SoCs Volume (K) Forecast, by Application 2019 & 2032
Frequently Asked Questions
1. What is the projected Compound Annual Growth Rate (CAGR) of the Audio SoCs?
The projected CAGR is approximately XX%.
2. Which companies are prominent players in the Audio SoCs?
Key companies in the market include Cirrus Logic, NXP Semiconductors, Texas Instruments, Analog Devices, Qualcomm, Realtek Semiconductor, Conexant Systems, Maxim Integrated, STMicroelectronics, Asahi Kasei Microdevices (AKM), Silicon Labs.
3. What are the main segments of the Audio SoCs?
The market segments include Application, Types.
4. Can you provide details about the market size?
The market size is estimated to be USD XXX million as of 2022.
5. What are some drivers contributing to market growth?
N/A
6. What are the notable trends driving market growth?
N/A
7. Are there any restraints impacting market growth?
N/A
8. Can you provide examples of recent developments in the market?
N/A
9. What pricing options are available for accessing the report?
Pricing options include single-user, multi-user, and enterprise licenses priced at USD 3350.00, USD 5025.00, and USD 6700.00 respectively.
10. Is the market size provided in terms of value or volume?
The market size is provided in terms of value, measured in million and volume, measured in K.
11. Are there any specific market keywords associated with the report?
Yes, the market keyword associated with the report is "Audio SoCs," which aids in identifying and referencing the specific market segment covered.
12. How do I determine which pricing option suits my needs best?
The pricing options vary based on user requirements and access needs. Individual users may opt for single-user licenses, while businesses requiring broader access may choose multi-user or enterprise licenses for cost-effective access to the report.
13. Are there any additional resources or data provided in the Audio SoCs report?
While the report offers comprehensive insights, it's advisable to review the specific contents or supplementary materials provided to ascertain if additional resources or data are available.
14. How can I stay updated on further developments or reports in the Audio SoCs?
To stay informed about further developments, trends, and reports in the Audio SoCs, consider subscribing to industry newsletters, following relevant companies and organizations, or regularly checking reputable industry news sources and publications.
Methodology
Step 1 - Identification of Relevant Samples Size from Population Database


Step 2 - Approaches for Defining Global Market Size (Value, Volume* & Price*)

Note*: In applicable scenarios
Step 3 - Data Sources
Primary Research
- Web Analytics
- Survey Reports
- Research Institute
- Latest Research Reports
- Opinion Leaders
Secondary Research
- Annual Reports
- White Paper
- Latest Press Release
- Industry Association
- Paid Database
- Investor Presentations

Step 4 - Data Triangulation
Involves using different sources of information in order to increase the validity of a study
These sources are likely to be stakeholders in a program - participants, other researchers, program staff, other community members, and so on.
Then we put all data in single framework & apply various statistical tools to find out the dynamic on the market.
During the analysis stage, feedback from the stakeholder groups would be compared to determine areas of agreement as well as areas of divergence


