
Key Insights
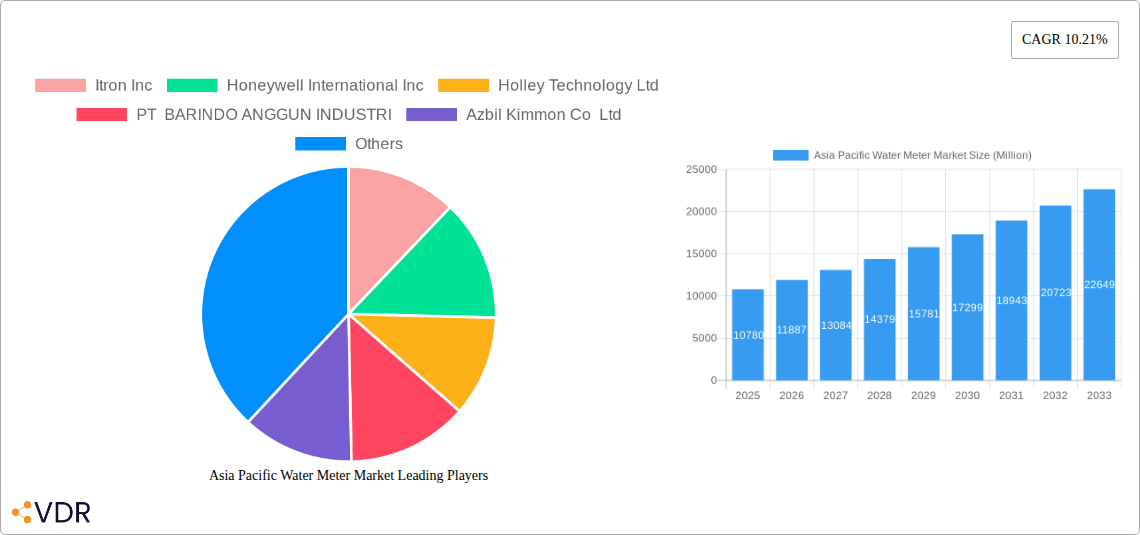
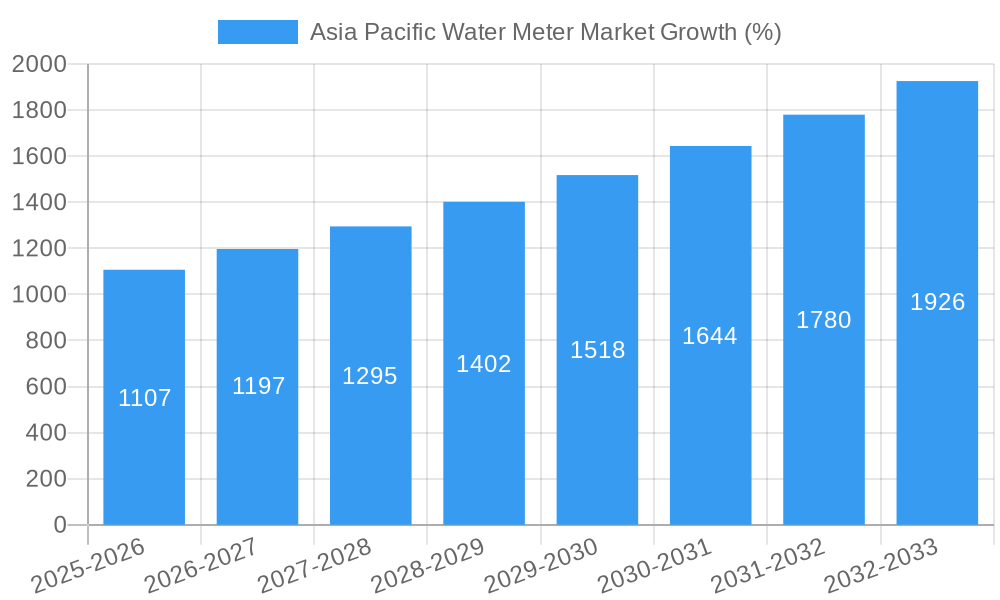
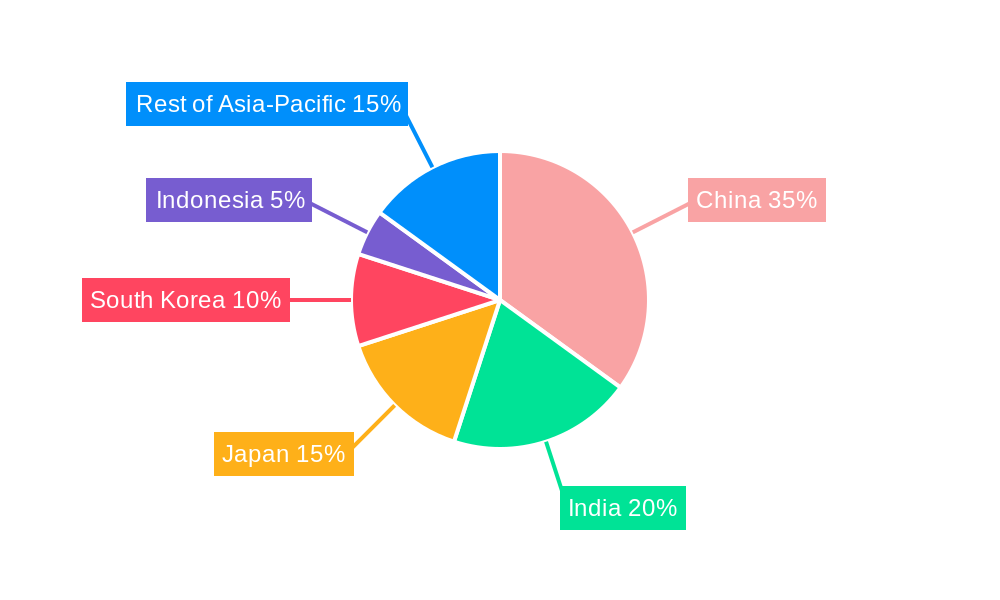
The Asia-Pacific water meter market, valued at $10.78 billion in 2025, is projected to experience robust growth, driven by increasing urbanization, stringent water management regulations, and the rising adoption of smart water metering technologies. The market's Compound Annual Growth Rate (CAGR) of 10.21% from 2025 to 2033 indicates significant expansion opportunities. Key drivers include the need for efficient water resource management, reducing water loss through leak detection, and improving billing accuracy. The burgeoning demand for smart meters, offering real-time data and advanced analytics capabilities, is a primary growth catalyst. While the market faces challenges like high initial investment costs for smart meter infrastructure and varying levels of technological adoption across different regions, the long-term benefits of improved water resource management and reduced operational expenses are expected to outweigh these restraints. China, India, and Japan are leading the market, followed by South Korea and Indonesia, reflecting their substantial populations and significant investments in water infrastructure development. The segmentation by application highlights the crucial role of water meters in industrial settings and water utility services, while the "basic meter" and "smart meter" classification underscores the market's technological evolution and the growing preference for advanced metering solutions.
The market's growth trajectory is influenced by government initiatives promoting water conservation and smart city projects across the Asia-Pacific region. Technological advancements in sensor technology, data analytics, and communication networks further enhance the capabilities of smart water meters, fueling market expansion. Competition among established players like Itron Inc., Honeywell International Inc., and Holley Technology Ltd., alongside regional players, contributes to innovation and price competitiveness. The forecast period of 2025-2033 promises substantial growth, with significant opportunities for businesses providing smart water metering solutions and related services, particularly in regions with developing water infrastructure and a growing emphasis on sustainable water management practices. Further market expansion will likely depend on the rate of smart meter adoption, the successful implementation of water conservation policies, and continued investment in upgrading water infrastructure.
Asia Pacific Water Meter Market Report: 2019-2033
This comprehensive report provides an in-depth analysis of the Asia Pacific water meter market, encompassing market dynamics, growth trends, regional dominance, product landscapes, key players, and future outlook. The study period covers 2019-2033, with 2025 as the base and estimated year. This report is crucial for industry professionals, investors, and policymakers seeking to understand and capitalize on the opportunities within this rapidly evolving sector. The market is segmented by country (China, India, Japan, South Korea, Indonesia, Rest of Asia-Pacific), type (Basic Meters, Smart Meters), and application (Industrial, Water Utilities). The market size is presented in Million units.
Asia Pacific Water Meter Market Dynamics & Structure
The Asia Pacific water meter market is characterized by a moderately concentrated landscape, with key players like Itron Inc, Honeywell International Inc, and Holley Technology Ltd holding significant market share. Technological innovation, particularly in smart metering, is a primary driver. Stringent government regulations promoting water conservation and efficient management further propel market growth. However, high initial investment costs for smart meter installations and the existence of substitute technologies present challenges. The market is witnessing increased M&A activity, with xx deals recorded in the last five years, aiming to expand market reach and enhance technological capabilities.
- Market Concentration: Moderately concentrated, with top 5 players holding xx% market share in 2024.
- Technological Innovation: Smart meter adoption is accelerating, driven by advancements in IoT, communication technologies, and data analytics.
- Regulatory Framework: Governments across the region are implementing policies to improve water management and reduce water loss, mandating smart meter installations in several regions.
- Competitive Substitutes: Traditional mechanical meters still hold a significant share, posing competition to smart meters.
- End-User Demographics: Growth is driven by increasing urbanization, rising water scarcity, and growing awareness of water conservation.
- M&A Trends: Consolidation is expected to continue, with larger players acquiring smaller companies to expand product portfolios and geographical reach.
Asia Pacific Water Meter Market Growth Trends & Insights
The Asia Pacific water meter market experienced robust growth during the historical period (2019-2024), with a CAGR of xx%. This growth is primarily attributed to the increasing adoption of smart water meters, driven by factors such as improved water management, reduced non-revenue water, and the ability to collect real-time consumption data. The market is expected to maintain a healthy growth trajectory during the forecast period (2025-2033), with a projected CAGR of xx%, fueled by government initiatives promoting water infrastructure development and the increasing demand for efficient water resource management across various applications. Technological disruptions, such as the emergence of advanced sensor technologies and AI-powered analytics, are further accelerating market expansion. Shifting consumer behavior towards water conservation is also a significant driver of growth. Market penetration of smart meters is projected to increase from xx% in 2024 to xx% by 2033.
Dominant Regions, Countries, or Segments in Asia Pacific Water Meter Market
China and India are the dominant markets in the Asia Pacific region, accounting for xx% and xx% of the total market share in 2024, respectively. This dominance is driven by their large populations, rapid urbanization, and significant investments in water infrastructure development. The smart meter segment is experiencing the fastest growth, driven by technological advancements and government initiatives. The water utilities sector accounts for the largest application segment, driven by the need for efficient water management in urban areas.
- Key Drivers in China: Large-scale infrastructure projects, government support for smart city initiatives, and increasing water scarcity.
- Key Drivers in India: Growing awareness of water conservation, rising urbanization, and government programs promoting smart water metering.
- Smart Meter Segment: Fastest-growing segment due to technological advancements and benefits such as reduced water loss and improved billing accuracy.
- Water Utilities Sector: Largest application segment due to the need for efficient water management and improved revenue collection.
Asia Pacific Water Meter Market Product Landscape
The Asia Pacific water meter market offers a diverse range of products, from basic mechanical meters to advanced smart meters equipped with remote monitoring and data analytics capabilities. Smart meters are characterized by features such as wireless communication, advanced sensors, and data encryption. Key selling propositions include improved accuracy, reduced water loss, real-time monitoring, and efficient billing systems. Recent technological advancements include the integration of LoRaWAN technology for long-range communication and the use of AI-powered analytics for predictive maintenance and leak detection.
Key Drivers, Barriers & Challenges in Asia Pacific Water Meter Market
Key Drivers: Growing urbanization, increasing water scarcity, government regulations promoting water conservation, technological advancements in smart metering, and rising investments in water infrastructure development. For instance, the recent initiative in Aurangabad, Maharashtra to install 2.8 lakh smart water meters highlights the growing demand.
Key Challenges: High initial investment costs associated with smart meter installation, lack of awareness about the benefits of smart metering in some regions, integration challenges with existing water infrastructure, and cybersecurity concerns related to data security. The market also faces supply chain disruptions, potentially impacting product availability and pricing.
Emerging Opportunities in Asia Pacific Water Meter Market
Untapped markets in rural areas present significant growth opportunities. The adoption of advanced analytics for predictive maintenance and leak detection offers lucrative opportunities for providers of smart water management solutions. The increasing demand for water conservation technologies and the growing focus on sustainable water management will drive demand for energy-efficient water meters. New business models like water-as-a-service are emerging.
Growth Accelerators in the Asia Pacific Water Meter Market Industry
Technological breakthroughs in sensor technologies, communication protocols, and data analytics are accelerating market growth. Strategic partnerships between meter manufacturers and water utility companies facilitate wider adoption. Expansion into untapped markets, particularly in rural areas, and government incentives promoting smart water metering are crucial growth catalysts.
Key Players Shaping the Asia Pacific Water Meter Market Market
- Itron Inc
- Honeywell International Inc
- Holley Technology Ltd
- PT BARINDO ANGGUN INDUSTRI
- Azbil Kimmon Co Ltd
- Arad Group
- Diehl Stiftung & Co KG
- ASMA Industrial Corporation
- Adept Fluidyne Pvt Ltd
- UPC Instruments Pvt Ltd
- Aichi Tokei Denki Co Ltd
Notable Milestones in Asia Pacific Water Meter Market Sector
- November 2022: The Union Housing and Urban Affairs Ministry's proposal to install 2.8 lakh smart water meters in Aurangabad, Maharashtra, signifies a major step towards smart water management in India.
- May 2022: Semtech Corporation's collaboration with Cranberry Analytics for LoRaWAN-integrated smart water meters showcases the integration of advanced technologies in the Indian market. Panaji Municipal Corporation's adoption further validates the technology's market acceptance.
- March 2022: The deployment of 711,000 smart water meters in Lahore, Pakistan, under a public-private partnership highlights the increasing adoption of smart metering solutions in the region.
In-Depth Asia Pacific Water Meter Market Market Outlook
The Asia Pacific water meter market is poised for substantial growth, driven by increasing urbanization, water scarcity, and government initiatives. The continued adoption of smart metering technologies, coupled with advancements in data analytics and IoT, will unlock significant opportunities for market players. Strategic partnerships and investments in research and development will play a crucial role in shaping the future of this dynamic market. The focus on sustainable water management and the integration of AI-powered solutions will further enhance the market's potential.
Asia Pacific Water Meter Market Segmentation
-
1. Type
- 1.1. Basic Meters
- 1.2. Smart Meters
-
2. Application
- 2.1. Industrial
- 2.2. Water Utilities
Asia Pacific Water Meter Market Segmentation By Geography
-
1. Asia Pacific
- 1.1. China
- 1.2. Japan
- 1.3. South Korea
- 1.4. India
- 1.5. Australia
- 1.6. New Zealand
- 1.7. Indonesia
- 1.8. Malaysia
- 1.9. Singapore
- 1.10. Thailand
- 1.11. Vietnam
- 1.12. Philippines
Asia Pacific Water Meter Market REPORT HIGHLIGHTS
| Aspects | Details |
|---|---|
| Study Period | 2019-2033 |
| Base Year | 2024 |
| Estimated Year | 2025 |
| Forecast Period | 2025-2033 |
| Historical Period | 2019-2024 |
| Growth Rate | CAGR of 10.21% from 2019-2033 |
| Segmentation |
|
Table of Contents
- 1. Introduction
- 1.1. Research Scope
- 1.2. Market Segmentation
- 1.3. Research Methodology
- 1.4. Definitions and Assumptions
- 2. Executive Summary
- 2.1. Introduction
- 3. Market Dynamics
- 3.1. Introduction
- 3.2. Market Drivers
- 3.2.1. Need for Improvement in Utility Usage and Efficiency; Growing Awareness on the Wastage of Water and Supportive Regulations
- 3.3. Market Restrains
- 3.3.1. Reluctance/Lack of Awareness to Use Self-Checkout Systems
- 3.4. Market Trends
- 3.4.1. Installation of Smart Meters to Grow Significantly
- 4. Market Factor Analysis
- 4.1. Porters Five Forces
- 4.2. Supply/Value Chain
- 4.3. PESTEL analysis
- 4.4. Market Entropy
- 4.5. Patent/Trademark Analysis
- 5. Asia Pacific Water Meter Market Analysis, Insights and Forecast, 2019-2031
- 5.1. Market Analysis, Insights and Forecast - by Type
- 5.1.1. Basic Meters
- 5.1.2. Smart Meters
- 5.2. Market Analysis, Insights and Forecast - by Application
- 5.2.1. Industrial
- 5.2.2. Water Utilities
- 5.3. Market Analysis, Insights and Forecast - by Region
- 5.3.1. Asia Pacific
- 5.1. Market Analysis, Insights and Forecast - by Type
- 6. China Asia Pacific Water Meter Market Analysis, Insights and Forecast, 2019-2031
- 7. Japan Asia Pacific Water Meter Market Analysis, Insights and Forecast, 2019-2031
- 8. India Asia Pacific Water Meter Market Analysis, Insights and Forecast, 2019-2031
- 9. South Korea Asia Pacific Water Meter Market Analysis, Insights and Forecast, 2019-2031
- 10. Taiwan Asia Pacific Water Meter Market Analysis, Insights and Forecast, 2019-2031
- 11. Australia Asia Pacific Water Meter Market Analysis, Insights and Forecast, 2019-2031
- 12. Rest of Asia-Pacific Asia Pacific Water Meter Market Analysis, Insights and Forecast, 2019-2031
- 13. Competitive Analysis
- 13.1. Market Share Analysis 2024
- 13.2. Company Profiles
- 13.2.1 Itron Inc
- 13.2.1.1. Overview
- 13.2.1.2. Products
- 13.2.1.3. SWOT Analysis
- 13.2.1.4. Recent Developments
- 13.2.1.5. Financials (Based on Availability)
- 13.2.2 Honeywell International Inc
- 13.2.2.1. Overview
- 13.2.2.2. Products
- 13.2.2.3. SWOT Analysis
- 13.2.2.4. Recent Developments
- 13.2.2.5. Financials (Based on Availability)
- 13.2.3 Holley Technology Ltd
- 13.2.3.1. Overview
- 13.2.3.2. Products
- 13.2.3.3. SWOT Analysis
- 13.2.3.4. Recent Developments
- 13.2.3.5. Financials (Based on Availability)
- 13.2.4 PT BARINDO ANGGUN INDUSTRI
- 13.2.4.1. Overview
- 13.2.4.2. Products
- 13.2.4.3. SWOT Analysis
- 13.2.4.4. Recent Developments
- 13.2.4.5. Financials (Based on Availability)
- 13.2.5 Azbil Kimmon Co Ltd
- 13.2.5.1. Overview
- 13.2.5.2. Products
- 13.2.5.3. SWOT Analysis
- 13.2.5.4. Recent Developments
- 13.2.5.5. Financials (Based on Availability)
- 13.2.6 Arad Group
- 13.2.6.1. Overview
- 13.2.6.2. Products
- 13.2.6.3. SWOT Analysis
- 13.2.6.4. Recent Developments
- 13.2.6.5. Financials (Based on Availability)
- 13.2.7 Diehl Stiftung & Co KG
- 13.2.7.1. Overview
- 13.2.7.2. Products
- 13.2.7.3. SWOT Analysis
- 13.2.7.4. Recent Developments
- 13.2.7.5. Financials (Based on Availability)
- 13.2.8 ASMA Industrial Corporation
- 13.2.8.1. Overview
- 13.2.8.2. Products
- 13.2.8.3. SWOT Analysis
- 13.2.8.4. Recent Developments
- 13.2.8.5. Financials (Based on Availability)
- 13.2.9 Adept Fluidyne Pvt Ltd
- 13.2.9.1. Overview
- 13.2.9.2. Products
- 13.2.9.3. SWOT Analysis
- 13.2.9.4. Recent Developments
- 13.2.9.5. Financials (Based on Availability)
- 13.2.10 UPC Instruments Pvt Ltd
- 13.2.10.1. Overview
- 13.2.10.2. Products
- 13.2.10.3. SWOT Analysis
- 13.2.10.4. Recent Developments
- 13.2.10.5. Financials (Based on Availability)
- 13.2.11 Aichi Tokei Denki Co Ltd
- 13.2.11.1. Overview
- 13.2.11.2. Products
- 13.2.11.3. SWOT Analysis
- 13.2.11.4. Recent Developments
- 13.2.11.5. Financials (Based on Availability)
- 13.2.1 Itron Inc
List of Figures
- Figure 1: Asia Pacific Water Meter Market Revenue Breakdown (Million, %) by Product 2024 & 2032
- Figure 2: Asia Pacific Water Meter Market Share (%) by Company 2024
List of Tables
- Table 1: Asia Pacific Water Meter Market Revenue Million Forecast, by Region 2019 & 2032
- Table 2: Asia Pacific Water Meter Market Volume K Unit Forecast, by Region 2019 & 2032
- Table 3: Asia Pacific Water Meter Market Revenue Million Forecast, by Type 2019 & 2032
- Table 4: Asia Pacific Water Meter Market Volume K Unit Forecast, by Type 2019 & 2032
- Table 5: Asia Pacific Water Meter Market Revenue Million Forecast, by Application 2019 & 2032
- Table 6: Asia Pacific Water Meter Market Volume K Unit Forecast, by Application 2019 & 2032
- Table 7: Asia Pacific Water Meter Market Revenue Million Forecast, by Region 2019 & 2032
- Table 8: Asia Pacific Water Meter Market Volume K Unit Forecast, by Region 2019 & 2032
- Table 9: Asia Pacific Water Meter Market Revenue Million Forecast, by Country 2019 & 2032
- Table 10: Asia Pacific Water Meter Market Volume K Unit Forecast, by Country 2019 & 2032
- Table 11: China Asia Pacific Water Meter Market Revenue (Million) Forecast, by Application 2019 & 2032
- Table 12: China Asia Pacific Water Meter Market Volume (K Unit) Forecast, by Application 2019 & 2032
- Table 13: Japan Asia Pacific Water Meter Market Revenue (Million) Forecast, by Application 2019 & 2032
- Table 14: Japan Asia Pacific Water Meter Market Volume (K Unit) Forecast, by Application 2019 & 2032
- Table 15: India Asia Pacific Water Meter Market Revenue (Million) Forecast, by Application 2019 & 2032
- Table 16: India Asia Pacific Water Meter Market Volume (K Unit) Forecast, by Application 2019 & 2032
- Table 17: South Korea Asia Pacific Water Meter Market Revenue (Million) Forecast, by Application 2019 & 2032
- Table 18: South Korea Asia Pacific Water Meter Market Volume (K Unit) Forecast, by Application 2019 & 2032
- Table 19: Taiwan Asia Pacific Water Meter Market Revenue (Million) Forecast, by Application 2019 & 2032
- Table 20: Taiwan Asia Pacific Water Meter Market Volume (K Unit) Forecast, by Application 2019 & 2032
- Table 21: Australia Asia Pacific Water Meter Market Revenue (Million) Forecast, by Application 2019 & 2032
- Table 22: Australia Asia Pacific Water Meter Market Volume (K Unit) Forecast, by Application 2019 & 2032
- Table 23: Rest of Asia-Pacific Asia Pacific Water Meter Market Revenue (Million) Forecast, by Application 2019 & 2032
- Table 24: Rest of Asia-Pacific Asia Pacific Water Meter Market Volume (K Unit) Forecast, by Application 2019 & 2032
- Table 25: Asia Pacific Water Meter Market Revenue Million Forecast, by Type 2019 & 2032
- Table 26: Asia Pacific Water Meter Market Volume K Unit Forecast, by Type 2019 & 2032
- Table 27: Asia Pacific Water Meter Market Revenue Million Forecast, by Application 2019 & 2032
- Table 28: Asia Pacific Water Meter Market Volume K Unit Forecast, by Application 2019 & 2032
- Table 29: Asia Pacific Water Meter Market Revenue Million Forecast, by Country 2019 & 2032
- Table 30: Asia Pacific Water Meter Market Volume K Unit Forecast, by Country 2019 & 2032
- Table 31: China Asia Pacific Water Meter Market Revenue (Million) Forecast, by Application 2019 & 2032
- Table 32: China Asia Pacific Water Meter Market Volume (K Unit) Forecast, by Application 2019 & 2032
- Table 33: Japan Asia Pacific Water Meter Market Revenue (Million) Forecast, by Application 2019 & 2032
- Table 34: Japan Asia Pacific Water Meter Market Volume (K Unit) Forecast, by Application 2019 & 2032
- Table 35: South Korea Asia Pacific Water Meter Market Revenue (Million) Forecast, by Application 2019 & 2032
- Table 36: South Korea Asia Pacific Water Meter Market Volume (K Unit) Forecast, by Application 2019 & 2032
- Table 37: India Asia Pacific Water Meter Market Revenue (Million) Forecast, by Application 2019 & 2032
- Table 38: India Asia Pacific Water Meter Market Volume (K Unit) Forecast, by Application 2019 & 2032
- Table 39: Australia Asia Pacific Water Meter Market Revenue (Million) Forecast, by Application 2019 & 2032
- Table 40: Australia Asia Pacific Water Meter Market Volume (K Unit) Forecast, by Application 2019 & 2032
- Table 41: New Zealand Asia Pacific Water Meter Market Revenue (Million) Forecast, by Application 2019 & 2032
- Table 42: New Zealand Asia Pacific Water Meter Market Volume (K Unit) Forecast, by Application 2019 & 2032
- Table 43: Indonesia Asia Pacific Water Meter Market Revenue (Million) Forecast, by Application 2019 & 2032
- Table 44: Indonesia Asia Pacific Water Meter Market Volume (K Unit) Forecast, by Application 2019 & 2032
- Table 45: Malaysia Asia Pacific Water Meter Market Revenue (Million) Forecast, by Application 2019 & 2032
- Table 46: Malaysia Asia Pacific Water Meter Market Volume (K Unit) Forecast, by Application 2019 & 2032
- Table 47: Singapore Asia Pacific Water Meter Market Revenue (Million) Forecast, by Application 2019 & 2032
- Table 48: Singapore Asia Pacific Water Meter Market Volume (K Unit) Forecast, by Application 2019 & 2032
- Table 49: Thailand Asia Pacific Water Meter Market Revenue (Million) Forecast, by Application 2019 & 2032
- Table 50: Thailand Asia Pacific Water Meter Market Volume (K Unit) Forecast, by Application 2019 & 2032
- Table 51: Vietnam Asia Pacific Water Meter Market Revenue (Million) Forecast, by Application 2019 & 2032
- Table 52: Vietnam Asia Pacific Water Meter Market Volume (K Unit) Forecast, by Application 2019 & 2032
- Table 53: Philippines Asia Pacific Water Meter Market Revenue (Million) Forecast, by Application 2019 & 2032
- Table 54: Philippines Asia Pacific Water Meter Market Volume (K Unit) Forecast, by Application 2019 & 2032
Frequently Asked Questions
1. What is the projected Compound Annual Growth Rate (CAGR) of the Asia Pacific Water Meter Market?
The projected CAGR is approximately 10.21%.
2. Which companies are prominent players in the Asia Pacific Water Meter Market?
Key companies in the market include Itron Inc, Honeywell International Inc, Holley Technology Ltd , PT BARINDO ANGGUN INDUSTRI, Azbil Kimmon Co Ltd, Arad Group, Diehl Stiftung & Co KG, ASMA Industrial Corporation, Adept Fluidyne Pvt Ltd, UPC Instruments Pvt Ltd, Aichi Tokei Denki Co Ltd.
3. What are the main segments of the Asia Pacific Water Meter Market?
The market segments include Type, Application.
4. Can you provide details about the market size?
The market size is estimated to be USD 10.78 Million as of 2022.
5. What are some drivers contributing to market growth?
Need for Improvement in Utility Usage and Efficiency; Growing Awareness on the Wastage of Water and Supportive Regulations.
6. What are the notable trends driving market growth?
Installation of Smart Meters to Grow Significantly.
7. Are there any restraints impacting market growth?
Reluctance/Lack of Awareness to Use Self-Checkout Systems.
8. Can you provide examples of recent developments in the market?
November 2022: A Union Housing and Urban Affairs Ministry team has suggested installing smart water meters as part of the under-construction water pipeline scheme in Maharashtra's Aurangabad city. The plan aims to install 2.8 lakh meters and provide 24-hour water to the city till 2052.
9. What pricing options are available for accessing the report?
Pricing options include single-user, multi-user, and enterprise licenses priced at USD 3800, USD 4500, and USD 5800 respectively.
10. Is the market size provided in terms of value or volume?
The market size is provided in terms of value, measured in Million and volume, measured in K Unit.
11. Are there any specific market keywords associated with the report?
Yes, the market keyword associated with the report is "Asia Pacific Water Meter Market," which aids in identifying and referencing the specific market segment covered.
12. How do I determine which pricing option suits my needs best?
The pricing options vary based on user requirements and access needs. Individual users may opt for single-user licenses, while businesses requiring broader access may choose multi-user or enterprise licenses for cost-effective access to the report.
13. Are there any additional resources or data provided in the Asia Pacific Water Meter Market report?
While the report offers comprehensive insights, it's advisable to review the specific contents or supplementary materials provided to ascertain if additional resources or data are available.
14. How can I stay updated on further developments or reports in the Asia Pacific Water Meter Market?
To stay informed about further developments, trends, and reports in the Asia Pacific Water Meter Market, consider subscribing to industry newsletters, following relevant companies and organizations, or regularly checking reputable industry news sources and publications.
Methodology
Step 1 - Identification of Relevant Samples Size from Population Database


Step 2 - Approaches for Defining Global Market Size (Value, Volume* & Price*)

Note*: In applicable scenarios
Step 3 - Data Sources
Primary Research
- Web Analytics
- Survey Reports
- Research Institute
- Latest Research Reports
- Opinion Leaders
Secondary Research
- Annual Reports
- White Paper
- Latest Press Release
- Industry Association
- Paid Database
- Investor Presentations

Step 4 - Data Triangulation
Involves using different sources of information in order to increase the validity of a study
These sources are likely to be stakeholders in a program - participants, other researchers, program staff, other community members, and so on.
Then we put all data in single framework & apply various statistical tools to find out the dynamic on the market.
During the analysis stage, feedback from the stakeholder groups would be compared to determine areas of agreement as well as areas of divergence


