
Key Insights
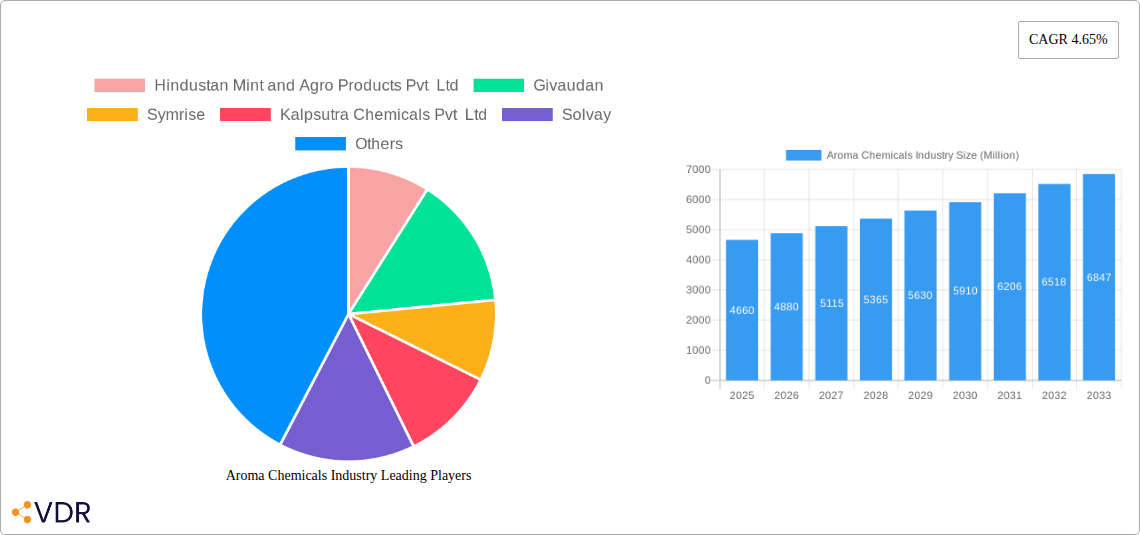
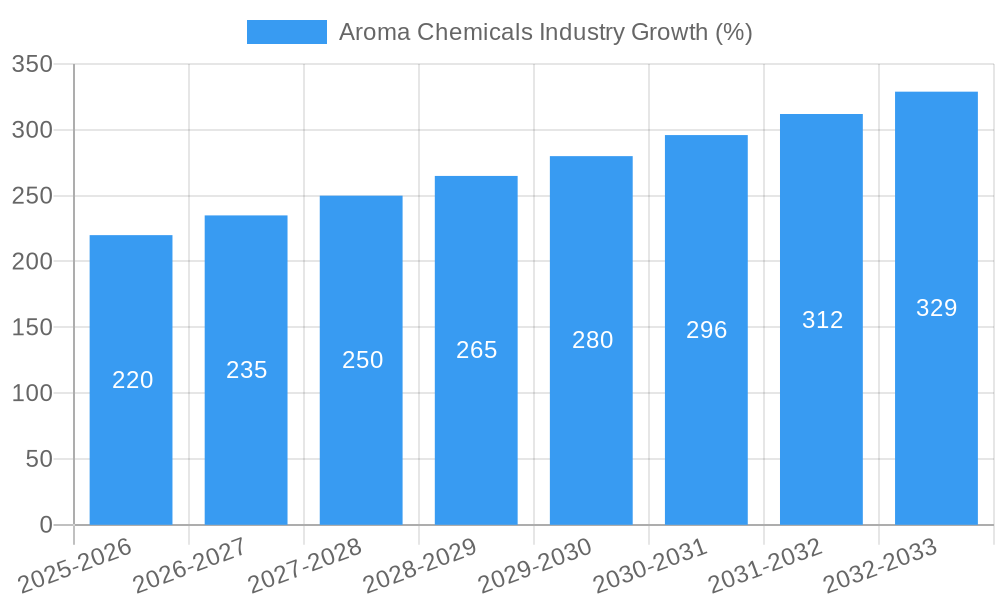
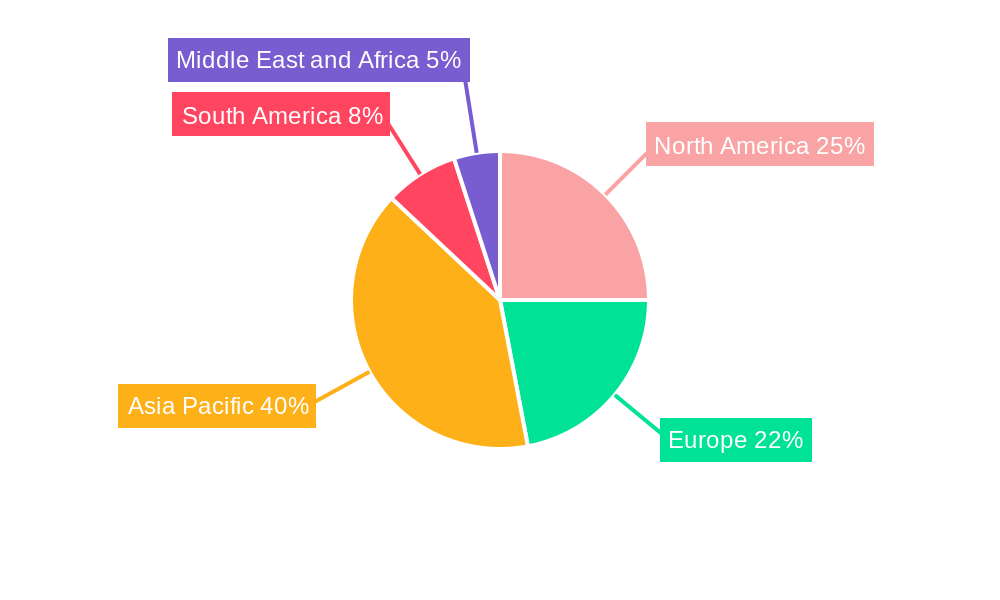
The aroma chemicals market, valued at $4.66 billion in 2025, is projected to experience robust growth, driven by increasing demand from the cosmetics and personal care, food and beverage, and household product sectors. The market's Compound Annual Growth Rate (CAGR) of 4.65% from 2025 to 2033 indicates a significant expansion over the forecast period. Key drivers include the rising consumer preference for natural and sustainable products, leading to increased demand for naturally-derived aroma chemicals. Furthermore, the growing popularity of aromatherapy and its therapeutic benefits is fueling market growth. The diverse applications of aroma chemicals across various industries contribute significantly to this upward trajectory. Specific segments like terpenes and benzenoids are expected to witness substantial growth due to their wide applications and relative cost-effectiveness. However, stringent regulations concerning the use of certain chemicals in consumer products and the potential volatility in raw material prices pose challenges to market expansion. Competitive landscape analysis reveals the presence of both large multinational corporations and smaller specialized players, indicating a dynamic market with opportunities for both established and emerging companies. Geographical analysis indicates that the Asia-Pacific region, particularly China and India, is expected to be a key growth driver owing to rapid economic development and rising disposable incomes.
The market segmentation reveals a significant contribution from the cosmetics and toiletries segment, driven by consumer preference for aesthetically pleasing and fragrant products. The food and beverage industry's utilization of aroma chemicals to enhance product flavor and appeal also represents a substantial market segment. While the soap and detergent sector contributes significantly, the market is also seeing growth in niche applications such as fine fragrances and household products. Technological advancements in aroma chemical synthesis and extraction techniques are likely to contribute to further market growth. However, future growth may be impacted by fluctuations in the global economy and potential supply chain disruptions. Companies are focusing on innovation and sustainability to maintain a competitive edge. This includes developing new and improved aroma chemicals that meet stringent regulatory requirements and consumer demand for eco-friendly alternatives.
Aroma Chemicals Industry Market Report: 2019-2033
This comprehensive report provides a detailed analysis of the Aroma Chemicals industry, encompassing market dynamics, growth trends, dominant segments, and key players. With a study period spanning 2019-2033, a base year of 2025, and a forecast period of 2025-2033, this report offers invaluable insights for industry professionals, investors, and strategic decision-makers. The report analyzes parent markets (Fragrances & Flavors) and child markets (Cosmetics, Food & Beverage, etc.) to offer a holistic view. Market values are presented in million units.
Aroma Chemicals Industry Market Dynamics & Structure
The Aroma Chemicals market is characterized by a moderately concentrated structure with a few major players holding significant market share. Technological innovation, particularly in natural and sustainable aroma chemical production, is a key driver. Stringent regulatory frameworks regarding ingredient safety and environmental impact influence market dynamics. The market witnesses consistent competition from synthetic alternatives and natural extracts, with increasing consumer preference for natural ingredients shaping the competitive landscape. End-user demographics, particularly the growing demand from the cosmetics and personal care sector, fuel market expansion. Mergers and acquisitions (M&A) activities are prevalent, with larger players consolidating their market presence and expanding their product portfolios.
- Market Concentration: The top 5 players account for approximately xx% of the global market (2024).
- Technological Innovation: Focus on sustainable sourcing, bio-based alternatives, and advanced extraction techniques.
- Regulatory Framework: Compliance with stringent safety and environmental regulations (e.g., REACH, FDA).
- Competitive Substitutes: Natural extracts, synthetic alternatives, and bio-identical compounds pose competition.
- M&A Activity: xx major M&A deals were recorded between 2019 and 2024, totaling an estimated value of xx Million.
- Innovation Barriers: High R&D costs, stringent regulatory approvals, and intellectual property protection challenges.
Aroma Chemicals Industry Growth Trends & Insights
The Aroma Chemicals market witnessed robust growth during the historical period (2019-2024), with a CAGR of xx%. This growth is projected to continue during the forecast period (2025-2033), driven by increasing demand from various end-use industries. The adoption rate of natural and sustainable aroma chemicals is increasing significantly, fuelled by rising consumer awareness of health and environmental concerns. Technological advancements in extraction, synthesis, and formulation are leading to the development of novel aroma chemicals with enhanced performance characteristics. Shifting consumer preferences towards natural and personalized fragrances and flavors are also significant growth drivers. Market penetration of specific aroma chemical types varies across different regions and applications, with the cosmetics and personal care sector showing strong adoption rates. Disruptive technologies, like AI-powered fragrance design, are poised to reshape the industry landscape.
Dominant Regions, Countries, or Segments in Aroma Chemicals Industry
The North American region currently holds the largest market share in the aroma chemicals industry, followed by Europe and Asia-Pacific. Within these regions, specific countries like the US, Germany, Japan, and China are key markets. In terms of segments, the Cosmetics and Toiletries application segment dominates, driven by high demand for fragrances and flavorings in personal care products. The Terpenes type holds a significant market share, owing to its wide application range and cost-effectiveness.
- Key Drivers (North America): Strong consumer spending, well-established cosmetic and food industries, robust research and development activities.
- Key Drivers (Europe): Stringent regulatory environment driving demand for natural and sustainable products, large consumer base.
- Key Drivers (Asia-Pacific): Rapid economic growth, expanding middle class, increasing consumer spending on personal care and food products.
- Dominant Segment (Application): Cosmetics and Toiletries (xx% market share in 2024), driven by increasing demand for premium fragrances and skincare products.
- Dominant Segment (Type): Terpenes (xx% market share in 2024), attributed to its versatile applications and cost-efficiency.
Aroma Chemicals Industry Product Landscape
The aroma chemicals market offers a wide range of products catering to diverse applications. Recent innovations focus on natural, sustainable, and bio-identical alternatives. The emphasis is on developing products with enhanced performance, including improved stability, longer shelf life, and superior sensory attributes. These advancements cater to increasing consumer demand for high-quality, safe, and environmentally friendly products. Unique selling propositions include enhanced efficacy, natural sourcing, and customizable aroma profiles.
Key Drivers, Barriers & Challenges in Aroma Chemicals Industry
Key Drivers:
- Growing demand from the cosmetics, food & beverage, and household products industries.
- Increasing consumer preference for natural and sustainable products.
- Technological advancements in extraction and synthesis methods.
Challenges:
- Fluctuating raw material prices, especially for natural ingredients.
- Stringent regulatory requirements and compliance costs.
- Intense competition from both established and emerging players.
- Supply chain disruptions impacting raw material availability and costs. (Estimated impact on market growth: xx% in 2024).
Emerging Opportunities in Aroma Chemicals Industry
- Growing demand for personalized fragrances and flavors.
- Expansion into untapped markets in developing economies.
- Development of innovative applications in niche segments (e.g., aromatherapy, pharmaceuticals).
- Increased adoption of sustainable and eco-friendly manufacturing practices.
Growth Accelerators in the Aroma Chemicals Industry
Strategic partnerships and collaborations between aroma chemical manufacturers and end-use industries are driving market growth. Technological breakthroughs in natural extraction and bio-based synthesis create new product opportunities. Market expansion into emerging economies, particularly in Asia-Pacific and Latin America, presents significant growth potential.
Key Players Shaping the Aroma Chemicals Industry Market
- Hindustan Mint and Agro Products Pvt Ltd
- Givaudan
- Symrise
- Kalpsutra Chemicals Pvt Ltd
- Solvay
- Takasago International Corporation
- BASF SE
- S H Kelkar And Company Limited
- Robertet Group
- DSM
- Bell Flavors & Fragrances
- Treatt Plc
- Kao Corporation
- Silverline Chemicals
Notable Milestones in Aroma Chemicals Industry Sector
- Sept 2022: Solvay launched three new natural flavors (Rhovanil Natural Delica, Alta, and Sublima), expanding its Rhovanil Natural CW product range. This significantly strengthens its position in the F&B sector.
- Aug 2022: Kao Corporation announced plans to maintain and expand its European market share for methyl dihydro jasmonate (MDJ), a synthetic fragrance. This indicates continued demand for synthetic fragrance materials.
In-Depth Aroma Chemicals Industry Market Outlook
The Aroma Chemicals market is poised for continued growth, driven by the factors outlined above. Strategic investments in R&D, sustainable practices, and market expansion into emerging regions will be crucial for success. Companies that can innovate and adapt to changing consumer preferences and regulatory landscapes will be best positioned to capture market share in the years to come. The focus on natural and sustainable products will continue to shape the industry's future, presenting significant opportunities for companies committed to environmentally conscious manufacturing.
Aroma Chemicals Industry Segmentation
-
1. Type
- 1.1. Terpenes
- 1.2. Benzenoids
- 1.3. Musk Chemicals
- 1.4. Other Types
-
2. Application
- 2.1. Soap and Detergents
- 2.2. Cosmetics and Toiletries
- 2.3. Fine Fragrances
- 2.4. Household Products
- 2.5. Food and Beverage
- 2.6. Other Applications
Aroma Chemicals Industry Segmentation By Geography
-
1. Asia Pacific
- 1.1. China
- 1.2. India
- 1.3. Japan
- 1.4. South Korea
- 1.5. Rest of Asia Pacific
-
2. North America
- 2.1. United States
- 2.2. Canada
- 2.3. Mexico
-
3. Europe
- 3.1. Germany
- 3.2. United Kingdom
- 3.3. Italy
- 3.4. France
- 3.5. Rest of Europe
-
4. South America
- 4.1. Brazil
- 4.2. Argentina
- 4.3. Rest of South America
-
5. Middle East and Africa
- 5.1. Saudi Arabia
- 5.2. South Africa
- 5.3. Rest of Middle East and Africa
Aroma Chemicals Industry REPORT HIGHLIGHTS
| Aspects | Details |
|---|---|
| Study Period | 2019-2033 |
| Base Year | 2024 |
| Estimated Year | 2025 |
| Forecast Period | 2025-2033 |
| Historical Period | 2019-2024 |
| Growth Rate | CAGR of 4.65% from 2019-2033 |
| Segmentation |
|
Table of Contents
- 1. Introduction
- 1.1. Research Scope
- 1.2. Market Segmentation
- 1.3. Research Methodology
- 1.4. Definitions and Assumptions
- 2. Executive Summary
- 2.1. Introduction
- 3. Market Dynamics
- 3.1. Introduction
- 3.2. Market Drivers
- 3.2.1. Blooming Use in Fragrance Industry; Increasing advancements in the personal care products industries; Other Drivers
- 3.3. Market Restrains
- 3.3.1. High R&D Cost Coupled with Stringent Government Regulation; Other Restraints
- 3.4. Market Trends
- 3.4.1. Growing Demand from Fine Fragrances Application
- 4. Market Factor Analysis
- 4.1. Porters Five Forces
- 4.2. Supply/Value Chain
- 4.3. PESTEL analysis
- 4.4. Market Entropy
- 4.5. Patent/Trademark Analysis
- 5. Global Aroma Chemicals Industry Analysis, Insights and Forecast, 2019-2031
- 5.1. Market Analysis, Insights and Forecast - by Type
- 5.1.1. Terpenes
- 5.1.2. Benzenoids
- 5.1.3. Musk Chemicals
- 5.1.4. Other Types
- 5.2. Market Analysis, Insights and Forecast - by Application
- 5.2.1. Soap and Detergents
- 5.2.2. Cosmetics and Toiletries
- 5.2.3. Fine Fragrances
- 5.2.4. Household Products
- 5.2.5. Food and Beverage
- 5.2.6. Other Applications
- 5.3. Market Analysis, Insights and Forecast - by Region
- 5.3.1. Asia Pacific
- 5.3.2. North America
- 5.3.3. Europe
- 5.3.4. South America
- 5.3.5. Middle East and Africa
- 5.1. Market Analysis, Insights and Forecast - by Type
- 6. Asia Pacific Aroma Chemicals Industry Analysis, Insights and Forecast, 2019-2031
- 6.1. Market Analysis, Insights and Forecast - by Type
- 6.1.1. Terpenes
- 6.1.2. Benzenoids
- 6.1.3. Musk Chemicals
- 6.1.4. Other Types
- 6.2. Market Analysis, Insights and Forecast - by Application
- 6.2.1. Soap and Detergents
- 6.2.2. Cosmetics and Toiletries
- 6.2.3. Fine Fragrances
- 6.2.4. Household Products
- 6.2.5. Food and Beverage
- 6.2.6. Other Applications
- 6.1. Market Analysis, Insights and Forecast - by Type
- 7. North America Aroma Chemicals Industry Analysis, Insights and Forecast, 2019-2031
- 7.1. Market Analysis, Insights and Forecast - by Type
- 7.1.1. Terpenes
- 7.1.2. Benzenoids
- 7.1.3. Musk Chemicals
- 7.1.4. Other Types
- 7.2. Market Analysis, Insights and Forecast - by Application
- 7.2.1. Soap and Detergents
- 7.2.2. Cosmetics and Toiletries
- 7.2.3. Fine Fragrances
- 7.2.4. Household Products
- 7.2.5. Food and Beverage
- 7.2.6. Other Applications
- 7.1. Market Analysis, Insights and Forecast - by Type
- 8. Europe Aroma Chemicals Industry Analysis, Insights and Forecast, 2019-2031
- 8.1. Market Analysis, Insights and Forecast - by Type
- 8.1.1. Terpenes
- 8.1.2. Benzenoids
- 8.1.3. Musk Chemicals
- 8.1.4. Other Types
- 8.2. Market Analysis, Insights and Forecast - by Application
- 8.2.1. Soap and Detergents
- 8.2.2. Cosmetics and Toiletries
- 8.2.3. Fine Fragrances
- 8.2.4. Household Products
- 8.2.5. Food and Beverage
- 8.2.6. Other Applications
- 8.1. Market Analysis, Insights and Forecast - by Type
- 9. South America Aroma Chemicals Industry Analysis, Insights and Forecast, 2019-2031
- 9.1. Market Analysis, Insights and Forecast - by Type
- 9.1.1. Terpenes
- 9.1.2. Benzenoids
- 9.1.3. Musk Chemicals
- 9.1.4. Other Types
- 9.2. Market Analysis, Insights and Forecast - by Application
- 9.2.1. Soap and Detergents
- 9.2.2. Cosmetics and Toiletries
- 9.2.3. Fine Fragrances
- 9.2.4. Household Products
- 9.2.5. Food and Beverage
- 9.2.6. Other Applications
- 9.1. Market Analysis, Insights and Forecast - by Type
- 10. Middle East and Africa Aroma Chemicals Industry Analysis, Insights and Forecast, 2019-2031
- 10.1. Market Analysis, Insights and Forecast - by Type
- 10.1.1. Terpenes
- 10.1.2. Benzenoids
- 10.1.3. Musk Chemicals
- 10.1.4. Other Types
- 10.2. Market Analysis, Insights and Forecast - by Application
- 10.2.1. Soap and Detergents
- 10.2.2. Cosmetics and Toiletries
- 10.2.3. Fine Fragrances
- 10.2.4. Household Products
- 10.2.5. Food and Beverage
- 10.2.6. Other Applications
- 10.1. Market Analysis, Insights and Forecast - by Type
- 11. Asia Pacific Aroma Chemicals Industry Analysis, Insights and Forecast, 2019-2031
- 11.1. Market Analysis, Insights and Forecast - By Country/Sub-region
- 11.1.1 China
- 11.1.2 India
- 11.1.3 Japan
- 11.1.4 South Korea
- 11.1.5 Rest of Asia Pacific
- 12. North America Aroma Chemicals Industry Analysis, Insights and Forecast, 2019-2031
- 12.1. Market Analysis, Insights and Forecast - By Country/Sub-region
- 12.1.1 United States
- 12.1.2 Canada
- 12.1.3 Mexico
- 13. Europe Aroma Chemicals Industry Analysis, Insights and Forecast, 2019-2031
- 13.1. Market Analysis, Insights and Forecast - By Country/Sub-region
- 13.1.1 Germany
- 13.1.2 United Kingdom
- 13.1.3 Italy
- 13.1.4 France
- 13.1.5 Rest of Europe
- 14. South America Aroma Chemicals Industry Analysis, Insights and Forecast, 2019-2031
- 14.1. Market Analysis, Insights and Forecast - By Country/Sub-region
- 14.1.1 Brazil
- 14.1.2 Argentina
- 14.1.3 Rest of South America
- 15. Middle East and Africa Aroma Chemicals Industry Analysis, Insights and Forecast, 2019-2031
- 15.1. Market Analysis, Insights and Forecast - By Country/Sub-region
- 15.1.1 Saudi Arabia
- 15.1.2 South Africa
- 15.1.3 Rest of Middle East and Africa
- 16. Competitive Analysis
- 16.1. Global Market Share Analysis 2024
- 16.2. Company Profiles
- 16.2.1 Hindustan Mint and Agro Products Pvt Ltd
- 16.2.1.1. Overview
- 16.2.1.2. Products
- 16.2.1.3. SWOT Analysis
- 16.2.1.4. Recent Developments
- 16.2.1.5. Financials (Based on Availability)
- 16.2.2 Givaudan
- 16.2.2.1. Overview
- 16.2.2.2. Products
- 16.2.2.3. SWOT Analysis
- 16.2.2.4. Recent Developments
- 16.2.2.5. Financials (Based on Availability)
- 16.2.3 Symrise
- 16.2.3.1. Overview
- 16.2.3.2. Products
- 16.2.3.3. SWOT Analysis
- 16.2.3.4. Recent Developments
- 16.2.3.5. Financials (Based on Availability)
- 16.2.4 Kalpsutra Chemicals Pvt Ltd
- 16.2.4.1. Overview
- 16.2.4.2. Products
- 16.2.4.3. SWOT Analysis
- 16.2.4.4. Recent Developments
- 16.2.4.5. Financials (Based on Availability)
- 16.2.5 Solvay
- 16.2.5.1. Overview
- 16.2.5.2. Products
- 16.2.5.3. SWOT Analysis
- 16.2.5.4. Recent Developments
- 16.2.5.5. Financials (Based on Availability)
- 16.2.6 Takasago International Corporation
- 16.2.6.1. Overview
- 16.2.6.2. Products
- 16.2.6.3. SWOT Analysis
- 16.2.6.4. Recent Developments
- 16.2.6.5. Financials (Based on Availability)
- 16.2.7 BASF SE
- 16.2.7.1. Overview
- 16.2.7.2. Products
- 16.2.7.3. SWOT Analysis
- 16.2.7.4. Recent Developments
- 16.2.7.5. Financials (Based on Availability)
- 16.2.8 S H Kelkar And Company Limited
- 16.2.8.1. Overview
- 16.2.8.2. Products
- 16.2.8.3. SWOT Analysis
- 16.2.8.4. Recent Developments
- 16.2.8.5. Financials (Based on Availability)
- 16.2.9 Robertet Group
- 16.2.9.1. Overview
- 16.2.9.2. Products
- 16.2.9.3. SWOT Analysis
- 16.2.9.4. Recent Developments
- 16.2.9.5. Financials (Based on Availability)
- 16.2.10 DSM
- 16.2.10.1. Overview
- 16.2.10.2. Products
- 16.2.10.3. SWOT Analysis
- 16.2.10.4. Recent Developments
- 16.2.10.5. Financials (Based on Availability)
- 16.2.11 Bell Flavors & Fragrances
- 16.2.11.1. Overview
- 16.2.11.2. Products
- 16.2.11.3. SWOT Analysis
- 16.2.11.4. Recent Developments
- 16.2.11.5. Financials (Based on Availability)
- 16.2.12 Treatt Plc*List Not Exhaustive
- 16.2.12.1. Overview
- 16.2.12.2. Products
- 16.2.12.3. SWOT Analysis
- 16.2.12.4. Recent Developments
- 16.2.12.5. Financials (Based on Availability)
- 16.2.13 Kao Corporation
- 16.2.13.1. Overview
- 16.2.13.2. Products
- 16.2.13.3. SWOT Analysis
- 16.2.13.4. Recent Developments
- 16.2.13.5. Financials (Based on Availability)
- 16.2.14 Silverline Chemicals
- 16.2.14.1. Overview
- 16.2.14.2. Products
- 16.2.14.3. SWOT Analysis
- 16.2.14.4. Recent Developments
- 16.2.14.5. Financials (Based on Availability)
- 16.2.1 Hindustan Mint and Agro Products Pvt Ltd
List of Figures
- Figure 1: Global Aroma Chemicals Industry Revenue Breakdown (Million, %) by Region 2024 & 2032
- Figure 2: Asia Pacific Aroma Chemicals Industry Revenue (Million), by Country 2024 & 2032
- Figure 3: Asia Pacific Aroma Chemicals Industry Revenue Share (%), by Country 2024 & 2032
- Figure 4: North America Aroma Chemicals Industry Revenue (Million), by Country 2024 & 2032
- Figure 5: North America Aroma Chemicals Industry Revenue Share (%), by Country 2024 & 2032
- Figure 6: Europe Aroma Chemicals Industry Revenue (Million), by Country 2024 & 2032
- Figure 7: Europe Aroma Chemicals Industry Revenue Share (%), by Country 2024 & 2032
- Figure 8: South America Aroma Chemicals Industry Revenue (Million), by Country 2024 & 2032
- Figure 9: South America Aroma Chemicals Industry Revenue Share (%), by Country 2024 & 2032
- Figure 10: Middle East and Africa Aroma Chemicals Industry Revenue (Million), by Country 2024 & 2032
- Figure 11: Middle East and Africa Aroma Chemicals Industry Revenue Share (%), by Country 2024 & 2032
- Figure 12: Asia Pacific Aroma Chemicals Industry Revenue (Million), by Type 2024 & 2032
- Figure 13: Asia Pacific Aroma Chemicals Industry Revenue Share (%), by Type 2024 & 2032
- Figure 14: Asia Pacific Aroma Chemicals Industry Revenue (Million), by Application 2024 & 2032
- Figure 15: Asia Pacific Aroma Chemicals Industry Revenue Share (%), by Application 2024 & 2032
- Figure 16: Asia Pacific Aroma Chemicals Industry Revenue (Million), by Country 2024 & 2032
- Figure 17: Asia Pacific Aroma Chemicals Industry Revenue Share (%), by Country 2024 & 2032
- Figure 18: North America Aroma Chemicals Industry Revenue (Million), by Type 2024 & 2032
- Figure 19: North America Aroma Chemicals Industry Revenue Share (%), by Type 2024 & 2032
- Figure 20: North America Aroma Chemicals Industry Revenue (Million), by Application 2024 & 2032
- Figure 21: North America Aroma Chemicals Industry Revenue Share (%), by Application 2024 & 2032
- Figure 22: North America Aroma Chemicals Industry Revenue (Million), by Country 2024 & 2032
- Figure 23: North America Aroma Chemicals Industry Revenue Share (%), by Country 2024 & 2032
- Figure 24: Europe Aroma Chemicals Industry Revenue (Million), by Type 2024 & 2032
- Figure 25: Europe Aroma Chemicals Industry Revenue Share (%), by Type 2024 & 2032
- Figure 26: Europe Aroma Chemicals Industry Revenue (Million), by Application 2024 & 2032
- Figure 27: Europe Aroma Chemicals Industry Revenue Share (%), by Application 2024 & 2032
- Figure 28: Europe Aroma Chemicals Industry Revenue (Million), by Country 2024 & 2032
- Figure 29: Europe Aroma Chemicals Industry Revenue Share (%), by Country 2024 & 2032
- Figure 30: South America Aroma Chemicals Industry Revenue (Million), by Type 2024 & 2032
- Figure 31: South America Aroma Chemicals Industry Revenue Share (%), by Type 2024 & 2032
- Figure 32: South America Aroma Chemicals Industry Revenue (Million), by Application 2024 & 2032
- Figure 33: South America Aroma Chemicals Industry Revenue Share (%), by Application 2024 & 2032
- Figure 34: South America Aroma Chemicals Industry Revenue (Million), by Country 2024 & 2032
- Figure 35: South America Aroma Chemicals Industry Revenue Share (%), by Country 2024 & 2032
- Figure 36: Middle East and Africa Aroma Chemicals Industry Revenue (Million), by Type 2024 & 2032
- Figure 37: Middle East and Africa Aroma Chemicals Industry Revenue Share (%), by Type 2024 & 2032
- Figure 38: Middle East and Africa Aroma Chemicals Industry Revenue (Million), by Application 2024 & 2032
- Figure 39: Middle East and Africa Aroma Chemicals Industry Revenue Share (%), by Application 2024 & 2032
- Figure 40: Middle East and Africa Aroma Chemicals Industry Revenue (Million), by Country 2024 & 2032
- Figure 41: Middle East and Africa Aroma Chemicals Industry Revenue Share (%), by Country 2024 & 2032
List of Tables
- Table 1: Global Aroma Chemicals Industry Revenue Million Forecast, by Region 2019 & 2032
- Table 2: Global Aroma Chemicals Industry Revenue Million Forecast, by Type 2019 & 2032
- Table 3: Global Aroma Chemicals Industry Revenue Million Forecast, by Application 2019 & 2032
- Table 4: Global Aroma Chemicals Industry Revenue Million Forecast, by Region 2019 & 2032
- Table 5: Global Aroma Chemicals Industry Revenue Million Forecast, by Country 2019 & 2032
- Table 6: China Aroma Chemicals Industry Revenue (Million) Forecast, by Application 2019 & 2032
- Table 7: India Aroma Chemicals Industry Revenue (Million) Forecast, by Application 2019 & 2032
- Table 8: Japan Aroma Chemicals Industry Revenue (Million) Forecast, by Application 2019 & 2032
- Table 9: South Korea Aroma Chemicals Industry Revenue (Million) Forecast, by Application 2019 & 2032
- Table 10: Rest of Asia Pacific Aroma Chemicals Industry Revenue (Million) Forecast, by Application 2019 & 2032
- Table 11: Global Aroma Chemicals Industry Revenue Million Forecast, by Country 2019 & 2032
- Table 12: United States Aroma Chemicals Industry Revenue (Million) Forecast, by Application 2019 & 2032
- Table 13: Canada Aroma Chemicals Industry Revenue (Million) Forecast, by Application 2019 & 2032
- Table 14: Mexico Aroma Chemicals Industry Revenue (Million) Forecast, by Application 2019 & 2032
- Table 15: Global Aroma Chemicals Industry Revenue Million Forecast, by Country 2019 & 2032
- Table 16: Germany Aroma Chemicals Industry Revenue (Million) Forecast, by Application 2019 & 2032
- Table 17: United Kingdom Aroma Chemicals Industry Revenue (Million) Forecast, by Application 2019 & 2032
- Table 18: Italy Aroma Chemicals Industry Revenue (Million) Forecast, by Application 2019 & 2032
- Table 19: France Aroma Chemicals Industry Revenue (Million) Forecast, by Application 2019 & 2032
- Table 20: Rest of Europe Aroma Chemicals Industry Revenue (Million) Forecast, by Application 2019 & 2032
- Table 21: Global Aroma Chemicals Industry Revenue Million Forecast, by Country 2019 & 2032
- Table 22: Brazil Aroma Chemicals Industry Revenue (Million) Forecast, by Application 2019 & 2032
- Table 23: Argentina Aroma Chemicals Industry Revenue (Million) Forecast, by Application 2019 & 2032
- Table 24: Rest of South America Aroma Chemicals Industry Revenue (Million) Forecast, by Application 2019 & 2032
- Table 25: Global Aroma Chemicals Industry Revenue Million Forecast, by Country 2019 & 2032
- Table 26: Saudi Arabia Aroma Chemicals Industry Revenue (Million) Forecast, by Application 2019 & 2032
- Table 27: South Africa Aroma Chemicals Industry Revenue (Million) Forecast, by Application 2019 & 2032
- Table 28: Rest of Middle East and Africa Aroma Chemicals Industry Revenue (Million) Forecast, by Application 2019 & 2032
- Table 29: Global Aroma Chemicals Industry Revenue Million Forecast, by Type 2019 & 2032
- Table 30: Global Aroma Chemicals Industry Revenue Million Forecast, by Application 2019 & 2032
- Table 31: Global Aroma Chemicals Industry Revenue Million Forecast, by Country 2019 & 2032
- Table 32: China Aroma Chemicals Industry Revenue (Million) Forecast, by Application 2019 & 2032
- Table 33: India Aroma Chemicals Industry Revenue (Million) Forecast, by Application 2019 & 2032
- Table 34: Japan Aroma Chemicals Industry Revenue (Million) Forecast, by Application 2019 & 2032
- Table 35: South Korea Aroma Chemicals Industry Revenue (Million) Forecast, by Application 2019 & 2032
- Table 36: Rest of Asia Pacific Aroma Chemicals Industry Revenue (Million) Forecast, by Application 2019 & 2032
- Table 37: Global Aroma Chemicals Industry Revenue Million Forecast, by Type 2019 & 2032
- Table 38: Global Aroma Chemicals Industry Revenue Million Forecast, by Application 2019 & 2032
- Table 39: Global Aroma Chemicals Industry Revenue Million Forecast, by Country 2019 & 2032
- Table 40: United States Aroma Chemicals Industry Revenue (Million) Forecast, by Application 2019 & 2032
- Table 41: Canada Aroma Chemicals Industry Revenue (Million) Forecast, by Application 2019 & 2032
- Table 42: Mexico Aroma Chemicals Industry Revenue (Million) Forecast, by Application 2019 & 2032
- Table 43: Global Aroma Chemicals Industry Revenue Million Forecast, by Type 2019 & 2032
- Table 44: Global Aroma Chemicals Industry Revenue Million Forecast, by Application 2019 & 2032
- Table 45: Global Aroma Chemicals Industry Revenue Million Forecast, by Country 2019 & 2032
- Table 46: Germany Aroma Chemicals Industry Revenue (Million) Forecast, by Application 2019 & 2032
- Table 47: United Kingdom Aroma Chemicals Industry Revenue (Million) Forecast, by Application 2019 & 2032
- Table 48: Italy Aroma Chemicals Industry Revenue (Million) Forecast, by Application 2019 & 2032
- Table 49: France Aroma Chemicals Industry Revenue (Million) Forecast, by Application 2019 & 2032
- Table 50: Rest of Europe Aroma Chemicals Industry Revenue (Million) Forecast, by Application 2019 & 2032
- Table 51: Global Aroma Chemicals Industry Revenue Million Forecast, by Type 2019 & 2032
- Table 52: Global Aroma Chemicals Industry Revenue Million Forecast, by Application 2019 & 2032
- Table 53: Global Aroma Chemicals Industry Revenue Million Forecast, by Country 2019 & 2032
- Table 54: Brazil Aroma Chemicals Industry Revenue (Million) Forecast, by Application 2019 & 2032
- Table 55: Argentina Aroma Chemicals Industry Revenue (Million) Forecast, by Application 2019 & 2032
- Table 56: Rest of South America Aroma Chemicals Industry Revenue (Million) Forecast, by Application 2019 & 2032
- Table 57: Global Aroma Chemicals Industry Revenue Million Forecast, by Type 2019 & 2032
- Table 58: Global Aroma Chemicals Industry Revenue Million Forecast, by Application 2019 & 2032
- Table 59: Global Aroma Chemicals Industry Revenue Million Forecast, by Country 2019 & 2032
- Table 60: Saudi Arabia Aroma Chemicals Industry Revenue (Million) Forecast, by Application 2019 & 2032
- Table 61: South Africa Aroma Chemicals Industry Revenue (Million) Forecast, by Application 2019 & 2032
- Table 62: Rest of Middle East and Africa Aroma Chemicals Industry Revenue (Million) Forecast, by Application 2019 & 2032
Frequently Asked Questions
1. What is the projected Compound Annual Growth Rate (CAGR) of the Aroma Chemicals Industry?
The projected CAGR is approximately 4.65%.
2. Which companies are prominent players in the Aroma Chemicals Industry?
Key companies in the market include Hindustan Mint and Agro Products Pvt Ltd, Givaudan, Symrise, Kalpsutra Chemicals Pvt Ltd, Solvay, Takasago International Corporation, BASF SE, S H Kelkar And Company Limited, Robertet Group, DSM, Bell Flavors & Fragrances, Treatt Plc*List Not Exhaustive, Kao Corporation, Silverline Chemicals.
3. What are the main segments of the Aroma Chemicals Industry?
The market segments include Type, Application.
4. Can you provide details about the market size?
The market size is estimated to be USD 4.66 Million as of 2022.
5. What are some drivers contributing to market growth?
Blooming Use in Fragrance Industry; Increasing advancements in the personal care products industries; Other Drivers.
6. What are the notable trends driving market growth?
Growing Demand from Fine Fragrances Application.
7. Are there any restraints impacting market growth?
High R&D Cost Coupled with Stringent Government Regulation; Other Restraints.
8. Can you provide examples of recent developments in the market?
Sept 2022: Solvay expanded the range of one of its flagship products, Rhovanil Natural CW, with three new natural flavors: Rhovanil Natural Delica, Alta, and Sublima. With these new products, the group will enable the F&B industry to make a cost-effective transition to natural products and respond to growing consumer expectations for healthier, safer, tastier, and more natural products.
9. What pricing options are available for accessing the report?
Pricing options include single-user, multi-user, and enterprise licenses priced at USD 4750, USD 5250, and USD 8750 respectively.
10. Is the market size provided in terms of value or volume?
The market size is provided in terms of value, measured in Million.
11. Are there any specific market keywords associated with the report?
Yes, the market keyword associated with the report is "Aroma Chemicals Industry," which aids in identifying and referencing the specific market segment covered.
12. How do I determine which pricing option suits my needs best?
The pricing options vary based on user requirements and access needs. Individual users may opt for single-user licenses, while businesses requiring broader access may choose multi-user or enterprise licenses for cost-effective access to the report.
13. Are there any additional resources or data provided in the Aroma Chemicals Industry report?
While the report offers comprehensive insights, it's advisable to review the specific contents or supplementary materials provided to ascertain if additional resources or data are available.
14. How can I stay updated on further developments or reports in the Aroma Chemicals Industry?
To stay informed about further developments, trends, and reports in the Aroma Chemicals Industry, consider subscribing to industry newsletters, following relevant companies and organizations, or regularly checking reputable industry news sources and publications.
Methodology
Step 1 - Identification of Relevant Samples Size from Population Database


Step 2 - Approaches for Defining Global Market Size (Value, Volume* & Price*)

Note*: In applicable scenarios
Step 3 - Data Sources
Primary Research
- Web Analytics
- Survey Reports
- Research Institute
- Latest Research Reports
- Opinion Leaders
Secondary Research
- Annual Reports
- White Paper
- Latest Press Release
- Industry Association
- Paid Database
- Investor Presentations

Step 4 - Data Triangulation
Involves using different sources of information in order to increase the validity of a study
These sources are likely to be stakeholders in a program - participants, other researchers, program staff, other community members, and so on.
Then we put all data in single framework & apply various statistical tools to find out the dynamic on the market.
During the analysis stage, feedback from the stakeholder groups would be compared to determine areas of agreement as well as areas of divergence


