
Key Insights
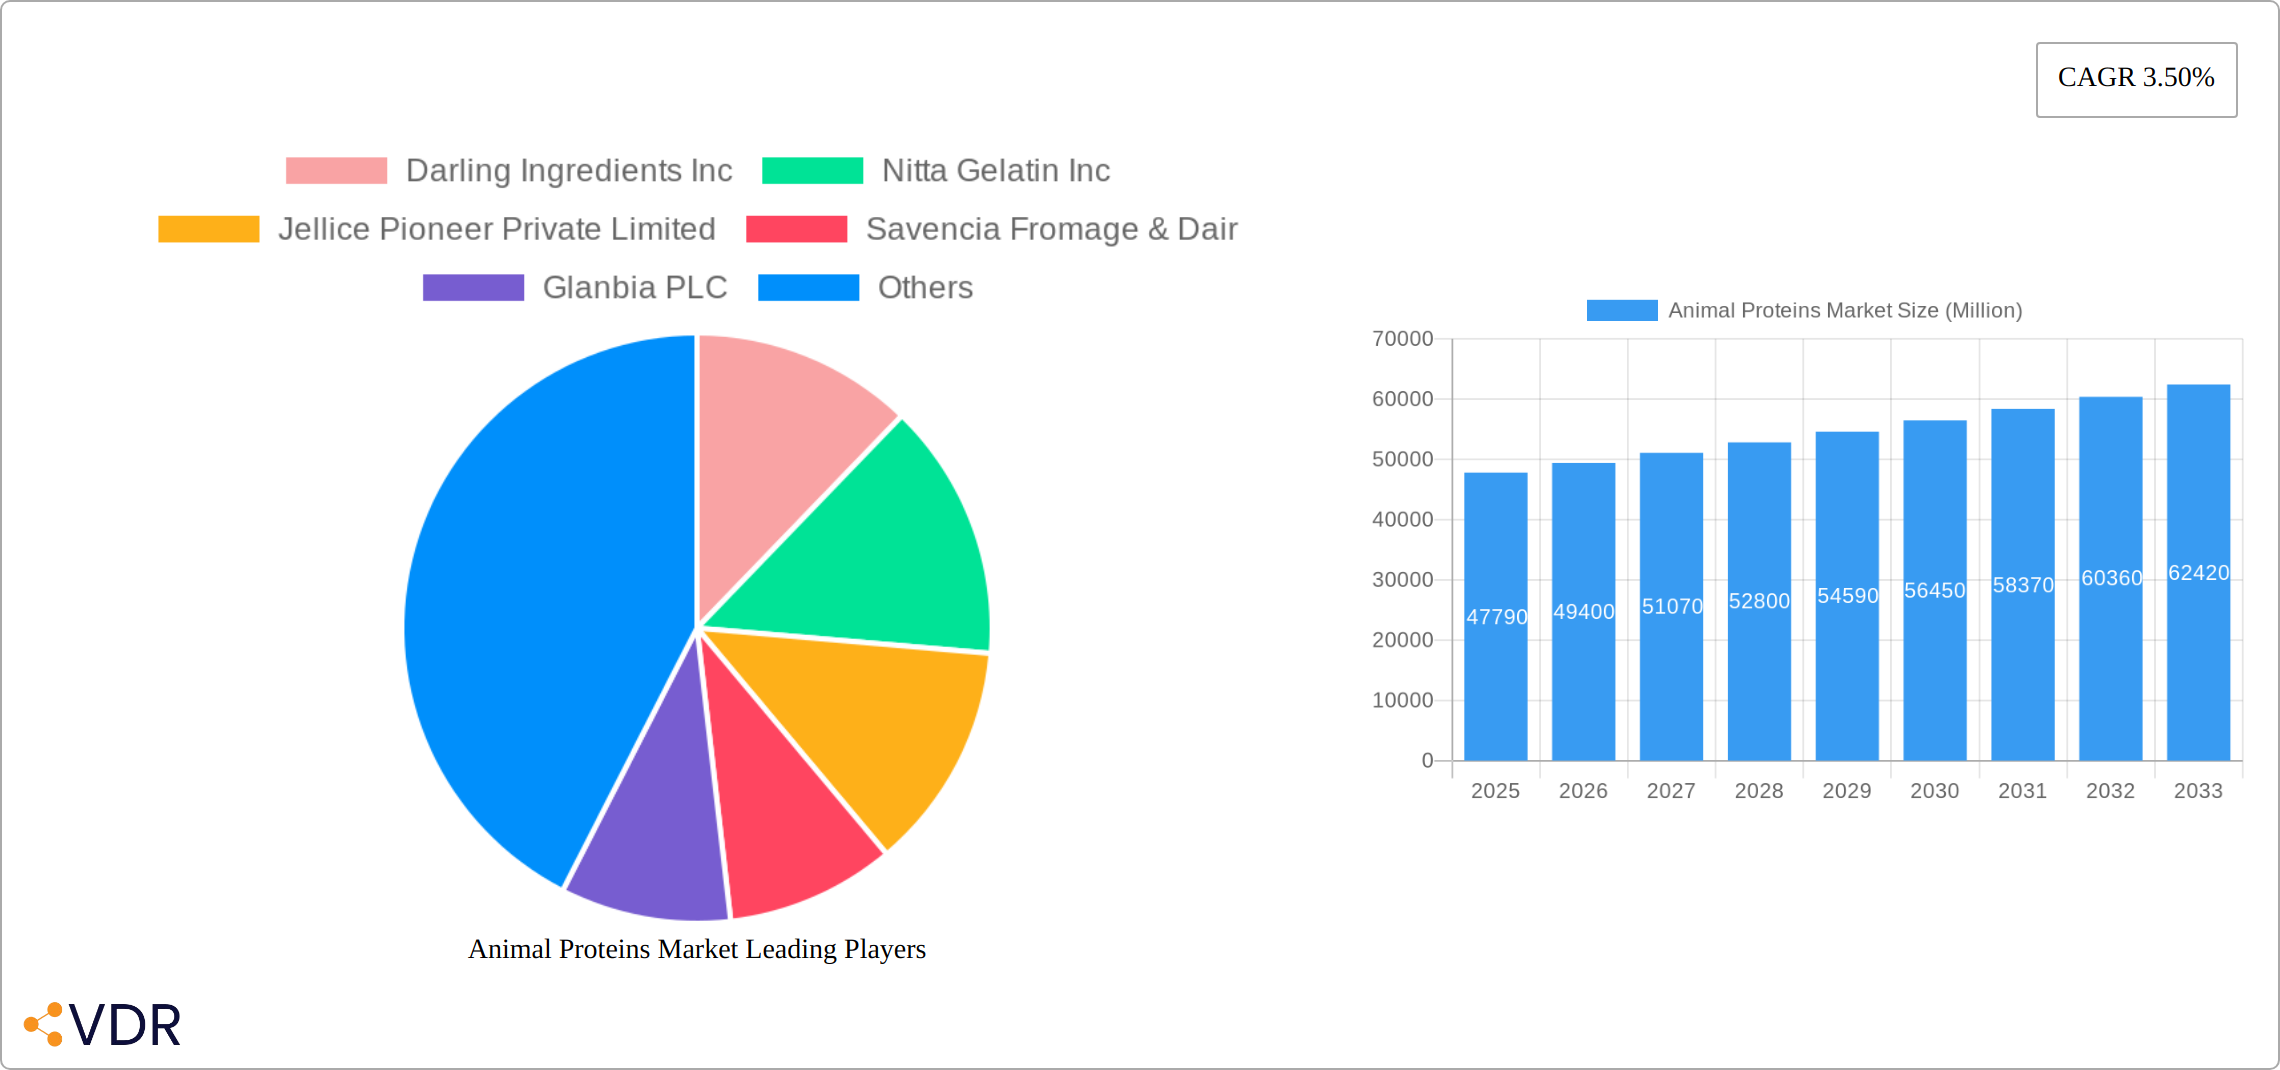
The global animal protein market, valued at $47,790 million in 2025, is projected to experience steady growth, driven primarily by the expanding animal feed industry and increasing demand for protein-rich food and beverages. The compound annual growth rate (CAGR) of 3.50% from 2025 to 2033 reflects a consistent, albeit moderate, expansion. Key drivers include the rising global population, increasing disposable incomes in developing nations fueling higher meat consumption, and the growing awareness of the nutritional benefits of animal protein in sports nutrition. Trends such as the adoption of sustainable sourcing practices and the rise of novel protein sources like insect protein are shaping the market landscape. However, challenges remain, including fluctuating raw material prices, stringent regulations concerning animal feed safety, and concerns regarding the environmental impact of animal agriculture. The market is segmented by protein type (whey, casein, collagen, egg, etc.) and end-user (animal feed, food & beverages, sports nutrition), with whey protein and casein currently dominating the protein type segment due to their wide applications across various sectors. The geographical distribution shows a strong presence in North America and Europe, driven by established food processing industries and higher per capita consumption. However, Asia-Pacific is expected to witness significant growth in the coming years, fueled by burgeoning economies and expanding consumer base.
The projected growth trajectory indicates that the animal protein market will reach approximately $62,000 million by 2033. This forecast is based on the provided CAGR and considers the interplay of market drivers, trends, and restraints. The growth will be influenced by innovations in protein extraction and processing techniques, leading to more efficient and sustainable production. Furthermore, strategic partnerships between animal protein manufacturers and food and beverage companies will likely accelerate product development and market penetration. Companies are focusing on diversifying their product portfolios to cater to the growing demand for specialized animal proteins in niche sectors such as functional foods and specialized pet foods. Competition amongst major players is expected to remain intense, driving innovation and efficiency improvements across the value chain.
Animal Proteins Market: A Comprehensive Report (2019-2033)
This comprehensive report provides an in-depth analysis of the Animal Proteins Market, encompassing market dynamics, growth trends, regional dominance, product landscape, key challenges, emerging opportunities, and key players. The report covers the period from 2019 to 2033, with 2025 serving as the base and estimated year. The market is segmented by protein type (Casein and Caseinates, Collagen, Egg Protein, Gelatin, Insect Protein, Milk Protein, Whey Protein, Other Animal Protein) and end-user (Animal Feed, Food and Beverages, Sport/Performance Nutrition). The market is projected to reach xx Million by 2033.
Animal Proteins Market Market Dynamics & Structure
The animal proteins market is characterized by moderate concentration, with several large players holding significant market share. Technological innovation, particularly in protein extraction and processing, is a key driver. Stringent regulatory frameworks concerning food safety and labeling influence market dynamics. Competitive substitutes, such as plant-based proteins, are impacting market growth. End-user demographics, with increasing health consciousness and demand for high-protein diets, are shaping market trends. M&A activity has been significant, with several deals aimed at expanding product portfolios and geographic reach.
- Market Concentration: Moderately concentrated, with top 10 players holding approximately xx% of market share in 2024.
- Technological Innovation: Focus on sustainable extraction methods, improved protein functionality, and novel protein sources (e.g., insect protein).
- Regulatory Landscape: Stringent food safety regulations and labeling requirements, varying across regions.
- Competitive Substitutes: Plant-based protein alternatives are gaining traction, impacting market share of animal-derived proteins.
- M&A Activity: xx major M&A deals recorded between 2019 and 2024, primarily focused on expansion and diversification.
- Innovation Barriers: High R&D costs, regulatory hurdles, and consumer acceptance of novel protein sources.
Animal Proteins Market Growth Trends & Insights
The animal proteins market experienced robust growth during the historical period (2019-2024), driven by increasing demand from the food and beverage, animal feed, and sports nutrition sectors. The market size expanded from xx Million in 2019 to xx Million in 2024, registering a CAGR of xx%. Technological advancements in protein extraction and processing have enhanced product quality and efficiency. Consumer preference shifts toward healthier diets and convenient protein sources are fueling market growth. The forecast period (2025-2033) anticipates sustained growth, propelled by rising disposable incomes, growing health awareness, and product innovation. Market penetration in emerging economies is expected to contribute significantly to growth. Technological disruptions, such as the rise of precision fermentation and cell-based proteins, will reshape the market landscape in the coming years, influencing adoption rates. The market is projected to reach xx Million by 2033.

Dominant Regions, Countries, or Segments in Animal Proteins Market
North America and Europe currently dominate the animal proteins market, driven by high per capita consumption of protein-rich foods and well-established food processing industries. Within protein types, whey protein and casein hold significant market share, owing to their widespread use in food and beverage applications and the sports nutrition industry. The animal feed segment constitutes a substantial portion of the overall market, driven by the growing demand for livestock and poultry products globally.
- Dominant Region: North America, holding an estimated xx% market share in 2024.
- Key Drivers (North America): High protein consumption, strong food processing infrastructure, and established sports nutrition industry.
- High-Growth Segment: Whey protein, experiencing a CAGR of xx% during 2019-2024, driven by its functional properties and versatility.
- Fastest-Growing Region: Asia-Pacific, exhibiting strong growth potential due to increasing disposable incomes and changing dietary habits.
- Key Drivers (Asia-Pacific): Rising middle class, increasing health consciousness, and rapid growth in the food and beverage sector.
Animal Proteins Market Product Landscape
The animal proteins market offers a diverse range of products tailored to specific applications. Innovations focus on enhancing protein functionality, improving digestibility, and developing sustainable production methods. Product differentiation strategies leverage unique selling propositions like enhanced taste, improved texture, and added functional benefits (e.g., improved gut health). Technological advancements in protein isolation, purification, and modification techniques continue to broaden the range of available products and their applications.
Key Drivers, Barriers & Challenges in Animal Proteins Market
Key Drivers:
- Rising global protein demand, driven by population growth and changing dietary patterns.
- Growing health and wellness consciousness, fueling demand for high-protein foods and supplements.
- Technological advancements in protein extraction, processing, and formulation.
- Expanding application areas across food & beverages, animal feed, and sports nutrition.
Key Challenges & Restraints:
- Fluctuations in raw material prices and availability.
- Stringent regulatory requirements and compliance costs.
- Increasing competition from plant-based protein alternatives.
- Sustainability concerns related to animal agriculture and protein production. The environmental impact of animal agriculture presents a significant challenge, projected to decrease market growth by xx% by 2030 if not addressed effectively.
Emerging Opportunities in Animal Proteins Market
- Growing demand for clean-label and sustainable animal proteins.
- Expansion into emerging markets with rising protein consumption.
- Innovation in functional protein ingredients with enhanced health benefits.
- Development of novel protein sources, such as insect protein and cell-based meat.
Growth Accelerators in the Animal Proteins Market Industry
Technological advancements in precision fermentation and cell-based proteins offer significant growth potential. Strategic partnerships between ingredient suppliers and food manufacturers accelerate product development and market penetration. Expansion into new geographic markets and diversification of product portfolios will further propel market growth.
Key Players Shaping the Animal Proteins Market Market
- Darling Ingredients Inc
- Nitta Gelatin Inc
- Jellice Pioneer Private Limited
- Savencia Fromage & Dair
- Glanbia PLC
- GELITA AG
- Royal FrieslandCampina NV
- Kerry Group PLC
- Groupe LACTALIS
- Fonterra Co-operative Group Limited
- Hilmar Cheese Company Inc
- Arla Foods AmbA
- Agrial Enterprise
Notable Milestones in Animal Proteins Market Sector
- August 2022: Optimum Nutrition launched its Gold Standard Protein Shake, boosting the RTD protein market.
- June 2022: Fonterra JV launched Pro-Optima TM fWPC, expanding the functional whey protein market.
- January 2022: Kerry opened a new facility in Saudi Arabia, enhancing its regional production capacity and distribution in the Middle East.
In-Depth Animal Proteins Market Market Outlook
The animal proteins market is poised for significant growth in the coming years, driven by a confluence of factors including rising protein demand, technological innovation, and expanding application areas. Strategic partnerships, investments in sustainable production, and focus on product differentiation will be crucial for success. The market offers substantial opportunities for both established players and new entrants, with significant potential for growth in emerging markets and the development of novel protein sources.
Animal Proteins Market Segmentation
-
1. Protein Type
- 1.1. Casein and Caseinates
- 1.2. Collagen
- 1.3. Egg Protein
- 1.4. Gelatin
- 1.5. Insect Protein
- 1.6. Milk Protein
- 1.7. Whey Protein
- 1.8. Other Animal Protein
-
2. End User
- 2.1. Animal Feed
-
2.2. Food and Beverages
-
2.2.1. By Sub End User
- 2.2.1.1. Bakery
- 2.2.1.2. Breakfast Cereals
- 2.2.1.3. Condiments/Sauces
- 2.2.1.4. Confectionery
- 2.2.1.5. Dairy and Dairy Alternative Products
- 2.2.1.6. RTE/RTC Food Products
- 2.2.1.7. Snacks
-
2.2.1. By Sub End User
- 2.3. Personal Care and Cosmetics
-
2.4. Supplements
- 2.4.1. Baby Food and Infant Formula
- 2.4.2. Elderly Nutrition and Medical Nutrition
- 2.4.3. Sport/Performance Nutrition
Animal Proteins Market Segmentation By Geography
-
1. North America
- 1.1. United States
- 1.2. Canada
- 1.3. Mexico
-
2. South America
- 2.1. Brazil
- 2.2. Argentina
- 2.3. Rest of South America
-
3. Europe
- 3.1. United Kingdom
- 3.2. Germany
- 3.3. France
- 3.4. Italy
- 3.5. Spain
- 3.6. Russia
- 3.7. Benelux
- 3.8. Nordics
- 3.9. Rest of Europe
-
4. Middle East & Africa
- 4.1. Turkey
- 4.2. Israel
- 4.3. GCC
- 4.4. North Africa
- 4.5. South Africa
- 4.6. Rest of Middle East & Africa
-
5. Asia Pacific
- 5.1. China
- 5.2. India
- 5.3. Japan
- 5.4. South Korea
- 5.5. ASEAN
- 5.6. Oceania
- 5.7. Rest of Asia Pacific

Animal Proteins Market REPORT HIGHLIGHTS
| Aspects | Details |
|---|---|
| Study Period | 2019-2033 |
| Base Year | 2024 |
| Estimated Year | 2025 |
| Forecast Period | 2025-2033 |
| Historical Period | 2019-2024 |
| Growth Rate | CAGR of 3.50% from 2019-2033 |
| Segmentation |
|
Table of Contents
- 1. Introduction
- 1.1. Research Scope
- 1.2. Market Segmentation
- 1.3. Research Methodology
- 1.4. Definitions and Assumptions
- 2. Executive Summary
- 2.1. Introduction
- 3. Market Dynamics
- 3.1. Introduction
- 3.2. Market Drivers
- 3.2.1. Increasing Demand For Convenience & Processed Food
- 3.3. Market Restrains
- 3.3.1. Increased Consumer Awareness On Side-Effects Of Chemical Additives
- 3.4. Market Trends
- 3.4.1. OTHER KEY INDUSTRY TRENDS COVERED IN THE REPORT
- 4. Market Factor Analysis
- 4.1. Porters Five Forces
- 4.2. Supply/Value Chain
- 4.3. PESTEL analysis
- 4.4. Market Entropy
- 4.5. Patent/Trademark Analysis
- 5. Global Animal Proteins Market Analysis, Insights and Forecast, 2019-2031
- 5.1. Market Analysis, Insights and Forecast - by Protein Type
- 5.1.1. Casein and Caseinates
- 5.1.2. Collagen
- 5.1.3. Egg Protein
- 5.1.4. Gelatin
- 5.1.5. Insect Protein
- 5.1.6. Milk Protein
- 5.1.7. Whey Protein
- 5.1.8. Other Animal Protein
- 5.2. Market Analysis, Insights and Forecast - by End User
- 5.2.1. Animal Feed
- 5.2.2. Food and Beverages
- 5.2.2.1. By Sub End User
- 5.2.2.1.1. Bakery
- 5.2.2.1.2. Breakfast Cereals
- 5.2.2.1.3. Condiments/Sauces
- 5.2.2.1.4. Confectionery
- 5.2.2.1.5. Dairy and Dairy Alternative Products
- 5.2.2.1.6. RTE/RTC Food Products
- 5.2.2.1.7. Snacks
- 5.2.2.1. By Sub End User
- 5.2.3. Personal Care and Cosmetics
- 5.2.4. Supplements
- 5.2.4.1. Baby Food and Infant Formula
- 5.2.4.2. Elderly Nutrition and Medical Nutrition
- 5.2.4.3. Sport/Performance Nutrition
- 5.3. Market Analysis, Insights and Forecast - by Region
- 5.3.1. North America
- 5.3.2. South America
- 5.3.3. Europe
- 5.3.4. Middle East & Africa
- 5.3.5. Asia Pacific
- 5.1. Market Analysis, Insights and Forecast - by Protein Type
- 6. North America Animal Proteins Market Analysis, Insights and Forecast, 2019-2031
- 6.1. Market Analysis, Insights and Forecast - by Protein Type
- 6.1.1. Casein and Caseinates
- 6.1.2. Collagen
- 6.1.3. Egg Protein
- 6.1.4. Gelatin
- 6.1.5. Insect Protein
- 6.1.6. Milk Protein
- 6.1.7. Whey Protein
- 6.1.8. Other Animal Protein
- 6.2. Market Analysis, Insights and Forecast - by End User
- 6.2.1. Animal Feed
- 6.2.2. Food and Beverages
- 6.2.2.1. By Sub End User
- 6.2.2.1.1. Bakery
- 6.2.2.1.2. Breakfast Cereals
- 6.2.2.1.3. Condiments/Sauces
- 6.2.2.1.4. Confectionery
- 6.2.2.1.5. Dairy and Dairy Alternative Products
- 6.2.2.1.6. RTE/RTC Food Products
- 6.2.2.1.7. Snacks
- 6.2.2.1. By Sub End User
- 6.2.3. Personal Care and Cosmetics
- 6.2.4. Supplements
- 6.2.4.1. Baby Food and Infant Formula
- 6.2.4.2. Elderly Nutrition and Medical Nutrition
- 6.2.4.3. Sport/Performance Nutrition
- 6.1. Market Analysis, Insights and Forecast - by Protein Type
- 7. South America Animal Proteins Market Analysis, Insights and Forecast, 2019-2031
- 7.1. Market Analysis, Insights and Forecast - by Protein Type
- 7.1.1. Casein and Caseinates
- 7.1.2. Collagen
- 7.1.3. Egg Protein
- 7.1.4. Gelatin
- 7.1.5. Insect Protein
- 7.1.6. Milk Protein
- 7.1.7. Whey Protein
- 7.1.8. Other Animal Protein
- 7.2. Market Analysis, Insights and Forecast - by End User
- 7.2.1. Animal Feed
- 7.2.2. Food and Beverages
- 7.2.2.1. By Sub End User
- 7.2.2.1.1. Bakery
- 7.2.2.1.2. Breakfast Cereals
- 7.2.2.1.3. Condiments/Sauces
- 7.2.2.1.4. Confectionery
- 7.2.2.1.5. Dairy and Dairy Alternative Products
- 7.2.2.1.6. RTE/RTC Food Products
- 7.2.2.1.7. Snacks
- 7.2.2.1. By Sub End User
- 7.2.3. Personal Care and Cosmetics
- 7.2.4. Supplements
- 7.2.4.1. Baby Food and Infant Formula
- 7.2.4.2. Elderly Nutrition and Medical Nutrition
- 7.2.4.3. Sport/Performance Nutrition
- 7.1. Market Analysis, Insights and Forecast - by Protein Type
- 8. Europe Animal Proteins Market Analysis, Insights and Forecast, 2019-2031
- 8.1. Market Analysis, Insights and Forecast - by Protein Type
- 8.1.1. Casein and Caseinates
- 8.1.2. Collagen
- 8.1.3. Egg Protein
- 8.1.4. Gelatin
- 8.1.5. Insect Protein
- 8.1.6. Milk Protein
- 8.1.7. Whey Protein
- 8.1.8. Other Animal Protein
- 8.2. Market Analysis, Insights and Forecast - by End User
- 8.2.1. Animal Feed
- 8.2.2. Food and Beverages
- 8.2.2.1. By Sub End User
- 8.2.2.1.1. Bakery
- 8.2.2.1.2. Breakfast Cereals
- 8.2.2.1.3. Condiments/Sauces
- 8.2.2.1.4. Confectionery
- 8.2.2.1.5. Dairy and Dairy Alternative Products
- 8.2.2.1.6. RTE/RTC Food Products
- 8.2.2.1.7. Snacks
- 8.2.2.1. By Sub End User
- 8.2.3. Personal Care and Cosmetics
- 8.2.4. Supplements
- 8.2.4.1. Baby Food and Infant Formula
- 8.2.4.2. Elderly Nutrition and Medical Nutrition
- 8.2.4.3. Sport/Performance Nutrition
- 8.1. Market Analysis, Insights and Forecast - by Protein Type
- 9. Middle East & Africa Animal Proteins Market Analysis, Insights and Forecast, 2019-2031
- 9.1. Market Analysis, Insights and Forecast - by Protein Type
- 9.1.1. Casein and Caseinates
- 9.1.2. Collagen
- 9.1.3. Egg Protein
- 9.1.4. Gelatin
- 9.1.5. Insect Protein
- 9.1.6. Milk Protein
- 9.1.7. Whey Protein
- 9.1.8. Other Animal Protein
- 9.2. Market Analysis, Insights and Forecast - by End User
- 9.2.1. Animal Feed
- 9.2.2. Food and Beverages
- 9.2.2.1. By Sub End User
- 9.2.2.1.1. Bakery
- 9.2.2.1.2. Breakfast Cereals
- 9.2.2.1.3. Condiments/Sauces
- 9.2.2.1.4. Confectionery
- 9.2.2.1.5. Dairy and Dairy Alternative Products
- 9.2.2.1.6. RTE/RTC Food Products
- 9.2.2.1.7. Snacks
- 9.2.2.1. By Sub End User
- 9.2.3. Personal Care and Cosmetics
- 9.2.4. Supplements
- 9.2.4.1. Baby Food and Infant Formula
- 9.2.4.2. Elderly Nutrition and Medical Nutrition
- 9.2.4.3. Sport/Performance Nutrition
- 9.1. Market Analysis, Insights and Forecast - by Protein Type
- 10. Asia Pacific Animal Proteins Market Analysis, Insights and Forecast, 2019-2031
- 10.1. Market Analysis, Insights and Forecast - by Protein Type
- 10.1.1. Casein and Caseinates
- 10.1.2. Collagen
- 10.1.3. Egg Protein
- 10.1.4. Gelatin
- 10.1.5. Insect Protein
- 10.1.6. Milk Protein
- 10.1.7. Whey Protein
- 10.1.8. Other Animal Protein
- 10.2. Market Analysis, Insights and Forecast - by End User
- 10.2.1. Animal Feed
- 10.2.2. Food and Beverages
- 10.2.2.1. By Sub End User
- 10.2.2.1.1. Bakery
- 10.2.2.1.2. Breakfast Cereals
- 10.2.2.1.3. Condiments/Sauces
- 10.2.2.1.4. Confectionery
- 10.2.2.1.5. Dairy and Dairy Alternative Products
- 10.2.2.1.6. RTE/RTC Food Products
- 10.2.2.1.7. Snacks
- 10.2.2.1. By Sub End User
- 10.2.3. Personal Care and Cosmetics
- 10.2.4. Supplements
- 10.2.4.1. Baby Food and Infant Formula
- 10.2.4.2. Elderly Nutrition and Medical Nutrition
- 10.2.4.3. Sport/Performance Nutrition
- 10.1. Market Analysis, Insights and Forecast - by Protein Type
- 11. North America Animal Proteins Market Analysis, Insights and Forecast, 2019-2031
- 11.1. Market Analysis, Insights and Forecast - By Country/Sub-region
- 11.1.1 United States
- 11.1.2 Canada
- 12. Europe Animal Proteins Market Analysis, Insights and Forecast, 2019-2031
- 12.1. Market Analysis, Insights and Forecast - By Country/Sub-region
- 12.1.1 United Kingdom
- 12.1.2 Germany
- 12.1.3 France
- 12.1.4 Italy
- 13. Asia-Pacific Animal Proteins Market Analysis, Insights and Forecast, 2019-2031
- 13.1. Market Analysis, Insights and Forecast - By Country/Sub-region
- 13.1.1 China
- 13.1.2 Japan
- 13.1.3 India
- 14. Rest of the World Animal Proteins Market Analysis, Insights and Forecast, 2019-2031
- 14.1. Market Analysis, Insights and Forecast - By Country/Sub-region
- 14.1.1 Latin America
- 14.1.2 Middle East
- 14.1.3 and Africa
- 15. Competitive Analysis
- 15.1. Global Market Share Analysis 2024
- 15.2. Company Profiles
- 15.2.1 Darling Ingredients Inc
- 15.2.1.1. Overview
- 15.2.1.2. Products
- 15.2.1.3. SWOT Analysis
- 15.2.1.4. Recent Developments
- 15.2.1.5. Financials (Based on Availability)
- 15.2.2 Nitta Gelatin Inc
- 15.2.2.1. Overview
- 15.2.2.2. Products
- 15.2.2.3. SWOT Analysis
- 15.2.2.4. Recent Developments
- 15.2.2.5. Financials (Based on Availability)
- 15.2.3 Jellice Pioneer Private Limited
- 15.2.3.1. Overview
- 15.2.3.2. Products
- 15.2.3.3. SWOT Analysis
- 15.2.3.4. Recent Developments
- 15.2.3.5. Financials (Based on Availability)
- 15.2.4 Savencia Fromage & Dair
- 15.2.4.1. Overview
- 15.2.4.2. Products
- 15.2.4.3. SWOT Analysis
- 15.2.4.4. Recent Developments
- 15.2.4.5. Financials (Based on Availability)
- 15.2.5 Glanbia PLC
- 15.2.5.1. Overview
- 15.2.5.2. Products
- 15.2.5.3. SWOT Analysis
- 15.2.5.4. Recent Developments
- 15.2.5.5. Financials (Based on Availability)
- 15.2.6 GELITA AG
- 15.2.6.1. Overview
- 15.2.6.2. Products
- 15.2.6.3. SWOT Analysis
- 15.2.6.4. Recent Developments
- 15.2.6.5. Financials (Based on Availability)
- 15.2.7 Royal FrieslandCampina NV
- 15.2.7.1. Overview
- 15.2.7.2. Products
- 15.2.7.3. SWOT Analysis
- 15.2.7.4. Recent Developments
- 15.2.7.5. Financials (Based on Availability)
- 15.2.8 Kerry Group PLC
- 15.2.8.1. Overview
- 15.2.8.2. Products
- 15.2.8.3. SWOT Analysis
- 15.2.8.4. Recent Developments
- 15.2.8.5. Financials (Based on Availability)
- 15.2.9 Groupe LACTALIS
- 15.2.9.1. Overview
- 15.2.9.2. Products
- 15.2.9.3. SWOT Analysis
- 15.2.9.4. Recent Developments
- 15.2.9.5. Financials (Based on Availability)
- 15.2.10 Fonterra Co-operative Group Limited
- 15.2.10.1. Overview
- 15.2.10.2. Products
- 15.2.10.3. SWOT Analysis
- 15.2.10.4. Recent Developments
- 15.2.10.5. Financials (Based on Availability)
- 15.2.11 Hilmar Cheese Company Inc
- 15.2.11.1. Overview
- 15.2.11.2. Products
- 15.2.11.3. SWOT Analysis
- 15.2.11.4. Recent Developments
- 15.2.11.5. Financials (Based on Availability)
- 15.2.12 Arla Foods AmbA
- 15.2.12.1. Overview
- 15.2.12.2. Products
- 15.2.12.3. SWOT Analysis
- 15.2.12.4. Recent Developments
- 15.2.12.5. Financials (Based on Availability)
- 15.2.13 Agrial Enterprise
- 15.2.13.1. Overview
- 15.2.13.2. Products
- 15.2.13.3. SWOT Analysis
- 15.2.13.4. Recent Developments
- 15.2.13.5. Financials (Based on Availability)
- 15.2.1 Darling Ingredients Inc
List of Figures
- Figure 1: Global Animal Proteins Market Revenue Breakdown (Million, %) by Region 2024 & 2032
- Figure 2: Global Animal Proteins Market Volume Breakdown (K Tons, %) by Region 2024 & 2032
- Figure 3: North America Animal Proteins Market Revenue (Million), by Country 2024 & 2032
- Figure 4: North America Animal Proteins Market Volume (K Tons), by Country 2024 & 2032
- Figure 5: North America Animal Proteins Market Revenue Share (%), by Country 2024 & 2032
- Figure 6: North America Animal Proteins Market Volume Share (%), by Country 2024 & 2032
- Figure 7: Europe Animal Proteins Market Revenue (Million), by Country 2024 & 2032
- Figure 8: Europe Animal Proteins Market Volume (K Tons), by Country 2024 & 2032
- Figure 9: Europe Animal Proteins Market Revenue Share (%), by Country 2024 & 2032
- Figure 10: Europe Animal Proteins Market Volume Share (%), by Country 2024 & 2032
- Figure 11: Asia-Pacific Animal Proteins Market Revenue (Million), by Country 2024 & 2032
- Figure 12: Asia-Pacific Animal Proteins Market Volume (K Tons), by Country 2024 & 2032
- Figure 13: Asia-Pacific Animal Proteins Market Revenue Share (%), by Country 2024 & 2032
- Figure 14: Asia-Pacific Animal Proteins Market Volume Share (%), by Country 2024 & 2032
- Figure 15: Rest of the World Animal Proteins Market Revenue (Million), by Country 2024 & 2032
- Figure 16: Rest of the World Animal Proteins Market Volume (K Tons), by Country 2024 & 2032
- Figure 17: Rest of the World Animal Proteins Market Revenue Share (%), by Country 2024 & 2032
- Figure 18: Rest of the World Animal Proteins Market Volume Share (%), by Country 2024 & 2032
- Figure 19: North America Animal Proteins Market Revenue (Million), by Protein Type 2024 & 2032
- Figure 20: North America Animal Proteins Market Volume (K Tons), by Protein Type 2024 & 2032
- Figure 21: North America Animal Proteins Market Revenue Share (%), by Protein Type 2024 & 2032
- Figure 22: North America Animal Proteins Market Volume Share (%), by Protein Type 2024 & 2032
- Figure 23: North America Animal Proteins Market Revenue (Million), by End User 2024 & 2032
- Figure 24: North America Animal Proteins Market Volume (K Tons), by End User 2024 & 2032
- Figure 25: North America Animal Proteins Market Revenue Share (%), by End User 2024 & 2032
- Figure 26: North America Animal Proteins Market Volume Share (%), by End User 2024 & 2032
- Figure 27: North America Animal Proteins Market Revenue (Million), by Country 2024 & 2032
- Figure 28: North America Animal Proteins Market Volume (K Tons), by Country 2024 & 2032
- Figure 29: North America Animal Proteins Market Revenue Share (%), by Country 2024 & 2032
- Figure 30: North America Animal Proteins Market Volume Share (%), by Country 2024 & 2032
- Figure 31: South America Animal Proteins Market Revenue (Million), by Protein Type 2024 & 2032
- Figure 32: South America Animal Proteins Market Volume (K Tons), by Protein Type 2024 & 2032
- Figure 33: South America Animal Proteins Market Revenue Share (%), by Protein Type 2024 & 2032
- Figure 34: South America Animal Proteins Market Volume Share (%), by Protein Type 2024 & 2032
- Figure 35: South America Animal Proteins Market Revenue (Million), by End User 2024 & 2032
- Figure 36: South America Animal Proteins Market Volume (K Tons), by End User 2024 & 2032
- Figure 37: South America Animal Proteins Market Revenue Share (%), by End User 2024 & 2032
- Figure 38: South America Animal Proteins Market Volume Share (%), by End User 2024 & 2032
- Figure 39: South America Animal Proteins Market Revenue (Million), by Country 2024 & 2032
- Figure 40: South America Animal Proteins Market Volume (K Tons), by Country 2024 & 2032
- Figure 41: South America Animal Proteins Market Revenue Share (%), by Country 2024 & 2032
- Figure 42: South America Animal Proteins Market Volume Share (%), by Country 2024 & 2032
- Figure 43: Europe Animal Proteins Market Revenue (Million), by Protein Type 2024 & 2032
- Figure 44: Europe Animal Proteins Market Volume (K Tons), by Protein Type 2024 & 2032
- Figure 45: Europe Animal Proteins Market Revenue Share (%), by Protein Type 2024 & 2032
- Figure 46: Europe Animal Proteins Market Volume Share (%), by Protein Type 2024 & 2032
- Figure 47: Europe Animal Proteins Market Revenue (Million), by End User 2024 & 2032
- Figure 48: Europe Animal Proteins Market Volume (K Tons), by End User 2024 & 2032
- Figure 49: Europe Animal Proteins Market Revenue Share (%), by End User 2024 & 2032
- Figure 50: Europe Animal Proteins Market Volume Share (%), by End User 2024 & 2032
- Figure 51: Europe Animal Proteins Market Revenue (Million), by Country 2024 & 2032
- Figure 52: Europe Animal Proteins Market Volume (K Tons), by Country 2024 & 2032
- Figure 53: Europe Animal Proteins Market Revenue Share (%), by Country 2024 & 2032
- Figure 54: Europe Animal Proteins Market Volume Share (%), by Country 2024 & 2032
- Figure 55: Middle East & Africa Animal Proteins Market Revenue (Million), by Protein Type 2024 & 2032
- Figure 56: Middle East & Africa Animal Proteins Market Volume (K Tons), by Protein Type 2024 & 2032
- Figure 57: Middle East & Africa Animal Proteins Market Revenue Share (%), by Protein Type 2024 & 2032
- Figure 58: Middle East & Africa Animal Proteins Market Volume Share (%), by Protein Type 2024 & 2032
- Figure 59: Middle East & Africa Animal Proteins Market Revenue (Million), by End User 2024 & 2032
- Figure 60: Middle East & Africa Animal Proteins Market Volume (K Tons), by End User 2024 & 2032
- Figure 61: Middle East & Africa Animal Proteins Market Revenue Share (%), by End User 2024 & 2032
- Figure 62: Middle East & Africa Animal Proteins Market Volume Share (%), by End User 2024 & 2032
- Figure 63: Middle East & Africa Animal Proteins Market Revenue (Million), by Country 2024 & 2032
- Figure 64: Middle East & Africa Animal Proteins Market Volume (K Tons), by Country 2024 & 2032
- Figure 65: Middle East & Africa Animal Proteins Market Revenue Share (%), by Country 2024 & 2032
- Figure 66: Middle East & Africa Animal Proteins Market Volume Share (%), by Country 2024 & 2032
- Figure 67: Asia Pacific Animal Proteins Market Revenue (Million), by Protein Type 2024 & 2032
- Figure 68: Asia Pacific Animal Proteins Market Volume (K Tons), by Protein Type 2024 & 2032
- Figure 69: Asia Pacific Animal Proteins Market Revenue Share (%), by Protein Type 2024 & 2032
- Figure 70: Asia Pacific Animal Proteins Market Volume Share (%), by Protein Type 2024 & 2032
- Figure 71: Asia Pacific Animal Proteins Market Revenue (Million), by End User 2024 & 2032
- Figure 72: Asia Pacific Animal Proteins Market Volume (K Tons), by End User 2024 & 2032
- Figure 73: Asia Pacific Animal Proteins Market Revenue Share (%), by End User 2024 & 2032
- Figure 74: Asia Pacific Animal Proteins Market Volume Share (%), by End User 2024 & 2032
- Figure 75: Asia Pacific Animal Proteins Market Revenue (Million), by Country 2024 & 2032
- Figure 76: Asia Pacific Animal Proteins Market Volume (K Tons), by Country 2024 & 2032
- Figure 77: Asia Pacific Animal Proteins Market Revenue Share (%), by Country 2024 & 2032
- Figure 78: Asia Pacific Animal Proteins Market Volume Share (%), by Country 2024 & 2032
List of Tables
- Table 1: Global Animal Proteins Market Revenue Million Forecast, by Region 2019 & 2032
- Table 2: Global Animal Proteins Market Volume K Tons Forecast, by Region 2019 & 2032
- Table 3: Global Animal Proteins Market Revenue Million Forecast, by Protein Type 2019 & 2032
- Table 4: Global Animal Proteins Market Volume K Tons Forecast, by Protein Type 2019 & 2032
- Table 5: Global Animal Proteins Market Revenue Million Forecast, by End User 2019 & 2032
- Table 6: Global Animal Proteins Market Volume K Tons Forecast, by End User 2019 & 2032
- Table 7: Global Animal Proteins Market Revenue Million Forecast, by Region 2019 & 2032
- Table 8: Global Animal Proteins Market Volume K Tons Forecast, by Region 2019 & 2032
- Table 9: Global Animal Proteins Market Revenue Million Forecast, by Country 2019 & 2032
- Table 10: Global Animal Proteins Market Volume K Tons Forecast, by Country 2019 & 2032
- Table 11: United States Animal Proteins Market Revenue (Million) Forecast, by Application 2019 & 2032
- Table 12: United States Animal Proteins Market Volume (K Tons) Forecast, by Application 2019 & 2032
- Table 13: Canada Animal Proteins Market Revenue (Million) Forecast, by Application 2019 & 2032
- Table 14: Canada Animal Proteins Market Volume (K Tons) Forecast, by Application 2019 & 2032
- Table 15: Global Animal Proteins Market Revenue Million Forecast, by Country 2019 & 2032
- Table 16: Global Animal Proteins Market Volume K Tons Forecast, by Country 2019 & 2032
- Table 17: United Kingdom Animal Proteins Market Revenue (Million) Forecast, by Application 2019 & 2032
- Table 18: United Kingdom Animal Proteins Market Volume (K Tons) Forecast, by Application 2019 & 2032
- Table 19: Germany Animal Proteins Market Revenue (Million) Forecast, by Application 2019 & 2032
- Table 20: Germany Animal Proteins Market Volume (K Tons) Forecast, by Application 2019 & 2032
- Table 21: France Animal Proteins Market Revenue (Million) Forecast, by Application 2019 & 2032
- Table 22: France Animal Proteins Market Volume (K Tons) Forecast, by Application 2019 & 2032
- Table 23: Italy Animal Proteins Market Revenue (Million) Forecast, by Application 2019 & 2032
- Table 24: Italy Animal Proteins Market Volume (K Tons) Forecast, by Application 2019 & 2032
- Table 25: Global Animal Proteins Market Revenue Million Forecast, by Country 2019 & 2032
- Table 26: Global Animal Proteins Market Volume K Tons Forecast, by Country 2019 & 2032
- Table 27: China Animal Proteins Market Revenue (Million) Forecast, by Application 2019 & 2032
- Table 28: China Animal Proteins Market Volume (K Tons) Forecast, by Application 2019 & 2032
- Table 29: Japan Animal Proteins Market Revenue (Million) Forecast, by Application 2019 & 2032
- Table 30: Japan Animal Proteins Market Volume (K Tons) Forecast, by Application 2019 & 2032
- Table 31: India Animal Proteins Market Revenue (Million) Forecast, by Application 2019 & 2032
- Table 32: India Animal Proteins Market Volume (K Tons) Forecast, by Application 2019 & 2032
- Table 33: Global Animal Proteins Market Revenue Million Forecast, by Country 2019 & 2032
- Table 34: Global Animal Proteins Market Volume K Tons Forecast, by Country 2019 & 2032
- Table 35: Latin America Animal Proteins Market Revenue (Million) Forecast, by Application 2019 & 2032
- Table 36: Latin America Animal Proteins Market Volume (K Tons) Forecast, by Application 2019 & 2032
- Table 37: Middle East Animal Proteins Market Revenue (Million) Forecast, by Application 2019 & 2032
- Table 38: Middle East Animal Proteins Market Volume (K Tons) Forecast, by Application 2019 & 2032
- Table 39: and Africa Animal Proteins Market Revenue (Million) Forecast, by Application 2019 & 2032
- Table 40: and Africa Animal Proteins Market Volume (K Tons) Forecast, by Application 2019 & 2032
- Table 41: Global Animal Proteins Market Revenue Million Forecast, by Protein Type 2019 & 2032
- Table 42: Global Animal Proteins Market Volume K Tons Forecast, by Protein Type 2019 & 2032
- Table 43: Global Animal Proteins Market Revenue Million Forecast, by End User 2019 & 2032
- Table 44: Global Animal Proteins Market Volume K Tons Forecast, by End User 2019 & 2032
- Table 45: Global Animal Proteins Market Revenue Million Forecast, by Country 2019 & 2032
- Table 46: Global Animal Proteins Market Volume K Tons Forecast, by Country 2019 & 2032
- Table 47: United States Animal Proteins Market Revenue (Million) Forecast, by Application 2019 & 2032
- Table 48: United States Animal Proteins Market Volume (K Tons) Forecast, by Application 2019 & 2032
- Table 49: Canada Animal Proteins Market Revenue (Million) Forecast, by Application 2019 & 2032
- Table 50: Canada Animal Proteins Market Volume (K Tons) Forecast, by Application 2019 & 2032
- Table 51: Mexico Animal Proteins Market Revenue (Million) Forecast, by Application 2019 & 2032
- Table 52: Mexico Animal Proteins Market Volume (K Tons) Forecast, by Application 2019 & 2032
- Table 53: Global Animal Proteins Market Revenue Million Forecast, by Protein Type 2019 & 2032
- Table 54: Global Animal Proteins Market Volume K Tons Forecast, by Protein Type 2019 & 2032
- Table 55: Global Animal Proteins Market Revenue Million Forecast, by End User 2019 & 2032
- Table 56: Global Animal Proteins Market Volume K Tons Forecast, by End User 2019 & 2032
- Table 57: Global Animal Proteins Market Revenue Million Forecast, by Country 2019 & 2032
- Table 58: Global Animal Proteins Market Volume K Tons Forecast, by Country 2019 & 2032
- Table 59: Brazil Animal Proteins Market Revenue (Million) Forecast, by Application 2019 & 2032
- Table 60: Brazil Animal Proteins Market Volume (K Tons) Forecast, by Application 2019 & 2032
- Table 61: Argentina Animal Proteins Market Revenue (Million) Forecast, by Application 2019 & 2032
- Table 62: Argentina Animal Proteins Market Volume (K Tons) Forecast, by Application 2019 & 2032
- Table 63: Rest of South America Animal Proteins Market Revenue (Million) Forecast, by Application 2019 & 2032
- Table 64: Rest of South America Animal Proteins Market Volume (K Tons) Forecast, by Application 2019 & 2032
- Table 65: Global Animal Proteins Market Revenue Million Forecast, by Protein Type 2019 & 2032
- Table 66: Global Animal Proteins Market Volume K Tons Forecast, by Protein Type 2019 & 2032
- Table 67: Global Animal Proteins Market Revenue Million Forecast, by End User 2019 & 2032
- Table 68: Global Animal Proteins Market Volume K Tons Forecast, by End User 2019 & 2032
- Table 69: Global Animal Proteins Market Revenue Million Forecast, by Country 2019 & 2032
- Table 70: Global Animal Proteins Market Volume K Tons Forecast, by Country 2019 & 2032
- Table 71: United Kingdom Animal Proteins Market Revenue (Million) Forecast, by Application 2019 & 2032
- Table 72: United Kingdom Animal Proteins Market Volume (K Tons) Forecast, by Application 2019 & 2032
- Table 73: Germany Animal Proteins Market Revenue (Million) Forecast, by Application 2019 & 2032
- Table 74: Germany Animal Proteins Market Volume (K Tons) Forecast, by Application 2019 & 2032
- Table 75: France Animal Proteins Market Revenue (Million) Forecast, by Application 2019 & 2032
- Table 76: France Animal Proteins Market Volume (K Tons) Forecast, by Application 2019 & 2032
- Table 77: Italy Animal Proteins Market Revenue (Million) Forecast, by Application 2019 & 2032
- Table 78: Italy Animal Proteins Market Volume (K Tons) Forecast, by Application 2019 & 2032
- Table 79: Spain Animal Proteins Market Revenue (Million) Forecast, by Application 2019 & 2032
- Table 80: Spain Animal Proteins Market Volume (K Tons) Forecast, by Application 2019 & 2032
- Table 81: Russia Animal Proteins Market Revenue (Million) Forecast, by Application 2019 & 2032
- Table 82: Russia Animal Proteins Market Volume (K Tons) Forecast, by Application 2019 & 2032
- Table 83: Benelux Animal Proteins Market Revenue (Million) Forecast, by Application 2019 & 2032
- Table 84: Benelux Animal Proteins Market Volume (K Tons) Forecast, by Application 2019 & 2032
- Table 85: Nordics Animal Proteins Market Revenue (Million) Forecast, by Application 2019 & 2032
- Table 86: Nordics Animal Proteins Market Volume (K Tons) Forecast, by Application 2019 & 2032
- Table 87: Rest of Europe Animal Proteins Market Revenue (Million) Forecast, by Application 2019 & 2032
- Table 88: Rest of Europe Animal Proteins Market Volume (K Tons) Forecast, by Application 2019 & 2032
- Table 89: Global Animal Proteins Market Revenue Million Forecast, by Protein Type 2019 & 2032
- Table 90: Global Animal Proteins Market Volume K Tons Forecast, by Protein Type 2019 & 2032
- Table 91: Global Animal Proteins Market Revenue Million Forecast, by End User 2019 & 2032
- Table 92: Global Animal Proteins Market Volume K Tons Forecast, by End User 2019 & 2032
- Table 93: Global Animal Proteins Market Revenue Million Forecast, by Country 2019 & 2032
- Table 94: Global Animal Proteins Market Volume K Tons Forecast, by Country 2019 & 2032
- Table 95: Turkey Animal Proteins Market Revenue (Million) Forecast, by Application 2019 & 2032
- Table 96: Turkey Animal Proteins Market Volume (K Tons) Forecast, by Application 2019 & 2032
- Table 97: Israel Animal Proteins Market Revenue (Million) Forecast, by Application 2019 & 2032
- Table 98: Israel Animal Proteins Market Volume (K Tons) Forecast, by Application 2019 & 2032
- Table 99: GCC Animal Proteins Market Revenue (Million) Forecast, by Application 2019 & 2032
- Table 100: GCC Animal Proteins Market Volume (K Tons) Forecast, by Application 2019 & 2032
- Table 101: North Africa Animal Proteins Market Revenue (Million) Forecast, by Application 2019 & 2032
- Table 102: North Africa Animal Proteins Market Volume (K Tons) Forecast, by Application 2019 & 2032
- Table 103: South Africa Animal Proteins Market Revenue (Million) Forecast, by Application 2019 & 2032
- Table 104: South Africa Animal Proteins Market Volume (K Tons) Forecast, by Application 2019 & 2032
- Table 105: Rest of Middle East & Africa Animal Proteins Market Revenue (Million) Forecast, by Application 2019 & 2032
- Table 106: Rest of Middle East & Africa Animal Proteins Market Volume (K Tons) Forecast, by Application 2019 & 2032
- Table 107: Global Animal Proteins Market Revenue Million Forecast, by Protein Type 2019 & 2032
- Table 108: Global Animal Proteins Market Volume K Tons Forecast, by Protein Type 2019 & 2032
- Table 109: Global Animal Proteins Market Revenue Million Forecast, by End User 2019 & 2032
- Table 110: Global Animal Proteins Market Volume K Tons Forecast, by End User 2019 & 2032
- Table 111: Global Animal Proteins Market Revenue Million Forecast, by Country 2019 & 2032
- Table 112: Global Animal Proteins Market Volume K Tons Forecast, by Country 2019 & 2032
- Table 113: China Animal Proteins Market Revenue (Million) Forecast, by Application 2019 & 2032
- Table 114: China Animal Proteins Market Volume (K Tons) Forecast, by Application 2019 & 2032
- Table 115: India Animal Proteins Market Revenue (Million) Forecast, by Application 2019 & 2032
- Table 116: India Animal Proteins Market Volume (K Tons) Forecast, by Application 2019 & 2032
- Table 117: Japan Animal Proteins Market Revenue (Million) Forecast, by Application 2019 & 2032
- Table 118: Japan Animal Proteins Market Volume (K Tons) Forecast, by Application 2019 & 2032
- Table 119: South Korea Animal Proteins Market Revenue (Million) Forecast, by Application 2019 & 2032
- Table 120: South Korea Animal Proteins Market Volume (K Tons) Forecast, by Application 2019 & 2032
- Table 121: ASEAN Animal Proteins Market Revenue (Million) Forecast, by Application 2019 & 2032
- Table 122: ASEAN Animal Proteins Market Volume (K Tons) Forecast, by Application 2019 & 2032
- Table 123: Oceania Animal Proteins Market Revenue (Million) Forecast, by Application 2019 & 2032
- Table 124: Oceania Animal Proteins Market Volume (K Tons) Forecast, by Application 2019 & 2032
- Table 125: Rest of Asia Pacific Animal Proteins Market Revenue (Million) Forecast, by Application 2019 & 2032
- Table 126: Rest of Asia Pacific Animal Proteins Market Volume (K Tons) Forecast, by Application 2019 & 2032
Frequently Asked Questions
1. What is the projected Compound Annual Growth Rate (CAGR) of the Animal Proteins Market?
The projected CAGR is approximately 3.50%.
2. Which companies are prominent players in the Animal Proteins Market?
Key companies in the market include Darling Ingredients Inc, Nitta Gelatin Inc, Jellice Pioneer Private Limited, Savencia Fromage & Dair, Glanbia PLC, GELITA AG, Royal FrieslandCampina NV, Kerry Group PLC, Groupe LACTALIS, Fonterra Co-operative Group Limited, Hilmar Cheese Company Inc, Arla Foods AmbA, Agrial Enterprise.
3. What are the main segments of the Animal Proteins Market?
The market segments include Protein Type, End User.
4. Can you provide details about the market size?
The market size is estimated to be USD 47790 Million as of 2022.
5. What are some drivers contributing to market growth?
Increasing Demand For Convenience & Processed Food.
6. What are the notable trends driving market growth?
OTHER KEY INDUSTRY TRENDS COVERED IN THE REPORT.
7. Are there any restraints impacting market growth?
Increased Consumer Awareness On Side-Effects Of Chemical Additives.
8. Can you provide examples of recent developments in the market?
August 2022: Optimum Nutrition announced the launch of its new Gold Standard Protein Shake. The RTD is available in chocolate and vanilla flavors and is formulated with 24 grams of protein per serving.June 2022: Fonterra JV entered a joint venture with Tillamook country creamery association (TCCA) and a three-mile canyon farm in the United States to launch Pro-Optima TM, a grade A functional whey protein concentrate (fWPC).January 2022: Kerry, the largest taste and nutrition company, officially opened a new 21,500-square-foot state-of-the-art facility at its Jeddah location in Saudi Arabia. The company invested more than USD 90 million in the region, and this new facility is one of the most modern and efficient. It produces great-tasting, nutritious, and sustainable food ingredients, which will be distributed throughout the Middle East.
9. What pricing options are available for accessing the report?
Pricing options include single-user, multi-user, and enterprise licenses priced at USD 3800, USD 4500, and USD 5800 respectively.
10. Is the market size provided in terms of value or volume?
The market size is provided in terms of value, measured in Million and volume, measured in K Tons.
11. Are there any specific market keywords associated with the report?
Yes, the market keyword associated with the report is "Animal Proteins Market," which aids in identifying and referencing the specific market segment covered.
12. How do I determine which pricing option suits my needs best?
The pricing options vary based on user requirements and access needs. Individual users may opt for single-user licenses, while businesses requiring broader access may choose multi-user or enterprise licenses for cost-effective access to the report.
13. Are there any additional resources or data provided in the Animal Proteins Market report?
While the report offers comprehensive insights, it's advisable to review the specific contents or supplementary materials provided to ascertain if additional resources or data are available.
14. How can I stay updated on further developments or reports in the Animal Proteins Market?
To stay informed about further developments, trends, and reports in the Animal Proteins Market, consider subscribing to industry newsletters, following relevant companies and organizations, or regularly checking reputable industry news sources and publications.
Methodology
Step 1 - Identification of Relevant Samples Size from Population Database


Step 2 - Approaches for Defining Global Market Size (Value, Volume* & Price*)

Note*: In applicable scenarios
Step 3 - Data Sources
Primary Research
- Web Analytics
- Survey Reports
- Research Institute
- Latest Research Reports
- Opinion Leaders
Secondary Research
- Annual Reports
- White Paper
- Latest Press Release
- Industry Association
- Paid Database
- Investor Presentations

Step 4 - Data Triangulation
Involves using different sources of information in order to increase the validity of a study
These sources are likely to be stakeholders in a program - participants, other researchers, program staff, other community members, and so on.
Then we put all data in single framework & apply various statistical tools to find out the dynamic on the market.
During the analysis stage, feedback from the stakeholder groups would be compared to determine areas of agreement as well as areas of divergence


