
Key Insights
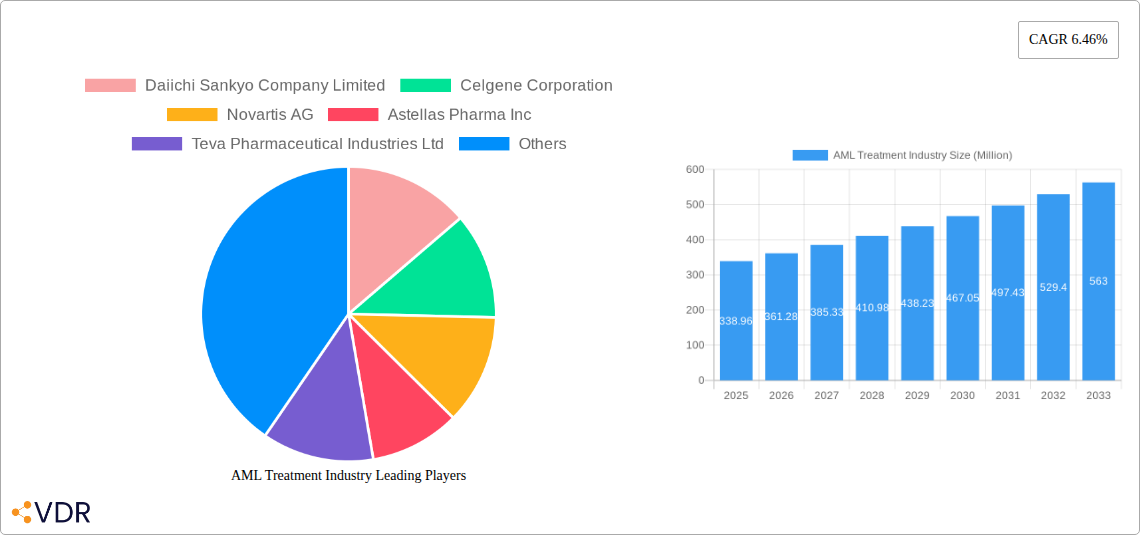
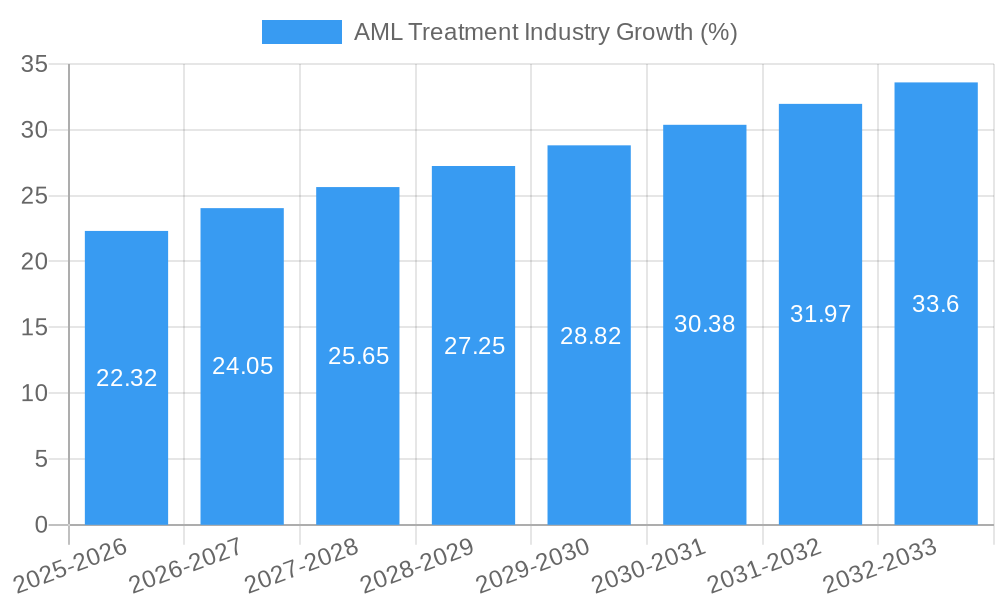
The Acute Myeloid Leukemia (AML) treatment market, valued at $338.96 million in 2025, is projected to experience robust growth, driven by increasing prevalence of AML, advancements in targeted therapies, and a growing elderly population susceptible to the disease. The Compound Annual Growth Rate (CAGR) of 6.46% from 2025 to 2033 indicates a significant expansion of the market over the forecast period. Key therapeutic segments include chemotherapy, targeted therapies, stem cell transplants, and other emerging therapies. Chemotherapy remains a cornerstone treatment, but the market is witnessing a surge in demand for targeted therapies offering improved efficacy and reduced side effects. Stem cell transplantation, while highly effective for certain patient populations, contributes significantly to the market value due to its high cost. The market's growth is further fueled by ongoing research and development into novel treatment modalities, including immunotherapies and gene therapies, promising enhanced treatment outcomes and improved patient survival rates. However, challenges such as high treatment costs, potential side effects associated with certain therapies, and disparities in access to advanced treatment across different geographical regions pose restraints on market expansion.
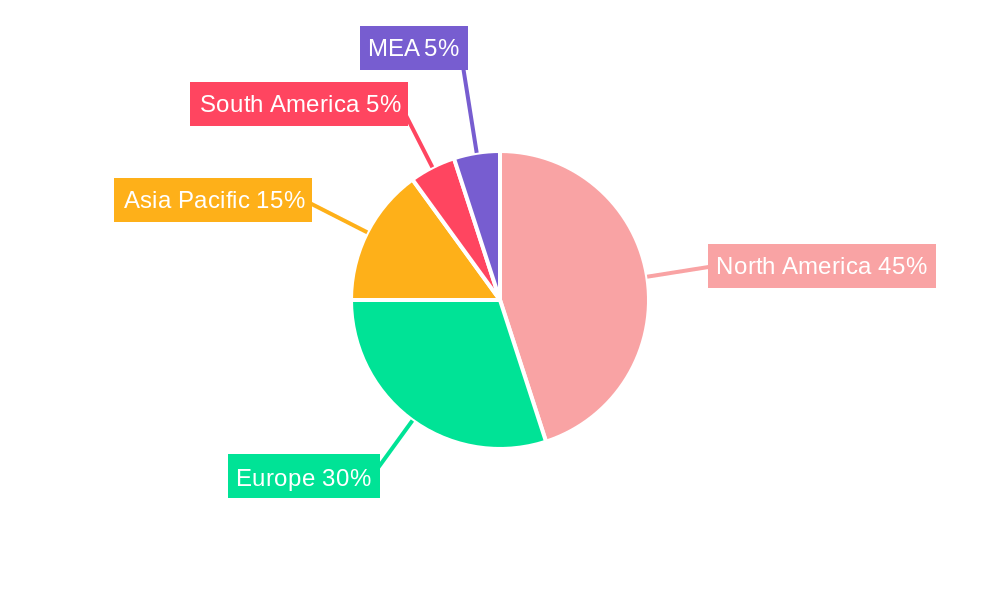
The geographical landscape of the AML treatment market reveals significant regional variations in market share. North America and Europe are currently the leading markets, driven by advanced healthcare infrastructure, high healthcare expenditure, and a relatively high prevalence of AML. The Asia Pacific region is anticipated to demonstrate significant growth in the coming years due to rising awareness of the disease, improving healthcare infrastructure, and increasing adoption of advanced treatment modalities. Companies such as Daiichi Sankyo, Celgene (now Bristol Myers Squibb), Novartis, Astellas Pharma, Teva Pharmaceuticals, AbbVie, Sun Pharmaceutical Industries, Fresenius, Viatris, and Pfizer are key players in the market, continually investing in research and development to enhance their product portfolios and solidify their market positions. Competition is intense, with companies focusing on developing innovative therapies and expanding their geographical reach to capture a larger market share. The future of the AML treatment market is promising, with continued advancements in treatment strategies and increased accessibility anticipated to fuel further market expansion.
AML Treatment Industry Market Report: 2019-2033
This comprehensive report provides an in-depth analysis of the AML (Acute Myeloid Leukemia) treatment market, encompassing market dynamics, growth trends, competitive landscape, and future outlook. The report covers the period 2019-2033, with a focus on the base year 2025 and forecast period 2025-2033. The total market size in 2025 is estimated at $XX Billion. This report serves as an invaluable resource for industry professionals, investors, and strategic decision-makers seeking to understand and capitalize on opportunities within this rapidly evolving sector. The parent market is the oncology treatment market, while the child market is specifically AML treatment.
AML Treatment Industry Market Dynamics & Structure
The AML treatment market is characterized by a moderately concentrated structure with key players holding significant market share. The market is driven by technological advancements in targeted therapies and immunotherapies, alongside increasing prevalence of AML globally. Stringent regulatory frameworks influence product approvals and market access. Competitive pressures are intense, driven by the introduction of novel therapies and the development of biosimilars. The market witnesses consistent M&A activity, reflecting strategic efforts by larger players to expand their portfolios and strengthen their market position.
- Market Concentration: Top 5 players hold approximately xx% of market share in 2025.
- Technological Innovation: Focus on targeted therapies, CAR T-cell therapies, and novel drug delivery systems.
- Regulatory Landscape: Stringent regulatory approvals in key markets (e.g., US, EU, Japan) impact market entry and growth.
- Competitive Landscape: Intense competition among established players and emerging biotech companies.
- M&A Activity: Average of xx M&A deals annually in the historical period (2019-2024), with deal values totaling $xx Billion.
- End-User Demographics: Growing geriatric population and increasing incidence of AML contribute to market expansion.
AML Treatment Industry Growth Trends & Insights
The AML treatment market exhibits robust growth, driven by factors such as rising prevalence of AML, expanding treatment options, and increased healthcare spending. The market experienced a CAGR of xx% during the historical period (2019-2024), and is projected to maintain a CAGR of xx% during the forecast period (2025-2033). This growth is propelled by the adoption of innovative therapies, improving patient outcomes, and a growing awareness of AML among healthcare professionals and patients. Technological advancements, such as the development of personalized medicine approaches, are further driving market expansion. Market penetration of novel therapies, like targeted therapies, is steadily increasing, contributing to significant revenue growth. Shifts in consumer behavior, including increased demand for convenient and effective treatment options, are impacting market dynamics.
Dominant Regions, Countries, or Segments in AML Treatment Industry
North America currently dominates the AML treatment market, accounting for approximately xx% of the global market share in 2025. This dominance is attributed to factors such as high healthcare expenditure, advanced healthcare infrastructure, early adoption of innovative therapies, and a strong regulatory framework supporting the introduction of new drugs. Europe follows as the second largest market, while Asia-Pacific is experiencing significant growth potential driven by increasing healthcare spending and rising awareness of AML.
- Therapy Segment: Chemotherapy remains the largest segment, driven by its widespread use and established efficacy. Targeted therapy is expected to witness substantial growth owing to its higher efficacy and reduced side effects.
- Key Regional Drivers:
- North America: High healthcare expenditure, advanced healthcare infrastructure, early adoption of innovative therapies.
- Europe: Well-established healthcare systems, robust regulatory frameworks, increasing focus on personalized medicine.
- Asia-Pacific: Rising healthcare expenditure, increasing awareness of AML, growing adoption of novel therapies.
AML Treatment Industry Product Landscape
The AML treatment market offers a wide range of therapeutic options, including chemotherapy, targeted therapies, stem cell transplantation, and other supportive care medications. Significant advancements are occurring in targeted therapies, with a focus on developing drugs that selectively target cancer cells while minimizing harm to healthy tissues. Immunotherapies are also emerging as promising treatment modalities, leveraging the body's own immune system to fight cancer cells. These therapies demonstrate improved efficacy and safety profiles compared to conventional chemotherapy.
Key Drivers, Barriers & Challenges in AML Treatment Industry
Key Drivers:
- Rising prevalence of AML globally.
- Technological advancements in targeted therapies and immunotherapies.
- Increased healthcare spending and investment in oncology research.
- Growing awareness and patient advocacy efforts.
Challenges and Restraints:
- High cost of treatment, creating accessibility challenges for patients.
- Development of drug resistance.
- Side effects associated with some therapies.
- Complex regulatory approval processes can slow market entry for novel therapeutics.
Emerging Opportunities in AML Treatment Industry
- Growing demand for personalized medicine approaches.
- Development of novel drug delivery systems.
- Expansion into emerging markets with unmet medical needs.
- Potential for combination therapies to improve treatment outcomes.
Growth Accelerators in the AML Treatment Industry
Continued innovation in targeted therapies, immunotherapies, and other novel treatment modalities will play a significant role in driving future market growth. Strategic partnerships between pharmaceutical companies and biotechnology firms are accelerating the development and commercialization of new AML treatments. The expansion of market access into emerging economies and the growing adoption of personalized medicine approaches are also contributing to long-term market expansion.
Key Players Shaping the AML Treatment Industry Market
- Daiichi Sankyo Company Limited
- Celgene Corporation (now part of Bristol Myers Squibb)
- Novartis AG
- Astellas Pharma Inc
- Teva Pharmaceutical Industries Ltd
- AbbVie Inc
- Sun Pharmaceutical Industries Ltd
- Fresenius SE & Co KGaA
- Viatris (Mylan NV)
- Pfizer Inc
Notable Milestones in AML Treatment Industry Sector
- May 2024: Nippon Shinyaku Co., Ltd. launched Vyxeos Combination in Japan for high-risk AML patients.
- March 2024: Novartis India secured a distribution partner for Asciminib, targeting CML.
In-Depth AML Treatment Industry Market Outlook
The AML treatment market is poised for sustained growth, fueled by ongoing research and development efforts, resulting in innovative therapies with improved efficacy and safety profiles. Strategic collaborations and partnerships among key players will further accelerate market expansion. The rising prevalence of AML, coupled with increasing healthcare spending globally, presents significant opportunities for market participants. The focus on personalized medicine and the development of targeted therapies will further shape the future of AML treatment and drive long-term market expansion.
AML Treatment Industry Segmentation
-
1. Therapy
-
1.1. Chemotherapy
- 1.1.1. Anthracycline Drugs
- 1.1.2. Alkylating Agents
- 1.1.3. Anti-metabolites
- 1.1.4. Other Chemotherapies
- 1.2. Targeted Therapy
- 1.3. Stem Cell Transplant
- 1.4. Other Therapies
-
1.1. Chemotherapy
-
2. Geography
- 2.1. China
- 2.2. Japan
- 2.3. India
- 2.4. Australia
- 2.5. South Korea
- 2.6. Rest of Asia-Pacific
AML Treatment Industry Segmentation By Geography
- 1. China
- 2. Japan
- 3. India
- 4. Australia
- 5. South Korea
- 6. Rest of Asia Pacific
AML Treatment Industry REPORT HIGHLIGHTS
| Aspects | Details |
|---|---|
| Study Period | 2019-2033 |
| Base Year | 2024 |
| Estimated Year | 2025 |
| Forecast Period | 2025-2033 |
| Historical Period | 2019-2024 |
| Growth Rate | CAGR of 6.46% from 2019-2033 |
| Segmentation |
|
Table of Contents
- 1. Introduction
- 1.1. Research Scope
- 1.2. Market Segmentation
- 1.3. Research Methodology
- 1.4. Definitions and Assumptions
- 2. Executive Summary
- 2.1. Introduction
- 3. Market Dynamics
- 3.1. Introduction
- 3.2. Market Drivers
- 3.2.1. High Incidence and Prevalence of Acute Myeloid Leukemia; Advancement in Pharmacology and Molecular Biology to Promote Drug Development
- 3.3. Market Restrains
- 3.3.1. Complications Related to Chemotherapy
- 3.4. Market Trends
- 3.4.1. The Chemotherapy Segment is Anticipated to Witness a Growth Over the Forecast Period
- 4. Market Factor Analysis
- 4.1. Porters Five Forces
- 4.2. Supply/Value Chain
- 4.3. PESTEL analysis
- 4.4. Market Entropy
- 4.5. Patent/Trademark Analysis
- 5. Global AML Treatment Industry Analysis, Insights and Forecast, 2019-2031
- 5.1. Market Analysis, Insights and Forecast - by Therapy
- 5.1.1. Chemotherapy
- 5.1.1.1. Anthracycline Drugs
- 5.1.1.2. Alkylating Agents
- 5.1.1.3. Anti-metabolites
- 5.1.1.4. Other Chemotherapies
- 5.1.2. Targeted Therapy
- 5.1.3. Stem Cell Transplant
- 5.1.4. Other Therapies
- 5.1.1. Chemotherapy
- 5.2. Market Analysis, Insights and Forecast - by Geography
- 5.2.1. China
- 5.2.2. Japan
- 5.2.3. India
- 5.2.4. Australia
- 5.2.5. South Korea
- 5.2.6. Rest of Asia-Pacific
- 5.3. Market Analysis, Insights and Forecast - by Region
- 5.3.1. China
- 5.3.2. Japan
- 5.3.3. India
- 5.3.4. Australia
- 5.3.5. South Korea
- 5.3.6. Rest of Asia Pacific
- 5.1. Market Analysis, Insights and Forecast - by Therapy
- 6. China AML Treatment Industry Analysis, Insights and Forecast, 2019-2031
- 6.1. Market Analysis, Insights and Forecast - by Therapy
- 6.1.1. Chemotherapy
- 6.1.1.1. Anthracycline Drugs
- 6.1.1.2. Alkylating Agents
- 6.1.1.3. Anti-metabolites
- 6.1.1.4. Other Chemotherapies
- 6.1.2. Targeted Therapy
- 6.1.3. Stem Cell Transplant
- 6.1.4. Other Therapies
- 6.1.1. Chemotherapy
- 6.2. Market Analysis, Insights and Forecast - by Geography
- 6.2.1. China
- 6.2.2. Japan
- 6.2.3. India
- 6.2.4. Australia
- 6.2.5. South Korea
- 6.2.6. Rest of Asia-Pacific
- 6.1. Market Analysis, Insights and Forecast - by Therapy
- 7. Japan AML Treatment Industry Analysis, Insights and Forecast, 2019-2031
- 7.1. Market Analysis, Insights and Forecast - by Therapy
- 7.1.1. Chemotherapy
- 7.1.1.1. Anthracycline Drugs
- 7.1.1.2. Alkylating Agents
- 7.1.1.3. Anti-metabolites
- 7.1.1.4. Other Chemotherapies
- 7.1.2. Targeted Therapy
- 7.1.3. Stem Cell Transplant
- 7.1.4. Other Therapies
- 7.1.1. Chemotherapy
- 7.2. Market Analysis, Insights and Forecast - by Geography
- 7.2.1. China
- 7.2.2. Japan
- 7.2.3. India
- 7.2.4. Australia
- 7.2.5. South Korea
- 7.2.6. Rest of Asia-Pacific
- 7.1. Market Analysis, Insights and Forecast - by Therapy
- 8. India AML Treatment Industry Analysis, Insights and Forecast, 2019-2031
- 8.1. Market Analysis, Insights and Forecast - by Therapy
- 8.1.1. Chemotherapy
- 8.1.1.1. Anthracycline Drugs
- 8.1.1.2. Alkylating Agents
- 8.1.1.3. Anti-metabolites
- 8.1.1.4. Other Chemotherapies
- 8.1.2. Targeted Therapy
- 8.1.3. Stem Cell Transplant
- 8.1.4. Other Therapies
- 8.1.1. Chemotherapy
- 8.2. Market Analysis, Insights and Forecast - by Geography
- 8.2.1. China
- 8.2.2. Japan
- 8.2.3. India
- 8.2.4. Australia
- 8.2.5. South Korea
- 8.2.6. Rest of Asia-Pacific
- 8.1. Market Analysis, Insights and Forecast - by Therapy
- 9. Australia AML Treatment Industry Analysis, Insights and Forecast, 2019-2031
- 9.1. Market Analysis, Insights and Forecast - by Therapy
- 9.1.1. Chemotherapy
- 9.1.1.1. Anthracycline Drugs
- 9.1.1.2. Alkylating Agents
- 9.1.1.3. Anti-metabolites
- 9.1.1.4. Other Chemotherapies
- 9.1.2. Targeted Therapy
- 9.1.3. Stem Cell Transplant
- 9.1.4. Other Therapies
- 9.1.1. Chemotherapy
- 9.2. Market Analysis, Insights and Forecast - by Geography
- 9.2.1. China
- 9.2.2. Japan
- 9.2.3. India
- 9.2.4. Australia
- 9.2.5. South Korea
- 9.2.6. Rest of Asia-Pacific
- 9.1. Market Analysis, Insights and Forecast - by Therapy
- 10. South Korea AML Treatment Industry Analysis, Insights and Forecast, 2019-2031
- 10.1. Market Analysis, Insights and Forecast - by Therapy
- 10.1.1. Chemotherapy
- 10.1.1.1. Anthracycline Drugs
- 10.1.1.2. Alkylating Agents
- 10.1.1.3. Anti-metabolites
- 10.1.1.4. Other Chemotherapies
- 10.1.2. Targeted Therapy
- 10.1.3. Stem Cell Transplant
- 10.1.4. Other Therapies
- 10.1.1. Chemotherapy
- 10.2. Market Analysis, Insights and Forecast - by Geography
- 10.2.1. China
- 10.2.2. Japan
- 10.2.3. India
- 10.2.4. Australia
- 10.2.5. South Korea
- 10.2.6. Rest of Asia-Pacific
- 10.1. Market Analysis, Insights and Forecast - by Therapy
- 11. Rest of Asia Pacific AML Treatment Industry Analysis, Insights and Forecast, 2019-2031
- 11.1. Market Analysis, Insights and Forecast - by Therapy
- 11.1.1. Chemotherapy
- 11.1.1.1. Anthracycline Drugs
- 11.1.1.2. Alkylating Agents
- 11.1.1.3. Anti-metabolites
- 11.1.1.4. Other Chemotherapies
- 11.1.2. Targeted Therapy
- 11.1.3. Stem Cell Transplant
- 11.1.4. Other Therapies
- 11.1.1. Chemotherapy
- 11.2. Market Analysis, Insights and Forecast - by Geography
- 11.2.1. China
- 11.2.2. Japan
- 11.2.3. India
- 11.2.4. Australia
- 11.2.5. South Korea
- 11.2.6. Rest of Asia-Pacific
- 11.1. Market Analysis, Insights and Forecast - by Therapy
- 12. North America AML Treatment Industry Analysis, Insights and Forecast, 2019-2031
- 12.1. Market Analysis, Insights and Forecast - By Country/Sub-region
- 12.1.1. undefined
- 13. Europe AML Treatment Industry Analysis, Insights and Forecast, 2019-2031
- 13.1. Market Analysis, Insights and Forecast - By Country/Sub-region
- 13.1.1. undefined
- 14. Asia Pacific AML Treatment Industry Analysis, Insights and Forecast, 2019-2031
- 14.1. Market Analysis, Insights and Forecast - By Country/Sub-region
- 14.1.1. undefined
- 15. South America AML Treatment Industry Analysis, Insights and Forecast, 2019-2031
- 15.1. Market Analysis, Insights and Forecast - By Country/Sub-region
- 15.1.1. undefined
- 16. North America AML Treatment Industry Analysis, Insights and Forecast, 2019-2031
- 16.1. Market Analysis, Insights and Forecast - By Country/Sub-region
- 16.1.1. undefined
- 17. MEA AML Treatment Industry Analysis, Insights and Forecast, 2019-2031
- 17.1. Market Analysis, Insights and Forecast - By Country/Sub-region
- 17.1.1. undefined
- 18. Competitive Analysis
- 18.1. Global Market Share Analysis 2024
- 18.2. Company Profiles
- 18.2.1 Daiichi Sankyo Company Limited
- 18.2.1.1. Overview
- 18.2.1.2. Products
- 18.2.1.3. SWOT Analysis
- 18.2.1.4. Recent Developments
- 18.2.1.5. Financials (Based on Availability)
- 18.2.2 Celgene Corporation
- 18.2.2.1. Overview
- 18.2.2.2. Products
- 18.2.2.3. SWOT Analysis
- 18.2.2.4. Recent Developments
- 18.2.2.5. Financials (Based on Availability)
- 18.2.3 Novartis AG
- 18.2.3.1. Overview
- 18.2.3.2. Products
- 18.2.3.3. SWOT Analysis
- 18.2.3.4. Recent Developments
- 18.2.3.5. Financials (Based on Availability)
- 18.2.4 Astellas Pharma Inc
- 18.2.4.1. Overview
- 18.2.4.2. Products
- 18.2.4.3. SWOT Analysis
- 18.2.4.4. Recent Developments
- 18.2.4.5. Financials (Based on Availability)
- 18.2.5 Teva Pharmaceutical Industries Ltd
- 18.2.5.1. Overview
- 18.2.5.2. Products
- 18.2.5.3. SWOT Analysis
- 18.2.5.4. Recent Developments
- 18.2.5.5. Financials (Based on Availability)
- 18.2.6 AbbVie Inc
- 18.2.6.1. Overview
- 18.2.6.2. Products
- 18.2.6.3. SWOT Analysis
- 18.2.6.4. Recent Developments
- 18.2.6.5. Financials (Based on Availability)
- 18.2.7 Sun Pharmaceutical Industries Ltd
- 18.2.7.1. Overview
- 18.2.7.2. Products
- 18.2.7.3. SWOT Analysis
- 18.2.7.4. Recent Developments
- 18.2.7.5. Financials (Based on Availability)
- 18.2.8 Fresenius SE & Co KGaA
- 18.2.8.1. Overview
- 18.2.8.2. Products
- 18.2.8.3. SWOT Analysis
- 18.2.8.4. Recent Developments
- 18.2.8.5. Financials (Based on Availability)
- 18.2.9 Viatris (Mylan NV)
- 18.2.9.1. Overview
- 18.2.9.2. Products
- 18.2.9.3. SWOT Analysis
- 18.2.9.4. Recent Developments
- 18.2.9.5. Financials (Based on Availability)
- 18.2.10 Pfizer Inc
- 18.2.10.1. Overview
- 18.2.10.2. Products
- 18.2.10.3. SWOT Analysis
- 18.2.10.4. Recent Developments
- 18.2.10.5. Financials (Based on Availability)
- 18.2.1 Daiichi Sankyo Company Limited
List of Figures
- Figure 1: Global AML Treatment Industry Revenue Breakdown (Million, %) by Region 2024 & 2032
- Figure 2: Global AML Treatment Industry Volume Breakdown (K Unit, %) by Region 2024 & 2032
- Figure 3: North America AML Treatment Industry Revenue (Million), by Country 2024 & 2032
- Figure 4: North America AML Treatment Industry Volume (K Unit), by Country 2024 & 2032
- Figure 5: North America AML Treatment Industry Revenue Share (%), by Country 2024 & 2032
- Figure 6: North America AML Treatment Industry Volume Share (%), by Country 2024 & 2032
- Figure 7: Europe AML Treatment Industry Revenue (Million), by Country 2024 & 2032
- Figure 8: Europe AML Treatment Industry Volume (K Unit), by Country 2024 & 2032
- Figure 9: Europe AML Treatment Industry Revenue Share (%), by Country 2024 & 2032
- Figure 10: Europe AML Treatment Industry Volume Share (%), by Country 2024 & 2032
- Figure 11: Asia Pacific AML Treatment Industry Revenue (Million), by Country 2024 & 2032
- Figure 12: Asia Pacific AML Treatment Industry Volume (K Unit), by Country 2024 & 2032
- Figure 13: Asia Pacific AML Treatment Industry Revenue Share (%), by Country 2024 & 2032
- Figure 14: Asia Pacific AML Treatment Industry Volume Share (%), by Country 2024 & 2032
- Figure 15: South America AML Treatment Industry Revenue (Million), by Country 2024 & 2032
- Figure 16: South America AML Treatment Industry Volume (K Unit), by Country 2024 & 2032
- Figure 17: South America AML Treatment Industry Revenue Share (%), by Country 2024 & 2032
- Figure 18: South America AML Treatment Industry Volume Share (%), by Country 2024 & 2032
- Figure 19: North America AML Treatment Industry Revenue (Million), by Country 2024 & 2032
- Figure 20: North America AML Treatment Industry Volume (K Unit), by Country 2024 & 2032
- Figure 21: North America AML Treatment Industry Revenue Share (%), by Country 2024 & 2032
- Figure 22: North America AML Treatment Industry Volume Share (%), by Country 2024 & 2032
- Figure 23: MEA AML Treatment Industry Revenue (Million), by Country 2024 & 2032
- Figure 24: MEA AML Treatment Industry Volume (K Unit), by Country 2024 & 2032
- Figure 25: MEA AML Treatment Industry Revenue Share (%), by Country 2024 & 2032
- Figure 26: MEA AML Treatment Industry Volume Share (%), by Country 2024 & 2032
- Figure 27: China AML Treatment Industry Revenue (Million), by Therapy 2024 & 2032
- Figure 28: China AML Treatment Industry Volume (K Unit), by Therapy 2024 & 2032
- Figure 29: China AML Treatment Industry Revenue Share (%), by Therapy 2024 & 2032
- Figure 30: China AML Treatment Industry Volume Share (%), by Therapy 2024 & 2032
- Figure 31: China AML Treatment Industry Revenue (Million), by Geography 2024 & 2032
- Figure 32: China AML Treatment Industry Volume (K Unit), by Geography 2024 & 2032
- Figure 33: China AML Treatment Industry Revenue Share (%), by Geography 2024 & 2032
- Figure 34: China AML Treatment Industry Volume Share (%), by Geography 2024 & 2032
- Figure 35: China AML Treatment Industry Revenue (Million), by Country 2024 & 2032
- Figure 36: China AML Treatment Industry Volume (K Unit), by Country 2024 & 2032
- Figure 37: China AML Treatment Industry Revenue Share (%), by Country 2024 & 2032
- Figure 38: China AML Treatment Industry Volume Share (%), by Country 2024 & 2032
- Figure 39: Japan AML Treatment Industry Revenue (Million), by Therapy 2024 & 2032
- Figure 40: Japan AML Treatment Industry Volume (K Unit), by Therapy 2024 & 2032
- Figure 41: Japan AML Treatment Industry Revenue Share (%), by Therapy 2024 & 2032
- Figure 42: Japan AML Treatment Industry Volume Share (%), by Therapy 2024 & 2032
- Figure 43: Japan AML Treatment Industry Revenue (Million), by Geography 2024 & 2032
- Figure 44: Japan AML Treatment Industry Volume (K Unit), by Geography 2024 & 2032
- Figure 45: Japan AML Treatment Industry Revenue Share (%), by Geography 2024 & 2032
- Figure 46: Japan AML Treatment Industry Volume Share (%), by Geography 2024 & 2032
- Figure 47: Japan AML Treatment Industry Revenue (Million), by Country 2024 & 2032
- Figure 48: Japan AML Treatment Industry Volume (K Unit), by Country 2024 & 2032
- Figure 49: Japan AML Treatment Industry Revenue Share (%), by Country 2024 & 2032
- Figure 50: Japan AML Treatment Industry Volume Share (%), by Country 2024 & 2032
- Figure 51: India AML Treatment Industry Revenue (Million), by Therapy 2024 & 2032
- Figure 52: India AML Treatment Industry Volume (K Unit), by Therapy 2024 & 2032
- Figure 53: India AML Treatment Industry Revenue Share (%), by Therapy 2024 & 2032
- Figure 54: India AML Treatment Industry Volume Share (%), by Therapy 2024 & 2032
- Figure 55: India AML Treatment Industry Revenue (Million), by Geography 2024 & 2032
- Figure 56: India AML Treatment Industry Volume (K Unit), by Geography 2024 & 2032
- Figure 57: India AML Treatment Industry Revenue Share (%), by Geography 2024 & 2032
- Figure 58: India AML Treatment Industry Volume Share (%), by Geography 2024 & 2032
- Figure 59: India AML Treatment Industry Revenue (Million), by Country 2024 & 2032
- Figure 60: India AML Treatment Industry Volume (K Unit), by Country 2024 & 2032
- Figure 61: India AML Treatment Industry Revenue Share (%), by Country 2024 & 2032
- Figure 62: India AML Treatment Industry Volume Share (%), by Country 2024 & 2032
- Figure 63: Australia AML Treatment Industry Revenue (Million), by Therapy 2024 & 2032
- Figure 64: Australia AML Treatment Industry Volume (K Unit), by Therapy 2024 & 2032
- Figure 65: Australia AML Treatment Industry Revenue Share (%), by Therapy 2024 & 2032
- Figure 66: Australia AML Treatment Industry Volume Share (%), by Therapy 2024 & 2032
- Figure 67: Australia AML Treatment Industry Revenue (Million), by Geography 2024 & 2032
- Figure 68: Australia AML Treatment Industry Volume (K Unit), by Geography 2024 & 2032
- Figure 69: Australia AML Treatment Industry Revenue Share (%), by Geography 2024 & 2032
- Figure 70: Australia AML Treatment Industry Volume Share (%), by Geography 2024 & 2032
- Figure 71: Australia AML Treatment Industry Revenue (Million), by Country 2024 & 2032
- Figure 72: Australia AML Treatment Industry Volume (K Unit), by Country 2024 & 2032
- Figure 73: Australia AML Treatment Industry Revenue Share (%), by Country 2024 & 2032
- Figure 74: Australia AML Treatment Industry Volume Share (%), by Country 2024 & 2032
- Figure 75: South Korea AML Treatment Industry Revenue (Million), by Therapy 2024 & 2032
- Figure 76: South Korea AML Treatment Industry Volume (K Unit), by Therapy 2024 & 2032
- Figure 77: South Korea AML Treatment Industry Revenue Share (%), by Therapy 2024 & 2032
- Figure 78: South Korea AML Treatment Industry Volume Share (%), by Therapy 2024 & 2032
- Figure 79: South Korea AML Treatment Industry Revenue (Million), by Geography 2024 & 2032
- Figure 80: South Korea AML Treatment Industry Volume (K Unit), by Geography 2024 & 2032
- Figure 81: South Korea AML Treatment Industry Revenue Share (%), by Geography 2024 & 2032
- Figure 82: South Korea AML Treatment Industry Volume Share (%), by Geography 2024 & 2032
- Figure 83: South Korea AML Treatment Industry Revenue (Million), by Country 2024 & 2032
- Figure 84: South Korea AML Treatment Industry Volume (K Unit), by Country 2024 & 2032
- Figure 85: South Korea AML Treatment Industry Revenue Share (%), by Country 2024 & 2032
- Figure 86: South Korea AML Treatment Industry Volume Share (%), by Country 2024 & 2032
- Figure 87: Rest of Asia Pacific AML Treatment Industry Revenue (Million), by Therapy 2024 & 2032
- Figure 88: Rest of Asia Pacific AML Treatment Industry Volume (K Unit), by Therapy 2024 & 2032
- Figure 89: Rest of Asia Pacific AML Treatment Industry Revenue Share (%), by Therapy 2024 & 2032
- Figure 90: Rest of Asia Pacific AML Treatment Industry Volume Share (%), by Therapy 2024 & 2032
- Figure 91: Rest of Asia Pacific AML Treatment Industry Revenue (Million), by Geography 2024 & 2032
- Figure 92: Rest of Asia Pacific AML Treatment Industry Volume (K Unit), by Geography 2024 & 2032
- Figure 93: Rest of Asia Pacific AML Treatment Industry Revenue Share (%), by Geography 2024 & 2032
- Figure 94: Rest of Asia Pacific AML Treatment Industry Volume Share (%), by Geography 2024 & 2032
- Figure 95: Rest of Asia Pacific AML Treatment Industry Revenue (Million), by Country 2024 & 2032
- Figure 96: Rest of Asia Pacific AML Treatment Industry Volume (K Unit), by Country 2024 & 2032
- Figure 97: Rest of Asia Pacific AML Treatment Industry Revenue Share (%), by Country 2024 & 2032
- Figure 98: Rest of Asia Pacific AML Treatment Industry Volume Share (%), by Country 2024 & 2032
List of Tables
- Table 1: Global AML Treatment Industry Revenue Million Forecast, by Region 2019 & 2032
- Table 2: Global AML Treatment Industry Volume K Unit Forecast, by Region 2019 & 2032
- Table 3: Global AML Treatment Industry Revenue Million Forecast, by Therapy 2019 & 2032
- Table 4: Global AML Treatment Industry Volume K Unit Forecast, by Therapy 2019 & 2032
- Table 5: Global AML Treatment Industry Revenue Million Forecast, by Geography 2019 & 2032
- Table 6: Global AML Treatment Industry Volume K Unit Forecast, by Geography 2019 & 2032
- Table 7: Global AML Treatment Industry Revenue Million Forecast, by Region 2019 & 2032
- Table 8: Global AML Treatment Industry Volume K Unit Forecast, by Region 2019 & 2032
- Table 9: Global AML Treatment Industry Revenue Million Forecast, by Country 2019 & 2032
- Table 10: Global AML Treatment Industry Volume K Unit Forecast, by Country 2019 & 2032
- Table 11: Global AML Treatment Industry Revenue Million Forecast, by Country 2019 & 2032
- Table 12: Global AML Treatment Industry Volume K Unit Forecast, by Country 2019 & 2032
- Table 13: Global AML Treatment Industry Revenue Million Forecast, by Country 2019 & 2032
- Table 14: Global AML Treatment Industry Volume K Unit Forecast, by Country 2019 & 2032
- Table 15: Global AML Treatment Industry Revenue Million Forecast, by Country 2019 & 2032
- Table 16: Global AML Treatment Industry Volume K Unit Forecast, by Country 2019 & 2032
- Table 17: Global AML Treatment Industry Revenue Million Forecast, by Country 2019 & 2032
- Table 18: Global AML Treatment Industry Volume K Unit Forecast, by Country 2019 & 2032
- Table 19: Global AML Treatment Industry Revenue Million Forecast, by Country 2019 & 2032
- Table 20: Global AML Treatment Industry Volume K Unit Forecast, by Country 2019 & 2032
- Table 21: Global AML Treatment Industry Revenue Million Forecast, by Therapy 2019 & 2032
- Table 22: Global AML Treatment Industry Volume K Unit Forecast, by Therapy 2019 & 2032
- Table 23: Global AML Treatment Industry Revenue Million Forecast, by Geography 2019 & 2032
- Table 24: Global AML Treatment Industry Volume K Unit Forecast, by Geography 2019 & 2032
- Table 25: Global AML Treatment Industry Revenue Million Forecast, by Country 2019 & 2032
- Table 26: Global AML Treatment Industry Volume K Unit Forecast, by Country 2019 & 2032
- Table 27: Global AML Treatment Industry Revenue Million Forecast, by Therapy 2019 & 2032
- Table 28: Global AML Treatment Industry Volume K Unit Forecast, by Therapy 2019 & 2032
- Table 29: Global AML Treatment Industry Revenue Million Forecast, by Geography 2019 & 2032
- Table 30: Global AML Treatment Industry Volume K Unit Forecast, by Geography 2019 & 2032
- Table 31: Global AML Treatment Industry Revenue Million Forecast, by Country 2019 & 2032
- Table 32: Global AML Treatment Industry Volume K Unit Forecast, by Country 2019 & 2032
- Table 33: Global AML Treatment Industry Revenue Million Forecast, by Therapy 2019 & 2032
- Table 34: Global AML Treatment Industry Volume K Unit Forecast, by Therapy 2019 & 2032
- Table 35: Global AML Treatment Industry Revenue Million Forecast, by Geography 2019 & 2032
- Table 36: Global AML Treatment Industry Volume K Unit Forecast, by Geography 2019 & 2032
- Table 37: Global AML Treatment Industry Revenue Million Forecast, by Country 2019 & 2032
- Table 38: Global AML Treatment Industry Volume K Unit Forecast, by Country 2019 & 2032
- Table 39: Global AML Treatment Industry Revenue Million Forecast, by Therapy 2019 & 2032
- Table 40: Global AML Treatment Industry Volume K Unit Forecast, by Therapy 2019 & 2032
- Table 41: Global AML Treatment Industry Revenue Million Forecast, by Geography 2019 & 2032
- Table 42: Global AML Treatment Industry Volume K Unit Forecast, by Geography 2019 & 2032
- Table 43: Global AML Treatment Industry Revenue Million Forecast, by Country 2019 & 2032
- Table 44: Global AML Treatment Industry Volume K Unit Forecast, by Country 2019 & 2032
- Table 45: Global AML Treatment Industry Revenue Million Forecast, by Therapy 2019 & 2032
- Table 46: Global AML Treatment Industry Volume K Unit Forecast, by Therapy 2019 & 2032
- Table 47: Global AML Treatment Industry Revenue Million Forecast, by Geography 2019 & 2032
- Table 48: Global AML Treatment Industry Volume K Unit Forecast, by Geography 2019 & 2032
- Table 49: Global AML Treatment Industry Revenue Million Forecast, by Country 2019 & 2032
- Table 50: Global AML Treatment Industry Volume K Unit Forecast, by Country 2019 & 2032
- Table 51: Global AML Treatment Industry Revenue Million Forecast, by Therapy 2019 & 2032
- Table 52: Global AML Treatment Industry Volume K Unit Forecast, by Therapy 2019 & 2032
- Table 53: Global AML Treatment Industry Revenue Million Forecast, by Geography 2019 & 2032
- Table 54: Global AML Treatment Industry Volume K Unit Forecast, by Geography 2019 & 2032
- Table 55: Global AML Treatment Industry Revenue Million Forecast, by Country 2019 & 2032
- Table 56: Global AML Treatment Industry Volume K Unit Forecast, by Country 2019 & 2032
Frequently Asked Questions
1. What is the projected Compound Annual Growth Rate (CAGR) of the AML Treatment Industry?
The projected CAGR is approximately 6.46%.
2. Which companies are prominent players in the AML Treatment Industry?
Key companies in the market include Daiichi Sankyo Company Limited, Celgene Corporation, Novartis AG, Astellas Pharma Inc, Teva Pharmaceutical Industries Ltd, AbbVie Inc, Sun Pharmaceutical Industries Ltd, Fresenius SE & Co KGaA, Viatris (Mylan NV), Pfizer Inc.
3. What are the main segments of the AML Treatment Industry?
The market segments include Therapy, Geography.
4. Can you provide details about the market size?
The market size is estimated to be USD 338.96 Million as of 2022.
5. What are some drivers contributing to market growth?
High Incidence and Prevalence of Acute Myeloid Leukemia; Advancement in Pharmacology and Molecular Biology to Promote Drug Development.
6. What are the notable trends driving market growth?
The Chemotherapy Segment is Anticipated to Witness a Growth Over the Forecast Period.
7. Are there any restraints impacting market growth?
Complications Related to Chemotherapy.
8. Can you provide examples of recent developments in the market?
May 2024 : Nippon Shinyaku Co., Ltd. introduced Vyxeos Combination, an I.V. injection (comprising Daunorubicin hydrochloride and cytarabine in a liposomal formulation), specifically targeting high-risk acute myeloid leukemia (AML) patients in Japan.
9. What pricing options are available for accessing the report?
Pricing options include single-user, multi-user, and enterprise licenses priced at USD 4750, USD 5250, and USD 8750 respectively.
10. Is the market size provided in terms of value or volume?
The market size is provided in terms of value, measured in Million and volume, measured in K Unit.
11. Are there any specific market keywords associated with the report?
Yes, the market keyword associated with the report is "AML Treatment Industry," which aids in identifying and referencing the specific market segment covered.
12. How do I determine which pricing option suits my needs best?
The pricing options vary based on user requirements and access needs. Individual users may opt for single-user licenses, while businesses requiring broader access may choose multi-user or enterprise licenses for cost-effective access to the report.
13. Are there any additional resources or data provided in the AML Treatment Industry report?
While the report offers comprehensive insights, it's advisable to review the specific contents or supplementary materials provided to ascertain if additional resources or data are available.
14. How can I stay updated on further developments or reports in the AML Treatment Industry?
To stay informed about further developments, trends, and reports in the AML Treatment Industry, consider subscribing to industry newsletters, following relevant companies and organizations, or regularly checking reputable industry news sources and publications.
Methodology
Step 1 - Identification of Relevant Samples Size from Population Database


Step 2 - Approaches for Defining Global Market Size (Value, Volume* & Price*)

Note*: In applicable scenarios
Step 3 - Data Sources
Primary Research
- Web Analytics
- Survey Reports
- Research Institute
- Latest Research Reports
- Opinion Leaders
Secondary Research
- Annual Reports
- White Paper
- Latest Press Release
- Industry Association
- Paid Database
- Investor Presentations

Step 4 - Data Triangulation
Involves using different sources of information in order to increase the validity of a study
These sources are likely to be stakeholders in a program - participants, other researchers, program staff, other community members, and so on.
Then we put all data in single framework & apply various statistical tools to find out the dynamic on the market.
During the analysis stage, feedback from the stakeholder groups would be compared to determine areas of agreement as well as areas of divergence


