
Key Insights
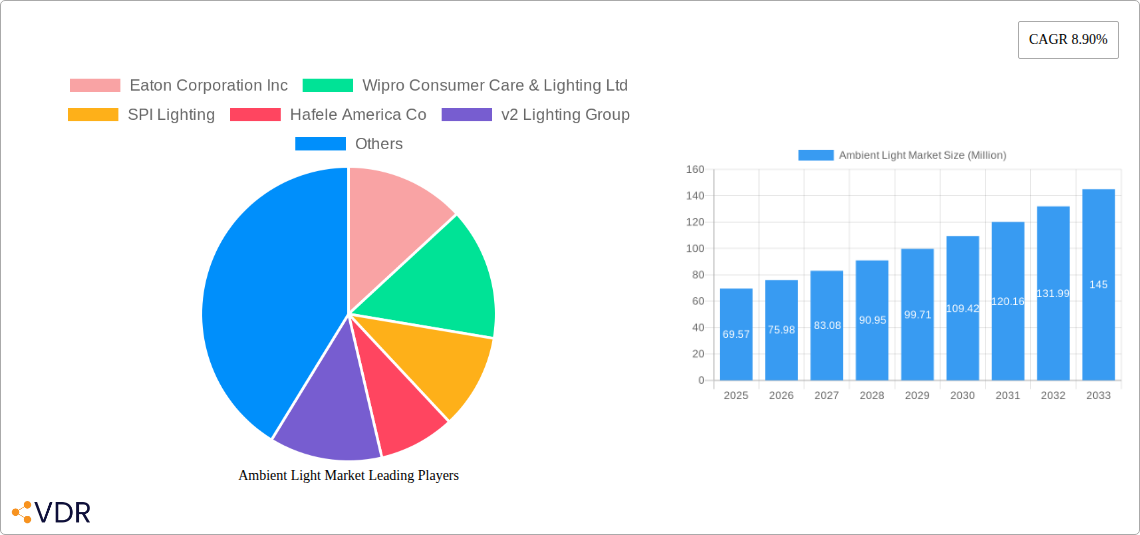
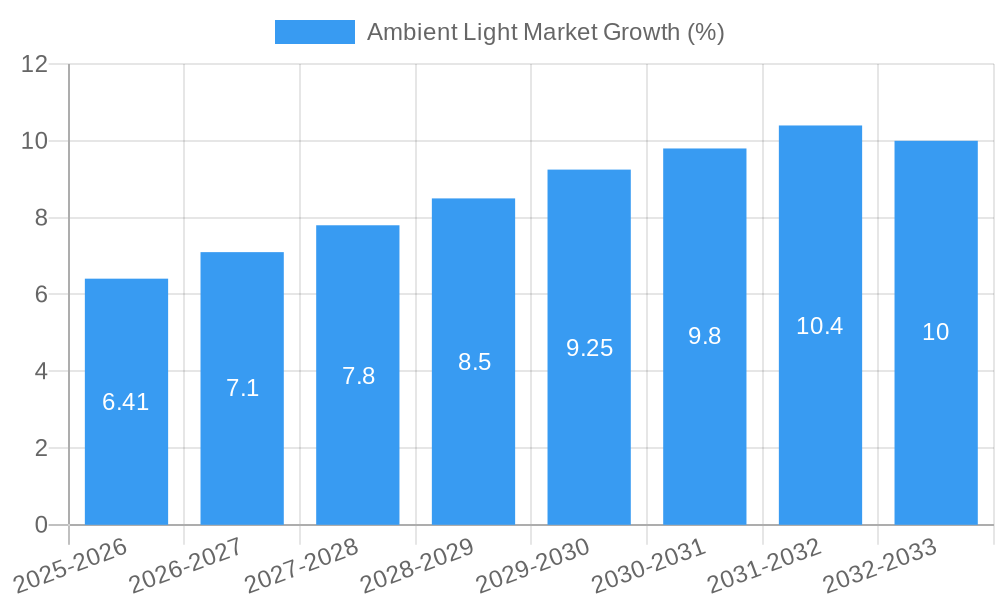
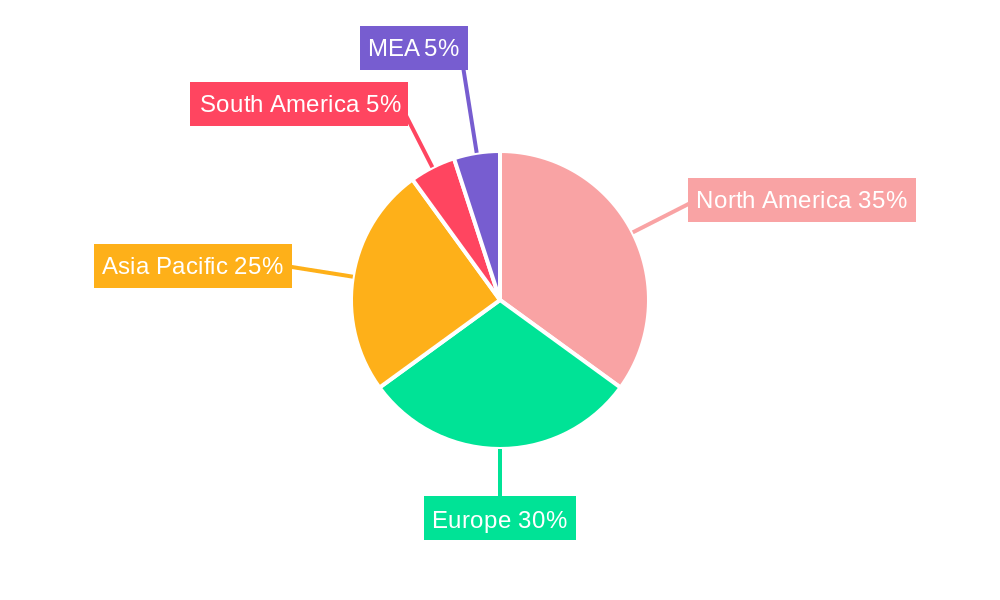
The global ambient lighting market, valued at $69.57 million in 2025, is poised for substantial growth, exhibiting a Compound Annual Growth Rate (CAGR) of 8.90% from 2025 to 2033. This expansion is driven by several key factors. Increasing consumer preference for aesthetically pleasing and energy-efficient lighting solutions fuels demand across residential and commercial sectors. The rising adoption of smart home technologies and the integration of ambient lighting into these systems further boosts market growth. Moreover, advancements in LED technology, offering superior energy efficiency and longer lifespans compared to traditional lighting options, are significantly contributing to market expansion. Government initiatives promoting energy conservation and sustainable practices also positively influence market dynamics. The market is segmented by type (surface-mounted, track, strip, suspended, recessed, and others), end-user (residential, automotive, hospitality & retail, healthcare, and industrial), and offering (lamps & luminaires, LEDs, and lighting controls). The LED segment holds a dominant position, owing to its cost-effectiveness and environmental benefits. North America and Europe currently represent major market shares, but the Asia-Pacific region is anticipated to witness rapid growth, driven by increasing urbanization and infrastructure development.
Competition within the ambient lighting market is intense, with established players like Eaton Corporation, Wipro, and Philips alongside emerging innovative companies. The market's future trajectory is shaped by several trends. The increasing demand for customizable lighting solutions, offering personalized ambiance and mood control, is prominent. Furthermore, the integration of ambient lighting with other smart home technologies, such as voice assistants and home automation systems, is expected to propel market growth. However, challenges exist, including the potential for high initial investment costs in smart lighting systems, which might hinder adoption in certain markets. Nevertheless, the long-term cost savings associated with energy efficiency and reduced maintenance are likely to outweigh these initial costs, ensuring continued market expansion in the coming years. The market's growth will be influenced by continuous technological innovations, evolving consumer preferences, and the increasing emphasis on sustainability.
Ambient Light Market: A Comprehensive Report (2019-2033)
This in-depth report provides a comprehensive analysis of the Ambient Light Market, encompassing market dynamics, growth trends, regional dominance, product landscapes, key players, and future outlooks. The study period covers 2019-2033, with a base year of 2025 and a forecast period of 2025-2033. The report delves into various market segments including By Type (Surface-mounted Light, Track Light, Strip Light, Suspended Light, Recessed Light, Other Types), By End User (Residential, Automotive, Hospitality and Retail, Healthcare, Other End Users (Industrial)), and By Offering (Lamps and Luminaires, Light Emitting Diode (LED): Lighting Controls). Key players such as Eaton Corporation Inc, Wipro Consumer Care & Lighting Ltd, and Samsung Electronics Co Ltd are analyzed, offering crucial insights for industry professionals. The market size is projected to reach xx Million units by 2033.
Ambient Light Market Market Dynamics & Structure
The Ambient Light Market exhibits a moderately concentrated structure, with key players holding significant market share. Technological innovation, particularly in LED lighting and smart controls, is a primary driver, alongside growing environmental concerns and energy efficiency mandates. Regulatory frameworks concerning energy consumption and lighting standards significantly influence market growth. Competitive product substitutes, such as OLED lighting, pose a challenge, while M&A activities consolidate market power. The residential sector currently dominates end-user demand.
- Market Concentration: Moderately concentrated, with top 5 players holding approximately xx% market share in 2024.
- Technological Innovation: Rapid advancements in LED technology, smart lighting controls, and energy-efficient solutions.
- Regulatory Framework: Stringent energy efficiency regulations and standards drive adoption of energy-saving ambient lighting solutions.
- Competitive Substitutes: OLED lighting and other emerging technologies pose a competitive threat.
- M&A Activity: Significant M&A activity observed in the period 2019-2024, with approximately xx deals recorded, leading to market consolidation.
- End-User Demographics: Shifting consumer preferences towards smart homes and personalized lighting experiences are impacting market demand.
Ambient Light Market Growth Trends & Insights
The Ambient Light Market has witnessed substantial growth over the historical period (2019-2024), fueled by increasing demand for energy-efficient lighting solutions and technological advancements in LED technology. The market size has expanded from xx Million units in 2019 to xx Million units in 2024, registering a CAGR of xx%. This growth is expected to continue, with a projected CAGR of xx% during the forecast period (2025-2033), reaching xx Million units by 2033. Technological disruptions, such as the integration of IoT and AI in lighting systems, are driving adoption rates. Consumer behavior shifts towards smart homes and customizable lighting options significantly contribute to market expansion.
Dominant Regions, Countries, or Segments in Ambient Light Market
North America and Europe currently dominate the Ambient Light Market, driven by high adoption rates of energy-efficient lighting and a strong presence of key players. However, Asia-Pacific is expected to witness the fastest growth rate in the coming years due to increasing infrastructure development and rising disposable incomes. Within segments, the LED lighting controls segment is experiencing rapid growth, while the residential and hospitality end-user segments are major contributors to market volume.
- Key Drivers:
- North America: Stringent energy efficiency regulations and high consumer spending on home improvement.
- Europe: Growing focus on sustainable solutions and increasing adoption of smart homes.
- Asia-Pacific: Rapid urbanization, infrastructure development, and rising disposable incomes.
- Dominant Segments:
- By Type: LED Recessed Lights and LED Strip Lights are the fastest growing segments.
- By End-User: Residential and Hospitality & Retail segments are currently the largest in terms of market share.
- By Offering: LED lighting controls are experiencing the highest growth rates.
Ambient Light Market Product Landscape
The Ambient Light Market showcases continuous product innovation, with a focus on enhancing energy efficiency, improving light quality, and integrating smart features. Products now offer tunable white light, color-changing capabilities, and seamless integration with smart home ecosystems. Key performance metrics include lumens per watt (efficacy), color rendering index (CRI), and lifespan. Unique selling propositions include personalized lighting experiences, ease of installation, and remote control capabilities. Advancements in LED technology are driving improvements in light quality, energy efficiency, and product lifespan.
Key Drivers, Barriers & Challenges in Ambient Light Market
Key Drivers:
- Increasing demand for energy-efficient lighting solutions due to rising energy costs and environmental concerns.
- Technological advancements in LED technology, including improved efficacy and color rendering.
- Growing adoption of smart home technologies and integration of lighting into smart home ecosystems.
- Government initiatives and regulations promoting energy efficiency in buildings.
Key Challenges & Restraints:
- High initial investment costs associated with switching to LED lighting.
- Competition from traditional lighting technologies.
- Supply chain disruptions impacting the availability of raw materials and components.
- Complexity of integrating smart lighting controls into existing infrastructure.
Emerging Opportunities in Ambient Light Market
- Growing demand for human-centric lighting solutions, emphasizing the positive effects of light on human health and well-being.
- Increasing use of ambient lighting in commercial and industrial settings to enhance productivity and employee satisfaction.
- Integration of ambient lighting with other smart home technologies, such as voice assistants and security systems.
- Expansion into new markets, such as developing countries with growing infrastructure development.
Growth Accelerators in the Ambient Light Market Industry
Technological breakthroughs in LED technology, such as miniaturization and improved efficiency, are key growth accelerators. Strategic partnerships between lighting manufacturers and technology companies facilitate innovation and market penetration. Market expansion strategies targeting emerging economies and untapped market segments offer significant growth potential.
Key Players Shaping the Ambient Light Market Market
- Eaton Corporation Inc
- Wipro Consumer Care & Lighting Ltd
- SPI Lighting
- Hafele America Co
- v2 Lighting Group
- Samsung Electronics Co Ltd
- Cree Inc
- Hubbell Incorporated
- GE Lighting
- Amerlux
- Bridgelux Inc
- Nulite Lighting
- Louis Poulsen
- Koninklijke Philips NV
- Acuity Brands Inc
- OSRAM Licht AG
- The Zumtobel Group
- Decon Lighting Pvt Ltd
Notable Milestones in Ambient Light Market Sector
- March 2022: Koninklijke Philips NV launched the Azurion system with an ambient experience and flexvision display, reducing patient anxiety in medical settings.
- February 2022: Samsung Electronics Co., Ltd. unveiled its micro LED display technology, offering superior picture quality and immersive viewing experiences.
In-Depth Ambient Light Market Market Outlook
The Ambient Light Market is poised for continued robust growth, driven by technological advancements, increasing consumer demand for energy-efficient and smart lighting solutions, and expansion into new market segments. Strategic opportunities lie in the development of human-centric lighting solutions and the integration of ambient lighting into broader smart home ecosystems. The market's future potential is significant, offering attractive returns for both established and emerging players.
Ambient Light Market Segmentation
-
1. Offering
- 1.1. Lamps and Luminaires
- 1.2. Lighting Controls
-
2. Type
- 2.1. Surface-mounted Light
- 2.2. Track Light
- 2.3. Strip Light
- 2.4. Suspended Light
- 2.5. Recessed Light
- 2.6. Other Types
-
3. End User
- 3.1. Residential
- 3.2. Automotive
- 3.3. Hospitality and Retail
- 3.4. Healthcare
- 3.5. Other End Users (Industrial)
Ambient Light Market Segmentation By Geography
-
1. North America
- 1.1. United States
- 1.2. Canada
-
2. Europe
- 2.1. United Kingdom
- 2.2. Germany
- 2.3. France
- 2.4. Rest of Europe
-
3. Asia Pacific
- 3.1. China
- 3.2. Japan
- 3.3. India
- 3.4. Rest of Asia Pacific
-
4. Rest of the World
- 4.1. Latin America
- 4.2. Middle East and Africa
Ambient Light Market REPORT HIGHLIGHTS
| Aspects | Details |
|---|---|
| Study Period | 2019-2033 |
| Base Year | 2024 |
| Estimated Year | 2025 |
| Forecast Period | 2025-2033 |
| Historical Period | 2019-2024 |
| Growth Rate | CAGR of 8.90% from 2019-2033 |
| Segmentation |
|
Table of Contents
- 1. Introduction
- 1.1. Research Scope
- 1.2. Market Segmentation
- 1.3. Research Methodology
- 1.4. Definitions and Assumptions
- 2. Executive Summary
- 2.1. Introduction
- 3. Market Dynamics
- 3.1. Introduction
- 3.2. Market Drivers
- 3.2.1. Increasing Need for Energy-efficient Lighting Solutions; Increasing Adoption of Smart Lighting; Modernization of Infrastructure
- 3.3. Market Restrains
- 3.3.1. Challenges Associated With LED Driver Failure and High Cost Associated With Installation
- 3.4. Market Trends
- 3.4.1. LEDs to Hold Significant Market Share
- 4. Market Factor Analysis
- 4.1. Porters Five Forces
- 4.2. Supply/Value Chain
- 4.3. PESTEL analysis
- 4.4. Market Entropy
- 4.5. Patent/Trademark Analysis
- 5. Global Ambient Light Market Analysis, Insights and Forecast, 2019-2031
- 5.1. Market Analysis, Insights and Forecast - by Offering
- 5.1.1. Lamps and Luminaires
- 5.1.2. Lighting Controls
- 5.2. Market Analysis, Insights and Forecast - by Type
- 5.2.1. Surface-mounted Light
- 5.2.2. Track Light
- 5.2.3. Strip Light
- 5.2.4. Suspended Light
- 5.2.5. Recessed Light
- 5.2.6. Other Types
- 5.3. Market Analysis, Insights and Forecast - by End User
- 5.3.1. Residential
- 5.3.2. Automotive
- 5.3.3. Hospitality and Retail
- 5.3.4. Healthcare
- 5.3.5. Other End Users (Industrial)
- 5.4. Market Analysis, Insights and Forecast - by Region
- 5.4.1. North America
- 5.4.2. Europe
- 5.4.3. Asia Pacific
- 5.4.4. Rest of the World
- 5.1. Market Analysis, Insights and Forecast - by Offering
- 6. North America Ambient Light Market Analysis, Insights and Forecast, 2019-2031
- 6.1. Market Analysis, Insights and Forecast - by Offering
- 6.1.1. Lamps and Luminaires
- 6.1.2. Lighting Controls
- 6.2. Market Analysis, Insights and Forecast - by Type
- 6.2.1. Surface-mounted Light
- 6.2.2. Track Light
- 6.2.3. Strip Light
- 6.2.4. Suspended Light
- 6.2.5. Recessed Light
- 6.2.6. Other Types
- 6.3. Market Analysis, Insights and Forecast - by End User
- 6.3.1. Residential
- 6.3.2. Automotive
- 6.3.3. Hospitality and Retail
- 6.3.4. Healthcare
- 6.3.5. Other End Users (Industrial)
- 6.1. Market Analysis, Insights and Forecast - by Offering
- 7. Europe Ambient Light Market Analysis, Insights and Forecast, 2019-2031
- 7.1. Market Analysis, Insights and Forecast - by Offering
- 7.1.1. Lamps and Luminaires
- 7.1.2. Lighting Controls
- 7.2. Market Analysis, Insights and Forecast - by Type
- 7.2.1. Surface-mounted Light
- 7.2.2. Track Light
- 7.2.3. Strip Light
- 7.2.4. Suspended Light
- 7.2.5. Recessed Light
- 7.2.6. Other Types
- 7.3. Market Analysis, Insights and Forecast - by End User
- 7.3.1. Residential
- 7.3.2. Automotive
- 7.3.3. Hospitality and Retail
- 7.3.4. Healthcare
- 7.3.5. Other End Users (Industrial)
- 7.1. Market Analysis, Insights and Forecast - by Offering
- 8. Asia Pacific Ambient Light Market Analysis, Insights and Forecast, 2019-2031
- 8.1. Market Analysis, Insights and Forecast - by Offering
- 8.1.1. Lamps and Luminaires
- 8.1.2. Lighting Controls
- 8.2. Market Analysis, Insights and Forecast - by Type
- 8.2.1. Surface-mounted Light
- 8.2.2. Track Light
- 8.2.3. Strip Light
- 8.2.4. Suspended Light
- 8.2.5. Recessed Light
- 8.2.6. Other Types
- 8.3. Market Analysis, Insights and Forecast - by End User
- 8.3.1. Residential
- 8.3.2. Automotive
- 8.3.3. Hospitality and Retail
- 8.3.4. Healthcare
- 8.3.5. Other End Users (Industrial)
- 8.1. Market Analysis, Insights and Forecast - by Offering
- 9. Rest of the World Ambient Light Market Analysis, Insights and Forecast, 2019-2031
- 9.1. Market Analysis, Insights and Forecast - by Offering
- 9.1.1. Lamps and Luminaires
- 9.1.2. Lighting Controls
- 9.2. Market Analysis, Insights and Forecast - by Type
- 9.2.1. Surface-mounted Light
- 9.2.2. Track Light
- 9.2.3. Strip Light
- 9.2.4. Suspended Light
- 9.2.5. Recessed Light
- 9.2.6. Other Types
- 9.3. Market Analysis, Insights and Forecast - by End User
- 9.3.1. Residential
- 9.3.2. Automotive
- 9.3.3. Hospitality and Retail
- 9.3.4. Healthcare
- 9.3.5. Other End Users (Industrial)
- 9.1. Market Analysis, Insights and Forecast - by Offering
- 10. North America Ambient Light Market Analysis, Insights and Forecast, 2019-2031
- 10.1. Market Analysis, Insights and Forecast - By Country/Sub-region
- 10.1.1 United States
- 10.1.2 Canada
- 10.1.3 Mexico
- 11. Europe Ambient Light Market Analysis, Insights and Forecast, 2019-2031
- 11.1. Market Analysis, Insights and Forecast - By Country/Sub-region
- 11.1.1 Germany
- 11.1.2 United Kingdom
- 11.1.3 France
- 11.1.4 Spain
- 11.1.5 Italy
- 11.1.6 Spain
- 11.1.7 Belgium
- 11.1.8 Netherland
- 11.1.9 Nordics
- 11.1.10 Rest of Europe
- 12. Asia Pacific Ambient Light Market Analysis, Insights and Forecast, 2019-2031
- 12.1. Market Analysis, Insights and Forecast - By Country/Sub-region
- 12.1.1 China
- 12.1.2 Japan
- 12.1.3 India
- 12.1.4 South Korea
- 12.1.5 Southeast Asia
- 12.1.6 Australia
- 12.1.7 Indonesia
- 12.1.8 Phillipes
- 12.1.9 Singapore
- 12.1.10 Thailandc
- 12.1.11 Rest of Asia Pacific
- 13. South America Ambient Light Market Analysis, Insights and Forecast, 2019-2031
- 13.1. Market Analysis, Insights and Forecast - By Country/Sub-region
- 13.1.1 Brazil
- 13.1.2 Argentina
- 13.1.3 Peru
- 13.1.4 Chile
- 13.1.5 Colombia
- 13.1.6 Ecuador
- 13.1.7 Venezuela
- 13.1.8 Rest of South America
- 14. North America Ambient Light Market Analysis, Insights and Forecast, 2019-2031
- 14.1. Market Analysis, Insights and Forecast - By Country/Sub-region
- 14.1.1 United States
- 14.1.2 Canada
- 14.1.3 Mexico
- 15. MEA Ambient Light Market Analysis, Insights and Forecast, 2019-2031
- 15.1. Market Analysis, Insights and Forecast - By Country/Sub-region
- 15.1.1 United Arab Emirates
- 15.1.2 Saudi Arabia
- 15.1.3 South Africa
- 15.1.4 Rest of Middle East and Africa
- 16. Competitive Analysis
- 16.1. Global Market Share Analysis 2024
- 16.2. Company Profiles
- 16.2.1 Eaton Corporation Inc
- 16.2.1.1. Overview
- 16.2.1.2. Products
- 16.2.1.3. SWOT Analysis
- 16.2.1.4. Recent Developments
- 16.2.1.5. Financials (Based on Availability)
- 16.2.2 Wipro Consumer Care & Lighting Ltd
- 16.2.2.1. Overview
- 16.2.2.2. Products
- 16.2.2.3. SWOT Analysis
- 16.2.2.4. Recent Developments
- 16.2.2.5. Financials (Based on Availability)
- 16.2.3 SPI Lighting
- 16.2.3.1. Overview
- 16.2.3.2. Products
- 16.2.3.3. SWOT Analysis
- 16.2.3.4. Recent Developments
- 16.2.3.5. Financials (Based on Availability)
- 16.2.4 Hafele America Co
- 16.2.4.1. Overview
- 16.2.4.2. Products
- 16.2.4.3. SWOT Analysis
- 16.2.4.4. Recent Developments
- 16.2.4.5. Financials (Based on Availability)
- 16.2.5 v2 Lighting Group
- 16.2.5.1. Overview
- 16.2.5.2. Products
- 16.2.5.3. SWOT Analysis
- 16.2.5.4. Recent Developments
- 16.2.5.5. Financials (Based on Availability)
- 16.2.6 Samsung Electronics Co Ltd
- 16.2.6.1. Overview
- 16.2.6.2. Products
- 16.2.6.3. SWOT Analysis
- 16.2.6.4. Recent Developments
- 16.2.6.5. Financials (Based on Availability)
- 16.2.7 Cree Inc
- 16.2.7.1. Overview
- 16.2.7.2. Products
- 16.2.7.3. SWOT Analysis
- 16.2.7.4. Recent Developments
- 16.2.7.5. Financials (Based on Availability)
- 16.2.8 Hubbell Incorporated
- 16.2.8.1. Overview
- 16.2.8.2. Products
- 16.2.8.3. SWOT Analysis
- 16.2.8.4. Recent Developments
- 16.2.8.5. Financials (Based on Availability)
- 16.2.9 GE Lighting
- 16.2.9.1. Overview
- 16.2.9.2. Products
- 16.2.9.3. SWOT Analysis
- 16.2.9.4. Recent Developments
- 16.2.9.5. Financials (Based on Availability)
- 16.2.10 Amerlux
- 16.2.10.1. Overview
- 16.2.10.2. Products
- 16.2.10.3. SWOT Analysis
- 16.2.10.4. Recent Developments
- 16.2.10.5. Financials (Based on Availability)
- 16.2.11 Bridgelux Inc
- 16.2.11.1. Overview
- 16.2.11.2. Products
- 16.2.11.3. SWOT Analysis
- 16.2.11.4. Recent Developments
- 16.2.11.5. Financials (Based on Availability)
- 16.2.12 Nulite Lighting
- 16.2.12.1. Overview
- 16.2.12.2. Products
- 16.2.12.3. SWOT Analysis
- 16.2.12.4. Recent Developments
- 16.2.12.5. Financials (Based on Availability)
- 16.2.13 Louis Poulsen
- 16.2.13.1. Overview
- 16.2.13.2. Products
- 16.2.13.3. SWOT Analysis
- 16.2.13.4. Recent Developments
- 16.2.13.5. Financials (Based on Availability)
- 16.2.14 Koninklijke Philips NV
- 16.2.14.1. Overview
- 16.2.14.2. Products
- 16.2.14.3. SWOT Analysis
- 16.2.14.4. Recent Developments
- 16.2.14.5. Financials (Based on Availability)
- 16.2.15 Acuity Brands Inc
- 16.2.15.1. Overview
- 16.2.15.2. Products
- 16.2.15.3. SWOT Analysis
- 16.2.15.4. Recent Developments
- 16.2.15.5. Financials (Based on Availability)
- 16.2.16 OSRAM Licht AG
- 16.2.16.1. Overview
- 16.2.16.2. Products
- 16.2.16.3. SWOT Analysis
- 16.2.16.4. Recent Developments
- 16.2.16.5. Financials (Based on Availability)
- 16.2.17 The Zumtobel Group
- 16.2.17.1. Overview
- 16.2.17.2. Products
- 16.2.17.3. SWOT Analysis
- 16.2.17.4. Recent Developments
- 16.2.17.5. Financials (Based on Availability)
- 16.2.18 Decon Lighting Pvt Ltd
- 16.2.18.1. Overview
- 16.2.18.2. Products
- 16.2.18.3. SWOT Analysis
- 16.2.18.4. Recent Developments
- 16.2.18.5. Financials (Based on Availability)
- 16.2.1 Eaton Corporation Inc
List of Figures
- Figure 1: Global Ambient Light Market Revenue Breakdown (Million, %) by Region 2024 & 2032
- Figure 2: Global Ambient Light Market Volume Breakdown (K Unit, %) by Region 2024 & 2032
- Figure 3: North America Ambient Light Market Revenue (Million), by Country 2024 & 2032
- Figure 4: North America Ambient Light Market Volume (K Unit), by Country 2024 & 2032
- Figure 5: North America Ambient Light Market Revenue Share (%), by Country 2024 & 2032
- Figure 6: North America Ambient Light Market Volume Share (%), by Country 2024 & 2032
- Figure 7: Europe Ambient Light Market Revenue (Million), by Country 2024 & 2032
- Figure 8: Europe Ambient Light Market Volume (K Unit), by Country 2024 & 2032
- Figure 9: Europe Ambient Light Market Revenue Share (%), by Country 2024 & 2032
- Figure 10: Europe Ambient Light Market Volume Share (%), by Country 2024 & 2032
- Figure 11: Asia Pacific Ambient Light Market Revenue (Million), by Country 2024 & 2032
- Figure 12: Asia Pacific Ambient Light Market Volume (K Unit), by Country 2024 & 2032
- Figure 13: Asia Pacific Ambient Light Market Revenue Share (%), by Country 2024 & 2032
- Figure 14: Asia Pacific Ambient Light Market Volume Share (%), by Country 2024 & 2032
- Figure 15: South America Ambient Light Market Revenue (Million), by Country 2024 & 2032
- Figure 16: South America Ambient Light Market Volume (K Unit), by Country 2024 & 2032
- Figure 17: South America Ambient Light Market Revenue Share (%), by Country 2024 & 2032
- Figure 18: South America Ambient Light Market Volume Share (%), by Country 2024 & 2032
- Figure 19: North America Ambient Light Market Revenue (Million), by Country 2024 & 2032
- Figure 20: North America Ambient Light Market Volume (K Unit), by Country 2024 & 2032
- Figure 21: North America Ambient Light Market Revenue Share (%), by Country 2024 & 2032
- Figure 22: North America Ambient Light Market Volume Share (%), by Country 2024 & 2032
- Figure 23: MEA Ambient Light Market Revenue (Million), by Country 2024 & 2032
- Figure 24: MEA Ambient Light Market Volume (K Unit), by Country 2024 & 2032
- Figure 25: MEA Ambient Light Market Revenue Share (%), by Country 2024 & 2032
- Figure 26: MEA Ambient Light Market Volume Share (%), by Country 2024 & 2032
- Figure 27: North America Ambient Light Market Revenue (Million), by Offering 2024 & 2032
- Figure 28: North America Ambient Light Market Volume (K Unit), by Offering 2024 & 2032
- Figure 29: North America Ambient Light Market Revenue Share (%), by Offering 2024 & 2032
- Figure 30: North America Ambient Light Market Volume Share (%), by Offering 2024 & 2032
- Figure 31: North America Ambient Light Market Revenue (Million), by Type 2024 & 2032
- Figure 32: North America Ambient Light Market Volume (K Unit), by Type 2024 & 2032
- Figure 33: North America Ambient Light Market Revenue Share (%), by Type 2024 & 2032
- Figure 34: North America Ambient Light Market Volume Share (%), by Type 2024 & 2032
- Figure 35: North America Ambient Light Market Revenue (Million), by End User 2024 & 2032
- Figure 36: North America Ambient Light Market Volume (K Unit), by End User 2024 & 2032
- Figure 37: North America Ambient Light Market Revenue Share (%), by End User 2024 & 2032
- Figure 38: North America Ambient Light Market Volume Share (%), by End User 2024 & 2032
- Figure 39: North America Ambient Light Market Revenue (Million), by Country 2024 & 2032
- Figure 40: North America Ambient Light Market Volume (K Unit), by Country 2024 & 2032
- Figure 41: North America Ambient Light Market Revenue Share (%), by Country 2024 & 2032
- Figure 42: North America Ambient Light Market Volume Share (%), by Country 2024 & 2032
- Figure 43: Europe Ambient Light Market Revenue (Million), by Offering 2024 & 2032
- Figure 44: Europe Ambient Light Market Volume (K Unit), by Offering 2024 & 2032
- Figure 45: Europe Ambient Light Market Revenue Share (%), by Offering 2024 & 2032
- Figure 46: Europe Ambient Light Market Volume Share (%), by Offering 2024 & 2032
- Figure 47: Europe Ambient Light Market Revenue (Million), by Type 2024 & 2032
- Figure 48: Europe Ambient Light Market Volume (K Unit), by Type 2024 & 2032
- Figure 49: Europe Ambient Light Market Revenue Share (%), by Type 2024 & 2032
- Figure 50: Europe Ambient Light Market Volume Share (%), by Type 2024 & 2032
- Figure 51: Europe Ambient Light Market Revenue (Million), by End User 2024 & 2032
- Figure 52: Europe Ambient Light Market Volume (K Unit), by End User 2024 & 2032
- Figure 53: Europe Ambient Light Market Revenue Share (%), by End User 2024 & 2032
- Figure 54: Europe Ambient Light Market Volume Share (%), by End User 2024 & 2032
- Figure 55: Europe Ambient Light Market Revenue (Million), by Country 2024 & 2032
- Figure 56: Europe Ambient Light Market Volume (K Unit), by Country 2024 & 2032
- Figure 57: Europe Ambient Light Market Revenue Share (%), by Country 2024 & 2032
- Figure 58: Europe Ambient Light Market Volume Share (%), by Country 2024 & 2032
- Figure 59: Asia Pacific Ambient Light Market Revenue (Million), by Offering 2024 & 2032
- Figure 60: Asia Pacific Ambient Light Market Volume (K Unit), by Offering 2024 & 2032
- Figure 61: Asia Pacific Ambient Light Market Revenue Share (%), by Offering 2024 & 2032
- Figure 62: Asia Pacific Ambient Light Market Volume Share (%), by Offering 2024 & 2032
- Figure 63: Asia Pacific Ambient Light Market Revenue (Million), by Type 2024 & 2032
- Figure 64: Asia Pacific Ambient Light Market Volume (K Unit), by Type 2024 & 2032
- Figure 65: Asia Pacific Ambient Light Market Revenue Share (%), by Type 2024 & 2032
- Figure 66: Asia Pacific Ambient Light Market Volume Share (%), by Type 2024 & 2032
- Figure 67: Asia Pacific Ambient Light Market Revenue (Million), by End User 2024 & 2032
- Figure 68: Asia Pacific Ambient Light Market Volume (K Unit), by End User 2024 & 2032
- Figure 69: Asia Pacific Ambient Light Market Revenue Share (%), by End User 2024 & 2032
- Figure 70: Asia Pacific Ambient Light Market Volume Share (%), by End User 2024 & 2032
- Figure 71: Asia Pacific Ambient Light Market Revenue (Million), by Country 2024 & 2032
- Figure 72: Asia Pacific Ambient Light Market Volume (K Unit), by Country 2024 & 2032
- Figure 73: Asia Pacific Ambient Light Market Revenue Share (%), by Country 2024 & 2032
- Figure 74: Asia Pacific Ambient Light Market Volume Share (%), by Country 2024 & 2032
- Figure 75: Rest of the World Ambient Light Market Revenue (Million), by Offering 2024 & 2032
- Figure 76: Rest of the World Ambient Light Market Volume (K Unit), by Offering 2024 & 2032
- Figure 77: Rest of the World Ambient Light Market Revenue Share (%), by Offering 2024 & 2032
- Figure 78: Rest of the World Ambient Light Market Volume Share (%), by Offering 2024 & 2032
- Figure 79: Rest of the World Ambient Light Market Revenue (Million), by Type 2024 & 2032
- Figure 80: Rest of the World Ambient Light Market Volume (K Unit), by Type 2024 & 2032
- Figure 81: Rest of the World Ambient Light Market Revenue Share (%), by Type 2024 & 2032
- Figure 82: Rest of the World Ambient Light Market Volume Share (%), by Type 2024 & 2032
- Figure 83: Rest of the World Ambient Light Market Revenue (Million), by End User 2024 & 2032
- Figure 84: Rest of the World Ambient Light Market Volume (K Unit), by End User 2024 & 2032
- Figure 85: Rest of the World Ambient Light Market Revenue Share (%), by End User 2024 & 2032
- Figure 86: Rest of the World Ambient Light Market Volume Share (%), by End User 2024 & 2032
- Figure 87: Rest of the World Ambient Light Market Revenue (Million), by Country 2024 & 2032
- Figure 88: Rest of the World Ambient Light Market Volume (K Unit), by Country 2024 & 2032
- Figure 89: Rest of the World Ambient Light Market Revenue Share (%), by Country 2024 & 2032
- Figure 90: Rest of the World Ambient Light Market Volume Share (%), by Country 2024 & 2032
List of Tables
- Table 1: Global Ambient Light Market Revenue Million Forecast, by Region 2019 & 2032
- Table 2: Global Ambient Light Market Volume K Unit Forecast, by Region 2019 & 2032
- Table 3: Global Ambient Light Market Revenue Million Forecast, by Offering 2019 & 2032
- Table 4: Global Ambient Light Market Volume K Unit Forecast, by Offering 2019 & 2032
- Table 5: Global Ambient Light Market Revenue Million Forecast, by Type 2019 & 2032
- Table 6: Global Ambient Light Market Volume K Unit Forecast, by Type 2019 & 2032
- Table 7: Global Ambient Light Market Revenue Million Forecast, by End User 2019 & 2032
- Table 8: Global Ambient Light Market Volume K Unit Forecast, by End User 2019 & 2032
- Table 9: Global Ambient Light Market Revenue Million Forecast, by Region 2019 & 2032
- Table 10: Global Ambient Light Market Volume K Unit Forecast, by Region 2019 & 2032
- Table 11: Global Ambient Light Market Revenue Million Forecast, by Country 2019 & 2032
- Table 12: Global Ambient Light Market Volume K Unit Forecast, by Country 2019 & 2032
- Table 13: United States Ambient Light Market Revenue (Million) Forecast, by Application 2019 & 2032
- Table 14: United States Ambient Light Market Volume (K Unit) Forecast, by Application 2019 & 2032
- Table 15: Canada Ambient Light Market Revenue (Million) Forecast, by Application 2019 & 2032
- Table 16: Canada Ambient Light Market Volume (K Unit) Forecast, by Application 2019 & 2032
- Table 17: Mexico Ambient Light Market Revenue (Million) Forecast, by Application 2019 & 2032
- Table 18: Mexico Ambient Light Market Volume (K Unit) Forecast, by Application 2019 & 2032
- Table 19: Global Ambient Light Market Revenue Million Forecast, by Country 2019 & 2032
- Table 20: Global Ambient Light Market Volume K Unit Forecast, by Country 2019 & 2032
- Table 21: Germany Ambient Light Market Revenue (Million) Forecast, by Application 2019 & 2032
- Table 22: Germany Ambient Light Market Volume (K Unit) Forecast, by Application 2019 & 2032
- Table 23: United Kingdom Ambient Light Market Revenue (Million) Forecast, by Application 2019 & 2032
- Table 24: United Kingdom Ambient Light Market Volume (K Unit) Forecast, by Application 2019 & 2032
- Table 25: France Ambient Light Market Revenue (Million) Forecast, by Application 2019 & 2032
- Table 26: France Ambient Light Market Volume (K Unit) Forecast, by Application 2019 & 2032
- Table 27: Spain Ambient Light Market Revenue (Million) Forecast, by Application 2019 & 2032
- Table 28: Spain Ambient Light Market Volume (K Unit) Forecast, by Application 2019 & 2032
- Table 29: Italy Ambient Light Market Revenue (Million) Forecast, by Application 2019 & 2032
- Table 30: Italy Ambient Light Market Volume (K Unit) Forecast, by Application 2019 & 2032
- Table 31: Spain Ambient Light Market Revenue (Million) Forecast, by Application 2019 & 2032
- Table 32: Spain Ambient Light Market Volume (K Unit) Forecast, by Application 2019 & 2032
- Table 33: Belgium Ambient Light Market Revenue (Million) Forecast, by Application 2019 & 2032
- Table 34: Belgium Ambient Light Market Volume (K Unit) Forecast, by Application 2019 & 2032
- Table 35: Netherland Ambient Light Market Revenue (Million) Forecast, by Application 2019 & 2032
- Table 36: Netherland Ambient Light Market Volume (K Unit) Forecast, by Application 2019 & 2032
- Table 37: Nordics Ambient Light Market Revenue (Million) Forecast, by Application 2019 & 2032
- Table 38: Nordics Ambient Light Market Volume (K Unit) Forecast, by Application 2019 & 2032
- Table 39: Rest of Europe Ambient Light Market Revenue (Million) Forecast, by Application 2019 & 2032
- Table 40: Rest of Europe Ambient Light Market Volume (K Unit) Forecast, by Application 2019 & 2032
- Table 41: Global Ambient Light Market Revenue Million Forecast, by Country 2019 & 2032
- Table 42: Global Ambient Light Market Volume K Unit Forecast, by Country 2019 & 2032
- Table 43: China Ambient Light Market Revenue (Million) Forecast, by Application 2019 & 2032
- Table 44: China Ambient Light Market Volume (K Unit) Forecast, by Application 2019 & 2032
- Table 45: Japan Ambient Light Market Revenue (Million) Forecast, by Application 2019 & 2032
- Table 46: Japan Ambient Light Market Volume (K Unit) Forecast, by Application 2019 & 2032
- Table 47: India Ambient Light Market Revenue (Million) Forecast, by Application 2019 & 2032
- Table 48: India Ambient Light Market Volume (K Unit) Forecast, by Application 2019 & 2032
- Table 49: South Korea Ambient Light Market Revenue (Million) Forecast, by Application 2019 & 2032
- Table 50: South Korea Ambient Light Market Volume (K Unit) Forecast, by Application 2019 & 2032
- Table 51: Southeast Asia Ambient Light Market Revenue (Million) Forecast, by Application 2019 & 2032
- Table 52: Southeast Asia Ambient Light Market Volume (K Unit) Forecast, by Application 2019 & 2032
- Table 53: Australia Ambient Light Market Revenue (Million) Forecast, by Application 2019 & 2032
- Table 54: Australia Ambient Light Market Volume (K Unit) Forecast, by Application 2019 & 2032
- Table 55: Indonesia Ambient Light Market Revenue (Million) Forecast, by Application 2019 & 2032
- Table 56: Indonesia Ambient Light Market Volume (K Unit) Forecast, by Application 2019 & 2032
- Table 57: Phillipes Ambient Light Market Revenue (Million) Forecast, by Application 2019 & 2032
- Table 58: Phillipes Ambient Light Market Volume (K Unit) Forecast, by Application 2019 & 2032
- Table 59: Singapore Ambient Light Market Revenue (Million) Forecast, by Application 2019 & 2032
- Table 60: Singapore Ambient Light Market Volume (K Unit) Forecast, by Application 2019 & 2032
- Table 61: Thailandc Ambient Light Market Revenue (Million) Forecast, by Application 2019 & 2032
- Table 62: Thailandc Ambient Light Market Volume (K Unit) Forecast, by Application 2019 & 2032
- Table 63: Rest of Asia Pacific Ambient Light Market Revenue (Million) Forecast, by Application 2019 & 2032
- Table 64: Rest of Asia Pacific Ambient Light Market Volume (K Unit) Forecast, by Application 2019 & 2032
- Table 65: Global Ambient Light Market Revenue Million Forecast, by Country 2019 & 2032
- Table 66: Global Ambient Light Market Volume K Unit Forecast, by Country 2019 & 2032
- Table 67: Brazil Ambient Light Market Revenue (Million) Forecast, by Application 2019 & 2032
- Table 68: Brazil Ambient Light Market Volume (K Unit) Forecast, by Application 2019 & 2032
- Table 69: Argentina Ambient Light Market Revenue (Million) Forecast, by Application 2019 & 2032
- Table 70: Argentina Ambient Light Market Volume (K Unit) Forecast, by Application 2019 & 2032
- Table 71: Peru Ambient Light Market Revenue (Million) Forecast, by Application 2019 & 2032
- Table 72: Peru Ambient Light Market Volume (K Unit) Forecast, by Application 2019 & 2032
- Table 73: Chile Ambient Light Market Revenue (Million) Forecast, by Application 2019 & 2032
- Table 74: Chile Ambient Light Market Volume (K Unit) Forecast, by Application 2019 & 2032
- Table 75: Colombia Ambient Light Market Revenue (Million) Forecast, by Application 2019 & 2032
- Table 76: Colombia Ambient Light Market Volume (K Unit) Forecast, by Application 2019 & 2032
- Table 77: Ecuador Ambient Light Market Revenue (Million) Forecast, by Application 2019 & 2032
- Table 78: Ecuador Ambient Light Market Volume (K Unit) Forecast, by Application 2019 & 2032
- Table 79: Venezuela Ambient Light Market Revenue (Million) Forecast, by Application 2019 & 2032
- Table 80: Venezuela Ambient Light Market Volume (K Unit) Forecast, by Application 2019 & 2032
- Table 81: Rest of South America Ambient Light Market Revenue (Million) Forecast, by Application 2019 & 2032
- Table 82: Rest of South America Ambient Light Market Volume (K Unit) Forecast, by Application 2019 & 2032
- Table 83: Global Ambient Light Market Revenue Million Forecast, by Country 2019 & 2032
- Table 84: Global Ambient Light Market Volume K Unit Forecast, by Country 2019 & 2032
- Table 85: United States Ambient Light Market Revenue (Million) Forecast, by Application 2019 & 2032
- Table 86: United States Ambient Light Market Volume (K Unit) Forecast, by Application 2019 & 2032
- Table 87: Canada Ambient Light Market Revenue (Million) Forecast, by Application 2019 & 2032
- Table 88: Canada Ambient Light Market Volume (K Unit) Forecast, by Application 2019 & 2032
- Table 89: Mexico Ambient Light Market Revenue (Million) Forecast, by Application 2019 & 2032
- Table 90: Mexico Ambient Light Market Volume (K Unit) Forecast, by Application 2019 & 2032
- Table 91: Global Ambient Light Market Revenue Million Forecast, by Country 2019 & 2032
- Table 92: Global Ambient Light Market Volume K Unit Forecast, by Country 2019 & 2032
- Table 93: United Arab Emirates Ambient Light Market Revenue (Million) Forecast, by Application 2019 & 2032
- Table 94: United Arab Emirates Ambient Light Market Volume (K Unit) Forecast, by Application 2019 & 2032
- Table 95: Saudi Arabia Ambient Light Market Revenue (Million) Forecast, by Application 2019 & 2032
- Table 96: Saudi Arabia Ambient Light Market Volume (K Unit) Forecast, by Application 2019 & 2032
- Table 97: South Africa Ambient Light Market Revenue (Million) Forecast, by Application 2019 & 2032
- Table 98: South Africa Ambient Light Market Volume (K Unit) Forecast, by Application 2019 & 2032
- Table 99: Rest of Middle East and Africa Ambient Light Market Revenue (Million) Forecast, by Application 2019 & 2032
- Table 100: Rest of Middle East and Africa Ambient Light Market Volume (K Unit) Forecast, by Application 2019 & 2032
- Table 101: Global Ambient Light Market Revenue Million Forecast, by Offering 2019 & 2032
- Table 102: Global Ambient Light Market Volume K Unit Forecast, by Offering 2019 & 2032
- Table 103: Global Ambient Light Market Revenue Million Forecast, by Type 2019 & 2032
- Table 104: Global Ambient Light Market Volume K Unit Forecast, by Type 2019 & 2032
- Table 105: Global Ambient Light Market Revenue Million Forecast, by End User 2019 & 2032
- Table 106: Global Ambient Light Market Volume K Unit Forecast, by End User 2019 & 2032
- Table 107: Global Ambient Light Market Revenue Million Forecast, by Country 2019 & 2032
- Table 108: Global Ambient Light Market Volume K Unit Forecast, by Country 2019 & 2032
- Table 109: United States Ambient Light Market Revenue (Million) Forecast, by Application 2019 & 2032
- Table 110: United States Ambient Light Market Volume (K Unit) Forecast, by Application 2019 & 2032
- Table 111: Canada Ambient Light Market Revenue (Million) Forecast, by Application 2019 & 2032
- Table 112: Canada Ambient Light Market Volume (K Unit) Forecast, by Application 2019 & 2032
- Table 113: Global Ambient Light Market Revenue Million Forecast, by Offering 2019 & 2032
- Table 114: Global Ambient Light Market Volume K Unit Forecast, by Offering 2019 & 2032
- Table 115: Global Ambient Light Market Revenue Million Forecast, by Type 2019 & 2032
- Table 116: Global Ambient Light Market Volume K Unit Forecast, by Type 2019 & 2032
- Table 117: Global Ambient Light Market Revenue Million Forecast, by End User 2019 & 2032
- Table 118: Global Ambient Light Market Volume K Unit Forecast, by End User 2019 & 2032
- Table 119: Global Ambient Light Market Revenue Million Forecast, by Country 2019 & 2032
- Table 120: Global Ambient Light Market Volume K Unit Forecast, by Country 2019 & 2032
- Table 121: United Kingdom Ambient Light Market Revenue (Million) Forecast, by Application 2019 & 2032
- Table 122: United Kingdom Ambient Light Market Volume (K Unit) Forecast, by Application 2019 & 2032
- Table 123: Germany Ambient Light Market Revenue (Million) Forecast, by Application 2019 & 2032
- Table 124: Germany Ambient Light Market Volume (K Unit) Forecast, by Application 2019 & 2032
- Table 125: France Ambient Light Market Revenue (Million) Forecast, by Application 2019 & 2032
- Table 126: France Ambient Light Market Volume (K Unit) Forecast, by Application 2019 & 2032
- Table 127: Rest of Europe Ambient Light Market Revenue (Million) Forecast, by Application 2019 & 2032
- Table 128: Rest of Europe Ambient Light Market Volume (K Unit) Forecast, by Application 2019 & 2032
- Table 129: Global Ambient Light Market Revenue Million Forecast, by Offering 2019 & 2032
- Table 130: Global Ambient Light Market Volume K Unit Forecast, by Offering 2019 & 2032
- Table 131: Global Ambient Light Market Revenue Million Forecast, by Type 2019 & 2032
- Table 132: Global Ambient Light Market Volume K Unit Forecast, by Type 2019 & 2032
- Table 133: Global Ambient Light Market Revenue Million Forecast, by End User 2019 & 2032
- Table 134: Global Ambient Light Market Volume K Unit Forecast, by End User 2019 & 2032
- Table 135: Global Ambient Light Market Revenue Million Forecast, by Country 2019 & 2032
- Table 136: Global Ambient Light Market Volume K Unit Forecast, by Country 2019 & 2032
- Table 137: China Ambient Light Market Revenue (Million) Forecast, by Application 2019 & 2032
- Table 138: China Ambient Light Market Volume (K Unit) Forecast, by Application 2019 & 2032
- Table 139: Japan Ambient Light Market Revenue (Million) Forecast, by Application 2019 & 2032
- Table 140: Japan Ambient Light Market Volume (K Unit) Forecast, by Application 2019 & 2032
- Table 141: India Ambient Light Market Revenue (Million) Forecast, by Application 2019 & 2032
- Table 142: India Ambient Light Market Volume (K Unit) Forecast, by Application 2019 & 2032
- Table 143: Rest of Asia Pacific Ambient Light Market Revenue (Million) Forecast, by Application 2019 & 2032
- Table 144: Rest of Asia Pacific Ambient Light Market Volume (K Unit) Forecast, by Application 2019 & 2032
- Table 145: Global Ambient Light Market Revenue Million Forecast, by Offering 2019 & 2032
- Table 146: Global Ambient Light Market Volume K Unit Forecast, by Offering 2019 & 2032
- Table 147: Global Ambient Light Market Revenue Million Forecast, by Type 2019 & 2032
- Table 148: Global Ambient Light Market Volume K Unit Forecast, by Type 2019 & 2032
- Table 149: Global Ambient Light Market Revenue Million Forecast, by End User 2019 & 2032
- Table 150: Global Ambient Light Market Volume K Unit Forecast, by End User 2019 & 2032
- Table 151: Global Ambient Light Market Revenue Million Forecast, by Country 2019 & 2032
- Table 152: Global Ambient Light Market Volume K Unit Forecast, by Country 2019 & 2032
- Table 153: Latin America Ambient Light Market Revenue (Million) Forecast, by Application 2019 & 2032
- Table 154: Latin America Ambient Light Market Volume (K Unit) Forecast, by Application 2019 & 2032
- Table 155: Middle East and Africa Ambient Light Market Revenue (Million) Forecast, by Application 2019 & 2032
- Table 156: Middle East and Africa Ambient Light Market Volume (K Unit) Forecast, by Application 2019 & 2032
Frequently Asked Questions
1. What is the projected Compound Annual Growth Rate (CAGR) of the Ambient Light Market?
The projected CAGR is approximately 8.90%.
2. Which companies are prominent players in the Ambient Light Market?
Key companies in the market include Eaton Corporation Inc, Wipro Consumer Care & Lighting Ltd, SPI Lighting, Hafele America Co, v2 Lighting Group, Samsung Electronics Co Ltd, Cree Inc, Hubbell Incorporated, GE Lighting, Amerlux, Bridgelux Inc, Nulite Lighting, Louis Poulsen, Koninklijke Philips NV, Acuity Brands Inc, OSRAM Licht AG, The Zumtobel Group, Decon Lighting Pvt Ltd.
3. What are the main segments of the Ambient Light Market?
The market segments include Offering, Type, End User.
4. Can you provide details about the market size?
The market size is estimated to be USD 69.57 Million as of 2022.
5. What are some drivers contributing to market growth?
Increasing Need for Energy-efficient Lighting Solutions; Increasing Adoption of Smart Lighting; Modernization of Infrastructure.
6. What are the notable trends driving market growth?
LEDs to Hold Significant Market Share.
7. Are there any restraints impacting market growth?
Challenges Associated With LED Driver Failure and High Cost Associated With Installation.
8. Can you provide examples of recent developments in the market?
March 2022: Koninklijke Philips NV rolled out an ambient experience and flexvision display with the Azurion system. The ambient experience with the flexvision display can reduce patient anxiety during interventional treatments, improve patient-staff expertise, and enhance workflows and productivity. According to the Samsung company, the new system enables staff members to adjust the ambient lighting and sound in the room during the patient arrival and preparation phases to maintain an overall calm sensation. The solution aims to distract, inform, educate, and empower patients to minimize their anxiety, particularly before therapy.
9. What pricing options are available for accessing the report?
Pricing options include single-user, multi-user, and enterprise licenses priced at USD 4750, USD 5250, and USD 8750 respectively.
10. Is the market size provided in terms of value or volume?
The market size is provided in terms of value, measured in Million and volume, measured in K Unit.
11. Are there any specific market keywords associated with the report?
Yes, the market keyword associated with the report is "Ambient Light Market," which aids in identifying and referencing the specific market segment covered.
12. How do I determine which pricing option suits my needs best?
The pricing options vary based on user requirements and access needs. Individual users may opt for single-user licenses, while businesses requiring broader access may choose multi-user or enterprise licenses for cost-effective access to the report.
13. Are there any additional resources or data provided in the Ambient Light Market report?
While the report offers comprehensive insights, it's advisable to review the specific contents or supplementary materials provided to ascertain if additional resources or data are available.
14. How can I stay updated on further developments or reports in the Ambient Light Market?
To stay informed about further developments, trends, and reports in the Ambient Light Market, consider subscribing to industry newsletters, following relevant companies and organizations, or regularly checking reputable industry news sources and publications.
Methodology
Step 1 - Identification of Relevant Samples Size from Population Database


Step 2 - Approaches for Defining Global Market Size (Value, Volume* & Price*)

Note*: In applicable scenarios
Step 3 - Data Sources
Primary Research
- Web Analytics
- Survey Reports
- Research Institute
- Latest Research Reports
- Opinion Leaders
Secondary Research
- Annual Reports
- White Paper
- Latest Press Release
- Industry Association
- Paid Database
- Investor Presentations

Step 4 - Data Triangulation
Involves using different sources of information in order to increase the validity of a study
These sources are likely to be stakeholders in a program - participants, other researchers, program staff, other community members, and so on.
Then we put all data in single framework & apply various statistical tools to find out the dynamic on the market.
During the analysis stage, feedback from the stakeholder groups would be compared to determine areas of agreement as well as areas of divergence


