
Key Insights
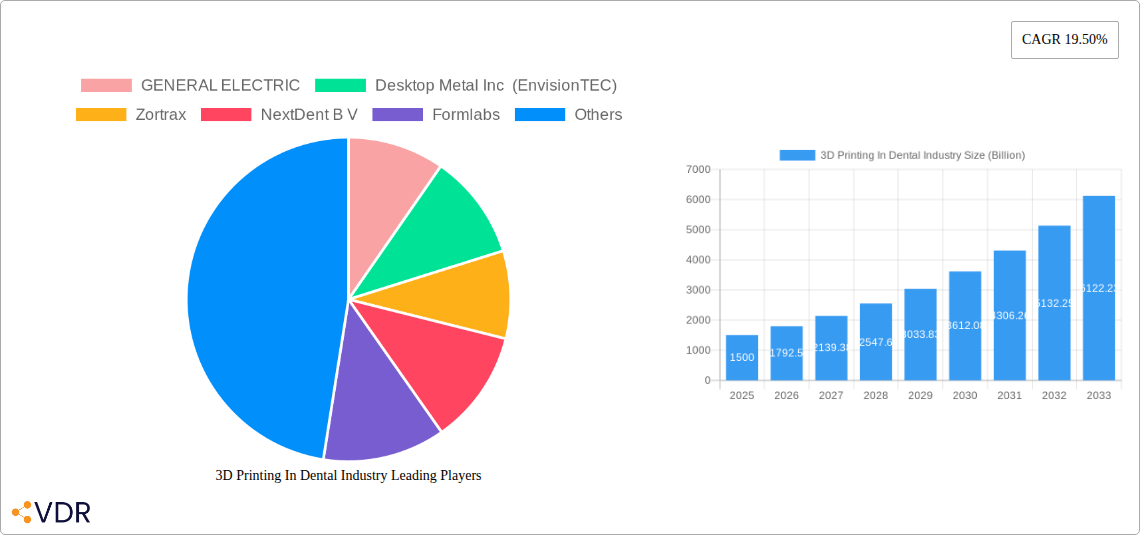
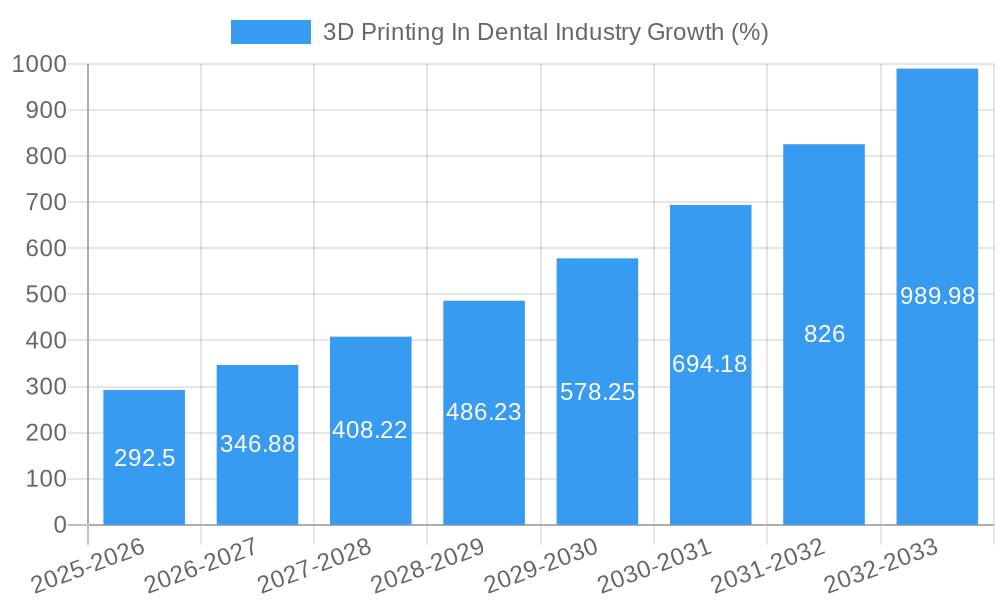
The global dental 3D printing market is experiencing robust growth, projected to reach a substantial size driven by several key factors. The market's Compound Annual Growth Rate (CAGR) of 19.50% from 2019-2033 signifies significant expansion, fueled by the increasing adoption of advanced technologies like Vat Photopolymerization and Polyjet Technology. This growth is particularly prominent in applications such as prosthodontics, orthodontics, and implantalogy, where 3D printing offers improved accuracy, efficiency, and customization compared to traditional methods. The expanding base of dental laboratories and hospitals & clinics further enhances market demand, with North America and Europe currently dominating market share. However, the high initial investment cost of 3D printers and the need for specialized materials and skilled personnel represent key restraints. The market is segmented by various factors, including printer technology, application, end-user, and material used. The competitive landscape is dynamic, with key players such as 3D Systems, Stratasys, and others constantly innovating to improve printer performance, material properties, and software solutions. Future growth will likely be driven by advancements in biocompatible materials, integration of AI and automation, and the expanding availability of affordable 3D printing solutions for smaller dental practices.
The continued miniaturization and improved affordability of dental 3D printers are expected to propel market penetration across various regions. The Asia-Pacific region, particularly China and India, presents considerable untapped potential due to the growing middle class and increasing demand for better dental care. As the technology matures and becomes more user-friendly, we can anticipate even wider adoption, leading to a larger market size and stronger competition. Furthermore, strategic partnerships between 3D printer manufacturers, material suppliers, and dental professionals will be crucial in fostering market expansion. Research and development efforts focused on streamlining workflows, developing more versatile materials, and addressing limitations in terms of speed and scalability will significantly impact future growth trajectory. This implies that continuous innovation and a focus on user experience will be key to unlocking the full potential of 3D printing in the dental industry.
3D Printing in Dental Industry: A Comprehensive Market Report (2019-2033)
This comprehensive report provides an in-depth analysis of the 3D printing market within the dental industry, offering valuable insights for industry professionals, investors, and stakeholders. The study period covers 2019-2033, with a base year of 2025 and a forecast period of 2025-2033. The report segments the market by product & service (materials, equipment, services), application (prosthodontics, orthodontics, implantology), end-user (dental laboratories, hospitals & clinics, others), and technology (Vat Photopolymerization, Polyjet, FDM, SLS, others). Key players analyzed include GENERAL ELECTRIC, Desktop Metal Inc (EnvisionTEC), Zortrax, NextDent B V, Formlabs, SprintRay Inc, Asiga, Rapid Shape GmbH, 3D Systems Inc, Renishaw plc, Ackuretta, Institut Straumann AG, Nexa3D, Stratasys, and Quoris3D. The total market is expected to reach xx Billion by 2033.
3D Printing In Dental Industry Market Dynamics & Structure
The dental 3D printing market is characterized by a moderately concentrated landscape, with several key players holding significant market share. Technological innovation, particularly in materials science and printing speeds, is a primary growth driver. Stringent regulatory frameworks concerning biocompatibility and safety standards influence market dynamics. Competitive pressures from traditional manufacturing methods exist, though 3D printing offers advantages in customization and speed. The end-user demographic is diverse, including dental laboratories, hospitals, and private clinics, each with unique needs and adoption rates. Mergers and acquisitions (M&A) activity has been significant, with major players consolidating their market positions and expanding their product portfolios.
- Market Concentration: Moderately concentrated, with top 5 players holding approximately xx% market share in 2024.
- Technological Innovation: Continuous advancements in materials (e.g., biocompatible resins), printing technologies (e.g., increased resolution and speed), and software (e.g., improved design and workflow integration) are driving growth.
- Regulatory Framework: Compliance with ISO 13485 and other relevant medical device regulations is crucial, posing both challenges and opportunities.
- Competitive Substitutes: Traditional methods like milling and casting remain competitive, but 3D printing offers advantages in complex designs and rapid prototyping.
- End-User Demographics: Dental laboratories represent a major segment, followed by hospitals and clinics. The adoption rate varies depending on factors like technology proficiency and budgetary constraints.
- M&A Activity: Significant M&A activity observed in recent years, with xx major deals recorded between 2019 and 2024, indicating consolidation and expansion within the market.
3D Printing In Dental Industry Growth Trends & Insights
The global dental 3D printing market experienced robust growth during the historical period (2019-2024), driven by increased adoption of digital dentistry workflows, rising demand for personalized dental solutions, and technological advancements. The market size is projected to grow at a Compound Annual Growth Rate (CAGR) of xx% during the forecast period (2025-2033), reaching an estimated xx Billion by 2033. This growth reflects factors like increasing affordability of 3D printers, growing awareness of the benefits of additive manufacturing in dentistry, and expansion of the dental tourism industry. Market penetration is currently at xx%, with significant potential for growth in emerging economies. Technological disruptions, such as the development of high-speed, high-resolution printers and biocompatible materials, are further fueling market expansion. Consumer behavior shifts, including increasing demand for same-day dentistry and customized restorations, are also contributing to the market's growth trajectory. The shift toward digital dentistry workflows is accelerating the adoption of 3D printing within the industry.
Dominant Regions, Countries, or Segments in 3D Printing In Dental Industry
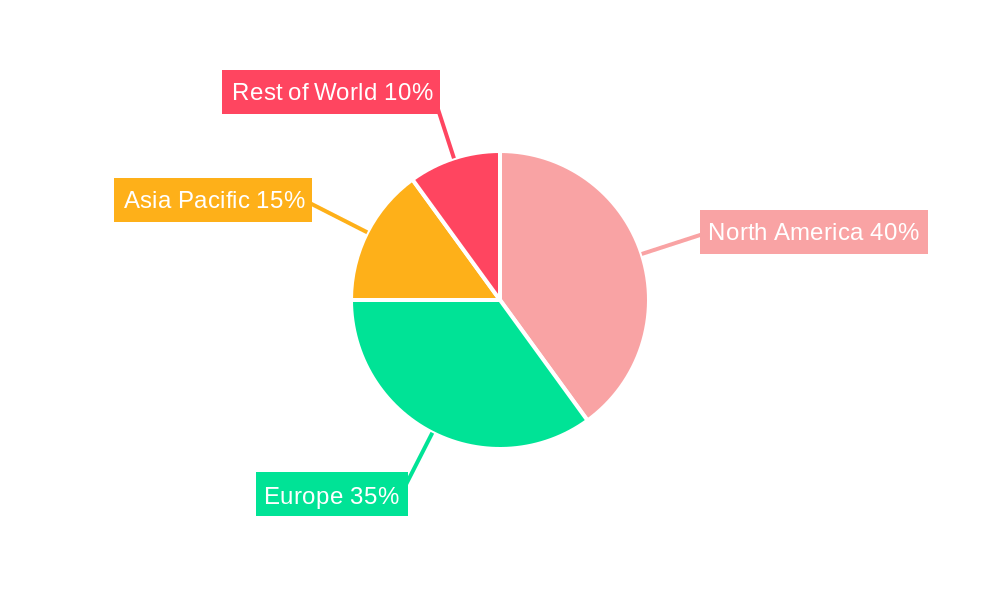
North America currently holds the largest market share in the dental 3D printing industry, driven by factors such as high technology adoption rates, increased investment in R&D, and strong presence of major players. Europe follows as a significant market, with a substantial presence of dental laboratories and clinics adopting 3D printing technologies. The Asia-Pacific region is expected to witness significant growth in the forecast period, fueled by rising disposable incomes, increasing awareness of digital dentistry, and government initiatives promoting technological advancements in healthcare.
- Key Drivers: High adoption rate of digital dentistry workflows in North America and Europe; Rising disposable income and healthcare expenditure in Asia-Pacific; Growing dental tourism; Stringent regulations promoting adoption of advanced technologies in several regions.
- Market Share: North America accounts for approximately xx% of the global market, followed by Europe at xx% and Asia-Pacific at xx%.
- Growth Potential: Asia-Pacific is expected to exhibit the highest growth rate during the forecast period. Africa and Latin America also possess notable growth potential.
Segment Dominance: The dental 3D printers segment holds the largest market share, followed by materials. Within applications, prosthodontics currently dominates, with orthodontics and implantology showing promising growth. Dental laboratories represent the largest end-user segment. Vat Photopolymerization is the leading printing technology, but other technologies are gaining traction.
3D Printing In Dental Industry Product Landscape
The dental 3D printing market offers a diverse range of products, from desktop printers for smaller clinics to industrial-scale systems for large laboratories. These printers use various technologies, including Vat Photopolymerization, Polyjet, Fused Deposition Modeling (FDM), and Selective Laser Sintering (SLS), each with its own strengths and weaknesses. Materials range from biocompatible resins for models and prosthetics to metals for implants. Recent innovations include high-speed printers, improved software for design and workflow integration, and the development of new materials with enhanced properties. Unique selling propositions often center around print speed, accuracy, material versatility, and ease of use. Key technological advancements include improvements in resolution, speed, and the development of biocompatible materials that mimic the properties of natural teeth.
Key Drivers, Barriers & Challenges in 3D Printing In Dental Industry
Key Drivers:
- Increased demand for personalized and customized dental solutions.
- Advancements in 3D printing technologies, resulting in improved accuracy, speed, and material diversity.
- Growing adoption of digital workflows in dental practices.
- Rising investments in research and development.
Challenges and Restraints:
- High initial investment costs for 3D printing equipment and materials.
- Need for specialized training and expertise to operate 3D printers effectively.
- Regulatory hurdles and compliance requirements for medical devices.
- Potential supply chain disruptions impacting the availability of materials and equipment. This has been quantifiably impacted by xx% during periods of significant disruption in the past three years.
Emerging Opportunities in 3D Printing In Dental Industry
Emerging opportunities lie in the expansion of 3D printing into new applications, such as the fabrication of surgical guides, personalized orthodontic appliances, and patient-specific implants. Untapped markets in emerging economies present significant growth potential. The development of new biocompatible materials with improved properties and the integration of artificial intelligence (AI) in 3D printing workflows offer further opportunities. There is also potential for growth in 3D printing services, providing access to technology for smaller practices and labs without the capital investment in equipment.
Growth Accelerators in the 3D Printing In Dental Industry Industry
Technological breakthroughs, such as the development of faster, more accurate, and cost-effective 3D printing technologies, will significantly accelerate market growth. Strategic partnerships between dental equipment manufacturers and 3D printing companies are also crucial in fostering innovation and market penetration. Expanding market access through strategic initiatives and government support in emerging economies will further fuel growth. The continued shift toward digital dentistry and the adoption of cloud-based platforms for design and workflow management are further growth catalysts.
Key Players Shaping the 3D Printing In Dental Industry Market
- GENERAL ELECTRIC
- Desktop Metal Inc (EnvisionTEC)
- Zortrax
- NextDent B V
- Formlabs
- SprintRay Inc
- Asiga
- Rapid Shape GmbH
- 3D Systems Inc
- Renishaw plc
- Ackuretta
- Institut Straumann AG
- Nexa3D
- Stratasys
- Quoris3D
Notable Milestones in 3D Printing In Dental Industry Sector
- March 2022: Dentsply Sirona launched the Primeprint 3D printer, expanding the market for high-quality, easy-to-use dental 3D printing solutions.
- February 2022: Desktop Health launched the 'Einstein' series of dental 3D printing systems, leveraging DLP technology acquired through EnvisionTEC acquisition.
In-Depth 3D Printing In Dental Industry Market Outlook
The future of the dental 3D printing market is bright, driven by continued technological advancements, increasing demand for personalized dental care, and the expansion of the digital dentistry ecosystem. Strategic opportunities lie in developing innovative materials, expanding into new applications, and leveraging AI and machine learning to optimize workflows. The market is poised for substantial growth, with significant potential for companies that can deliver high-quality, cost-effective, and user-friendly 3D printing solutions to the dental industry.
3D Printing In Dental Industry Segmentation
-
1. Technology
- 1.1. Vat Photopolymerization
- 1.2. Polyjet Technology
- 1.3. Fused Deposition Modelling
- 1.4. Selective Laser Sintering
- 1.5. Other Technologies
-
2. Product & Service
-
2.1. Materials
- 2.1.1. Plastic
- 2.1.2. Metal
- 2.1.3. Others
-
2.2. Equipment
- 2.2.1. Dental 3D Scanners
- 2.2.2. Dental 3D Printers
- 2.3. Services
-
2.1. Materials
-
3. Application
- 3.1. Prosthodontics
- 3.2. Orthodontics
- 3.3. Impantalogy
-
4. End User
- 4.1. Dental Laboratories
- 4.2. Hospitals & Clinics
- 4.3. Others
3D Printing In Dental Industry Segmentation By Geography
-
1. North America
- 1.1. United States
- 1.2. Canada
- 1.3. Mexico
-
2. Europe
- 2.1. Germany
- 2.2. United Kingdom
- 2.3. France
- 2.4. Italy
- 2.5. Spain
- 2.6. Rest of Europe
-
3. Asia Pacific
- 3.1. China
- 3.2. Japan
- 3.3. India
- 3.4. Australia
- 3.5. South Korea
- 3.6. Rest of Asia Pacific
-
4. Middle East and Africa
- 4.1. GCC
- 4.2. South Africa
- 4.3. Rest of Middle East and Africa
-
5. South America
- 5.1. Brazil
- 5.2. Argentina
- 5.3. Rest of South America
3D Printing In Dental Industry REPORT HIGHLIGHTS
| Aspects | Details |
|---|---|
| Study Period | 2019-2033 |
| Base Year | 2024 |
| Estimated Year | 2025 |
| Forecast Period | 2025-2033 |
| Historical Period | 2019-2024 |
| Growth Rate | CAGR of 19.50% from 2019-2033 |
| Segmentation |
|
Table of Contents
- 1. Introduction
- 1.1. Research Scope
- 1.2. Market Segmentation
- 1.3. Research Methodology
- 1.4. Definitions and Assumptions
- 2. Executive Summary
- 2.1. Introduction
- 3. Market Dynamics
- 3.1. Introduction
- 3.2. Market Drivers
- 3.2.1. Increasing Incidence of Dental Caries and Other Dental Diseases; Rising Demand for Cosmetic Dentistry; Growing Adoption of Dental 3D Printers due to the Advantages it Offers
- 3.3. Market Restrains
- 3.3.1. High Cost of Electroceutical Devices
- 3.4. Market Trends
- 3.4.1. The Orthodontics Segment is Expected to Hold a Major Market Share in the Dental 3D Printing Market
- 4. Market Factor Analysis
- 4.1. Porters Five Forces
- 4.2. Supply/Value Chain
- 4.3. PESTEL analysis
- 4.4. Market Entropy
- 4.5. Patent/Trademark Analysis
- 5. Global 3D Printing In Dental Industry Analysis, Insights and Forecast, 2019-2031
- 5.1. Market Analysis, Insights and Forecast - by Technology
- 5.1.1. Vat Photopolymerization
- 5.1.2. Polyjet Technology
- 5.1.3. Fused Deposition Modelling
- 5.1.4. Selective Laser Sintering
- 5.1.5. Other Technologies
- 5.2. Market Analysis, Insights and Forecast - by Product & Service
- 5.2.1. Materials
- 5.2.1.1. Plastic
- 5.2.1.2. Metal
- 5.2.1.3. Others
- 5.2.2. Equipment
- 5.2.2.1. Dental 3D Scanners
- 5.2.2.2. Dental 3D Printers
- 5.2.3. Services
- 5.2.1. Materials
- 5.3. Market Analysis, Insights and Forecast - by Application
- 5.3.1. Prosthodontics
- 5.3.2. Orthodontics
- 5.3.3. Impantalogy
- 5.4. Market Analysis, Insights and Forecast - by End User
- 5.4.1. Dental Laboratories
- 5.4.2. Hospitals & Clinics
- 5.4.3. Others
- 5.5. Market Analysis, Insights and Forecast - by Region
- 5.5.1. North America
- 5.5.2. Europe
- 5.5.3. Asia Pacific
- 5.5.4. Middle East and Africa
- 5.5.5. South America
- 5.1. Market Analysis, Insights and Forecast - by Technology
- 6. North America 3D Printing In Dental Industry Analysis, Insights and Forecast, 2019-2031
- 6.1. Market Analysis, Insights and Forecast - by Technology
- 6.1.1. Vat Photopolymerization
- 6.1.2. Polyjet Technology
- 6.1.3. Fused Deposition Modelling
- 6.1.4. Selective Laser Sintering
- 6.1.5. Other Technologies
- 6.2. Market Analysis, Insights and Forecast - by Product & Service
- 6.2.1. Materials
- 6.2.1.1. Plastic
- 6.2.1.2. Metal
- 6.2.1.3. Others
- 6.2.2. Equipment
- 6.2.2.1. Dental 3D Scanners
- 6.2.2.2. Dental 3D Printers
- 6.2.3. Services
- 6.2.1. Materials
- 6.3. Market Analysis, Insights and Forecast - by Application
- 6.3.1. Prosthodontics
- 6.3.2. Orthodontics
- 6.3.3. Impantalogy
- 6.4. Market Analysis, Insights and Forecast - by End User
- 6.4.1. Dental Laboratories
- 6.4.2. Hospitals & Clinics
- 6.4.3. Others
- 6.1. Market Analysis, Insights and Forecast - by Technology
- 7. Europe 3D Printing In Dental Industry Analysis, Insights and Forecast, 2019-2031
- 7.1. Market Analysis, Insights and Forecast - by Technology
- 7.1.1. Vat Photopolymerization
- 7.1.2. Polyjet Technology
- 7.1.3. Fused Deposition Modelling
- 7.1.4. Selective Laser Sintering
- 7.1.5. Other Technologies
- 7.2. Market Analysis, Insights and Forecast - by Product & Service
- 7.2.1. Materials
- 7.2.1.1. Plastic
- 7.2.1.2. Metal
- 7.2.1.3. Others
- 7.2.2. Equipment
- 7.2.2.1. Dental 3D Scanners
- 7.2.2.2. Dental 3D Printers
- 7.2.3. Services
- 7.2.1. Materials
- 7.3. Market Analysis, Insights and Forecast - by Application
- 7.3.1. Prosthodontics
- 7.3.2. Orthodontics
- 7.3.3. Impantalogy
- 7.4. Market Analysis, Insights and Forecast - by End User
- 7.4.1. Dental Laboratories
- 7.4.2. Hospitals & Clinics
- 7.4.3. Others
- 7.1. Market Analysis, Insights and Forecast - by Technology
- 8. Asia Pacific 3D Printing In Dental Industry Analysis, Insights and Forecast, 2019-2031
- 8.1. Market Analysis, Insights and Forecast - by Technology
- 8.1.1. Vat Photopolymerization
- 8.1.2. Polyjet Technology
- 8.1.3. Fused Deposition Modelling
- 8.1.4. Selective Laser Sintering
- 8.1.5. Other Technologies
- 8.2. Market Analysis, Insights and Forecast - by Product & Service
- 8.2.1. Materials
- 8.2.1.1. Plastic
- 8.2.1.2. Metal
- 8.2.1.3. Others
- 8.2.2. Equipment
- 8.2.2.1. Dental 3D Scanners
- 8.2.2.2. Dental 3D Printers
- 8.2.3. Services
- 8.2.1. Materials
- 8.3. Market Analysis, Insights and Forecast - by Application
- 8.3.1. Prosthodontics
- 8.3.2. Orthodontics
- 8.3.3. Impantalogy
- 8.4. Market Analysis, Insights and Forecast - by End User
- 8.4.1. Dental Laboratories
- 8.4.2. Hospitals & Clinics
- 8.4.3. Others
- 8.1. Market Analysis, Insights and Forecast - by Technology
- 9. Middle East and Africa 3D Printing In Dental Industry Analysis, Insights and Forecast, 2019-2031
- 9.1. Market Analysis, Insights and Forecast - by Technology
- 9.1.1. Vat Photopolymerization
- 9.1.2. Polyjet Technology
- 9.1.3. Fused Deposition Modelling
- 9.1.4. Selective Laser Sintering
- 9.1.5. Other Technologies
- 9.2. Market Analysis, Insights and Forecast - by Product & Service
- 9.2.1. Materials
- 9.2.1.1. Plastic
- 9.2.1.2. Metal
- 9.2.1.3. Others
- 9.2.2. Equipment
- 9.2.2.1. Dental 3D Scanners
- 9.2.2.2. Dental 3D Printers
- 9.2.3. Services
- 9.2.1. Materials
- 9.3. Market Analysis, Insights and Forecast - by Application
- 9.3.1. Prosthodontics
- 9.3.2. Orthodontics
- 9.3.3. Impantalogy
- 9.4. Market Analysis, Insights and Forecast - by End User
- 9.4.1. Dental Laboratories
- 9.4.2. Hospitals & Clinics
- 9.4.3. Others
- 9.1. Market Analysis, Insights and Forecast - by Technology
- 10. South America 3D Printing In Dental Industry Analysis, Insights and Forecast, 2019-2031
- 10.1. Market Analysis, Insights and Forecast - by Technology
- 10.1.1. Vat Photopolymerization
- 10.1.2. Polyjet Technology
- 10.1.3. Fused Deposition Modelling
- 10.1.4. Selective Laser Sintering
- 10.1.5. Other Technologies
- 10.2. Market Analysis, Insights and Forecast - by Product & Service
- 10.2.1. Materials
- 10.2.1.1. Plastic
- 10.2.1.2. Metal
- 10.2.1.3. Others
- 10.2.2. Equipment
- 10.2.2.1. Dental 3D Scanners
- 10.2.2.2. Dental 3D Printers
- 10.2.3. Services
- 10.2.1. Materials
- 10.3. Market Analysis, Insights and Forecast - by Application
- 10.3.1. Prosthodontics
- 10.3.2. Orthodontics
- 10.3.3. Impantalogy
- 10.4. Market Analysis, Insights and Forecast - by End User
- 10.4.1. Dental Laboratories
- 10.4.2. Hospitals & Clinics
- 10.4.3. Others
- 10.1. Market Analysis, Insights and Forecast - by Technology
- 11. North Americ 3D Printing In Dental Industry Analysis, Insights and Forecast, 2019-2031
- 11.1. Market Analysis, Insights and Forecast - By Country/Sub-region
- 11.1.1 United States
- 11.1.2 Canada
- 11.1.3 Mexico
- 12. South America 3D Printing In Dental Industry Analysis, Insights and Forecast, 2019-2031
- 12.1. Market Analysis, Insights and Forecast - By Country/Sub-region
- 12.1.1 Brazil
- 12.1.2 Mexico
- 12.1.3 Rest of South America
- 13. Europe 3D Printing In Dental Industry Analysis, Insights and Forecast, 2019-2031
- 13.1. Market Analysis, Insights and Forecast - By Country/Sub-region
- 13.1.1 Germany
- 13.1.2 United Kingdom
- 13.1.3 France
- 13.1.4 Italy
- 13.1.5 Spain
- 13.1.6 Rest of Europe
- 14. Asia Pacific 3D Printing In Dental Industry Analysis, Insights and Forecast, 2019-2031
- 14.1. Market Analysis, Insights and Forecast - By Country/Sub-region
- 14.1.1 China
- 14.1.2 Japan
- 14.1.3 India
- 14.1.4 South Korea
- 14.1.5 Taiwan
- 14.1.6 Australia
- 14.1.7 Rest of Asia-Pacific
- 15. MEA 3D Printing In Dental Industry Analysis, Insights and Forecast, 2019-2031
- 15.1. Market Analysis, Insights and Forecast - By Country/Sub-region
- 15.1.1 Middle East
- 15.1.2 Africa
- 16. Competitive Analysis
- 16.1. Global Market Share Analysis 2024
- 16.2. Company Profiles
- 16.2.1 GENERAL ELECTRIC
- 16.2.1.1. Overview
- 16.2.1.2. Products
- 16.2.1.3. SWOT Analysis
- 16.2.1.4. Recent Developments
- 16.2.1.5. Financials (Based on Availability)
- 16.2.2 Desktop Metal Inc (EnvisionTEC)
- 16.2.2.1. Overview
- 16.2.2.2. Products
- 16.2.2.3. SWOT Analysis
- 16.2.2.4. Recent Developments
- 16.2.2.5. Financials (Based on Availability)
- 16.2.3 Zortrax
- 16.2.3.1. Overview
- 16.2.3.2. Products
- 16.2.3.3. SWOT Analysis
- 16.2.3.4. Recent Developments
- 16.2.3.5. Financials (Based on Availability)
- 16.2.4 NextDent B V
- 16.2.4.1. Overview
- 16.2.4.2. Products
- 16.2.4.3. SWOT Analysis
- 16.2.4.4. Recent Developments
- 16.2.4.5. Financials (Based on Availability)
- 16.2.5 Formlabs
- 16.2.5.1. Overview
- 16.2.5.2. Products
- 16.2.5.3. SWOT Analysis
- 16.2.5.4. Recent Developments
- 16.2.5.5. Financials (Based on Availability)
- 16.2.6 SprintRay Inc
- 16.2.6.1. Overview
- 16.2.6.2. Products
- 16.2.6.3. SWOT Analysis
- 16.2.6.4. Recent Developments
- 16.2.6.5. Financials (Based on Availability)
- 16.2.7 Asiga*List Not Exhaustive
- 16.2.7.1. Overview
- 16.2.7.2. Products
- 16.2.7.3. SWOT Analysis
- 16.2.7.4. Recent Developments
- 16.2.7.5. Financials (Based on Availability)
- 16.2.8 Rapid Shape GmbH
- 16.2.8.1. Overview
- 16.2.8.2. Products
- 16.2.8.3. SWOT Analysis
- 16.2.8.4. Recent Developments
- 16.2.8.5. Financials (Based on Availability)
- 16.2.9 3D Systems Inc
- 16.2.9.1. Overview
- 16.2.9.2. Products
- 16.2.9.3. SWOT Analysis
- 16.2.9.4. Recent Developments
- 16.2.9.5. Financials (Based on Availability)
- 16.2.10 Renishaw plc
- 16.2.10.1. Overview
- 16.2.10.2. Products
- 16.2.10.3. SWOT Analysis
- 16.2.10.4. Recent Developments
- 16.2.10.5. Financials (Based on Availability)
- 16.2.11 Ackuretta
- 16.2.11.1. Overview
- 16.2.11.2. Products
- 16.2.11.3. SWOT Analysis
- 16.2.11.4. Recent Developments
- 16.2.11.5. Financials (Based on Availability)
- 16.2.12 Institut Straumann AG
- 16.2.12.1. Overview
- 16.2.12.2. Products
- 16.2.12.3. SWOT Analysis
- 16.2.12.4. Recent Developments
- 16.2.12.5. Financials (Based on Availability)
- 16.2.13 Nexa3D
- 16.2.13.1. Overview
- 16.2.13.2. Products
- 16.2.13.3. SWOT Analysis
- 16.2.13.4. Recent Developments
- 16.2.13.5. Financials (Based on Availability)
- 16.2.14 Stratasys
- 16.2.14.1. Overview
- 16.2.14.2. Products
- 16.2.14.3. SWOT Analysis
- 16.2.14.4. Recent Developments
- 16.2.14.5. Financials (Based on Availability)
- 16.2.15 Quoris3D
- 16.2.15.1. Overview
- 16.2.15.2. Products
- 16.2.15.3. SWOT Analysis
- 16.2.15.4. Recent Developments
- 16.2.15.5. Financials (Based on Availability)
- 16.2.1 GENERAL ELECTRIC
List of Figures
- Figure 1: Global 3D Printing In Dental Industry Revenue Breakdown (Billion, %) by Region 2024 & 2032
- Figure 2: North Americ 3D Printing In Dental Industry Revenue (Billion), by Country 2024 & 2032
- Figure 3: North Americ 3D Printing In Dental Industry Revenue Share (%), by Country 2024 & 2032
- Figure 4: South America 3D Printing In Dental Industry Revenue (Billion), by Country 2024 & 2032
- Figure 5: South America 3D Printing In Dental Industry Revenue Share (%), by Country 2024 & 2032
- Figure 6: Europe 3D Printing In Dental Industry Revenue (Billion), by Country 2024 & 2032
- Figure 7: Europe 3D Printing In Dental Industry Revenue Share (%), by Country 2024 & 2032
- Figure 8: Asia Pacific 3D Printing In Dental Industry Revenue (Billion), by Country 2024 & 2032
- Figure 9: Asia Pacific 3D Printing In Dental Industry Revenue Share (%), by Country 2024 & 2032
- Figure 10: MEA 3D Printing In Dental Industry Revenue (Billion), by Country 2024 & 2032
- Figure 11: MEA 3D Printing In Dental Industry Revenue Share (%), by Country 2024 & 2032
- Figure 12: North America 3D Printing In Dental Industry Revenue (Billion), by Technology 2024 & 2032
- Figure 13: North America 3D Printing In Dental Industry Revenue Share (%), by Technology 2024 & 2032
- Figure 14: North America 3D Printing In Dental Industry Revenue (Billion), by Product & Service 2024 & 2032
- Figure 15: North America 3D Printing In Dental Industry Revenue Share (%), by Product & Service 2024 & 2032
- Figure 16: North America 3D Printing In Dental Industry Revenue (Billion), by Application 2024 & 2032
- Figure 17: North America 3D Printing In Dental Industry Revenue Share (%), by Application 2024 & 2032
- Figure 18: North America 3D Printing In Dental Industry Revenue (Billion), by End User 2024 & 2032
- Figure 19: North America 3D Printing In Dental Industry Revenue Share (%), by End User 2024 & 2032
- Figure 20: North America 3D Printing In Dental Industry Revenue (Billion), by Country 2024 & 2032
- Figure 21: North America 3D Printing In Dental Industry Revenue Share (%), by Country 2024 & 2032
- Figure 22: Europe 3D Printing In Dental Industry Revenue (Billion), by Technology 2024 & 2032
- Figure 23: Europe 3D Printing In Dental Industry Revenue Share (%), by Technology 2024 & 2032
- Figure 24: Europe 3D Printing In Dental Industry Revenue (Billion), by Product & Service 2024 & 2032
- Figure 25: Europe 3D Printing In Dental Industry Revenue Share (%), by Product & Service 2024 & 2032
- Figure 26: Europe 3D Printing In Dental Industry Revenue (Billion), by Application 2024 & 2032
- Figure 27: Europe 3D Printing In Dental Industry Revenue Share (%), by Application 2024 & 2032
- Figure 28: Europe 3D Printing In Dental Industry Revenue (Billion), by End User 2024 & 2032
- Figure 29: Europe 3D Printing In Dental Industry Revenue Share (%), by End User 2024 & 2032
- Figure 30: Europe 3D Printing In Dental Industry Revenue (Billion), by Country 2024 & 2032
- Figure 31: Europe 3D Printing In Dental Industry Revenue Share (%), by Country 2024 & 2032
- Figure 32: Asia Pacific 3D Printing In Dental Industry Revenue (Billion), by Technology 2024 & 2032
- Figure 33: Asia Pacific 3D Printing In Dental Industry Revenue Share (%), by Technology 2024 & 2032
- Figure 34: Asia Pacific 3D Printing In Dental Industry Revenue (Billion), by Product & Service 2024 & 2032
- Figure 35: Asia Pacific 3D Printing In Dental Industry Revenue Share (%), by Product & Service 2024 & 2032
- Figure 36: Asia Pacific 3D Printing In Dental Industry Revenue (Billion), by Application 2024 & 2032
- Figure 37: Asia Pacific 3D Printing In Dental Industry Revenue Share (%), by Application 2024 & 2032
- Figure 38: Asia Pacific 3D Printing In Dental Industry Revenue (Billion), by End User 2024 & 2032
- Figure 39: Asia Pacific 3D Printing In Dental Industry Revenue Share (%), by End User 2024 & 2032
- Figure 40: Asia Pacific 3D Printing In Dental Industry Revenue (Billion), by Country 2024 & 2032
- Figure 41: Asia Pacific 3D Printing In Dental Industry Revenue Share (%), by Country 2024 & 2032
- Figure 42: Middle East and Africa 3D Printing In Dental Industry Revenue (Billion), by Technology 2024 & 2032
- Figure 43: Middle East and Africa 3D Printing In Dental Industry Revenue Share (%), by Technology 2024 & 2032
- Figure 44: Middle East and Africa 3D Printing In Dental Industry Revenue (Billion), by Product & Service 2024 & 2032
- Figure 45: Middle East and Africa 3D Printing In Dental Industry Revenue Share (%), by Product & Service 2024 & 2032
- Figure 46: Middle East and Africa 3D Printing In Dental Industry Revenue (Billion), by Application 2024 & 2032
- Figure 47: Middle East and Africa 3D Printing In Dental Industry Revenue Share (%), by Application 2024 & 2032
- Figure 48: Middle East and Africa 3D Printing In Dental Industry Revenue (Billion), by End User 2024 & 2032
- Figure 49: Middle East and Africa 3D Printing In Dental Industry Revenue Share (%), by End User 2024 & 2032
- Figure 50: Middle East and Africa 3D Printing In Dental Industry Revenue (Billion), by Country 2024 & 2032
- Figure 51: Middle East and Africa 3D Printing In Dental Industry Revenue Share (%), by Country 2024 & 2032
- Figure 52: South America 3D Printing In Dental Industry Revenue (Billion), by Technology 2024 & 2032
- Figure 53: South America 3D Printing In Dental Industry Revenue Share (%), by Technology 2024 & 2032
- Figure 54: South America 3D Printing In Dental Industry Revenue (Billion), by Product & Service 2024 & 2032
- Figure 55: South America 3D Printing In Dental Industry Revenue Share (%), by Product & Service 2024 & 2032
- Figure 56: South America 3D Printing In Dental Industry Revenue (Billion), by Application 2024 & 2032
- Figure 57: South America 3D Printing In Dental Industry Revenue Share (%), by Application 2024 & 2032
- Figure 58: South America 3D Printing In Dental Industry Revenue (Billion), by End User 2024 & 2032
- Figure 59: South America 3D Printing In Dental Industry Revenue Share (%), by End User 2024 & 2032
- Figure 60: South America 3D Printing In Dental Industry Revenue (Billion), by Country 2024 & 2032
- Figure 61: South America 3D Printing In Dental Industry Revenue Share (%), by Country 2024 & 2032
List of Tables
- Table 1: Global 3D Printing In Dental Industry Revenue Billion Forecast, by Region 2019 & 2032
- Table 2: Global 3D Printing In Dental Industry Revenue Billion Forecast, by Technology 2019 & 2032
- Table 3: Global 3D Printing In Dental Industry Revenue Billion Forecast, by Product & Service 2019 & 2032
- Table 4: Global 3D Printing In Dental Industry Revenue Billion Forecast, by Application 2019 & 2032
- Table 5: Global 3D Printing In Dental Industry Revenue Billion Forecast, by End User 2019 & 2032
- Table 6: Global 3D Printing In Dental Industry Revenue Billion Forecast, by Region 2019 & 2032
- Table 7: Global 3D Printing In Dental Industry Revenue Billion Forecast, by Country 2019 & 2032
- Table 8: United States 3D Printing In Dental Industry Revenue (Billion) Forecast, by Application 2019 & 2032
- Table 9: Canada 3D Printing In Dental Industry Revenue (Billion) Forecast, by Application 2019 & 2032
- Table 10: Mexico 3D Printing In Dental Industry Revenue (Billion) Forecast, by Application 2019 & 2032
- Table 11: Global 3D Printing In Dental Industry Revenue Billion Forecast, by Country 2019 & 2032
- Table 12: Brazil 3D Printing In Dental Industry Revenue (Billion) Forecast, by Application 2019 & 2032
- Table 13: Mexico 3D Printing In Dental Industry Revenue (Billion) Forecast, by Application 2019 & 2032
- Table 14: Rest of South America 3D Printing In Dental Industry Revenue (Billion) Forecast, by Application 2019 & 2032
- Table 15: Global 3D Printing In Dental Industry Revenue Billion Forecast, by Country 2019 & 2032
- Table 16: Germany 3D Printing In Dental Industry Revenue (Billion) Forecast, by Application 2019 & 2032
- Table 17: United Kingdom 3D Printing In Dental Industry Revenue (Billion) Forecast, by Application 2019 & 2032
- Table 18: France 3D Printing In Dental Industry Revenue (Billion) Forecast, by Application 2019 & 2032
- Table 19: Italy 3D Printing In Dental Industry Revenue (Billion) Forecast, by Application 2019 & 2032
- Table 20: Spain 3D Printing In Dental Industry Revenue (Billion) Forecast, by Application 2019 & 2032
- Table 21: Rest of Europe 3D Printing In Dental Industry Revenue (Billion) Forecast, by Application 2019 & 2032
- Table 22: Global 3D Printing In Dental Industry Revenue Billion Forecast, by Country 2019 & 2032
- Table 23: China 3D Printing In Dental Industry Revenue (Billion) Forecast, by Application 2019 & 2032
- Table 24: Japan 3D Printing In Dental Industry Revenue (Billion) Forecast, by Application 2019 & 2032
- Table 25: India 3D Printing In Dental Industry Revenue (Billion) Forecast, by Application 2019 & 2032
- Table 26: South Korea 3D Printing In Dental Industry Revenue (Billion) Forecast, by Application 2019 & 2032
- Table 27: Taiwan 3D Printing In Dental Industry Revenue (Billion) Forecast, by Application 2019 & 2032
- Table 28: Australia 3D Printing In Dental Industry Revenue (Billion) Forecast, by Application 2019 & 2032
- Table 29: Rest of Asia-Pacific 3D Printing In Dental Industry Revenue (Billion) Forecast, by Application 2019 & 2032
- Table 30: Global 3D Printing In Dental Industry Revenue Billion Forecast, by Country 2019 & 2032
- Table 31: Middle East 3D Printing In Dental Industry Revenue (Billion) Forecast, by Application 2019 & 2032
- Table 32: Africa 3D Printing In Dental Industry Revenue (Billion) Forecast, by Application 2019 & 2032
- Table 33: Global 3D Printing In Dental Industry Revenue Billion Forecast, by Technology 2019 & 2032
- Table 34: Global 3D Printing In Dental Industry Revenue Billion Forecast, by Product & Service 2019 & 2032
- Table 35: Global 3D Printing In Dental Industry Revenue Billion Forecast, by Application 2019 & 2032
- Table 36: Global 3D Printing In Dental Industry Revenue Billion Forecast, by End User 2019 & 2032
- Table 37: Global 3D Printing In Dental Industry Revenue Billion Forecast, by Country 2019 & 2032
- Table 38: United States 3D Printing In Dental Industry Revenue (Billion) Forecast, by Application 2019 & 2032
- Table 39: Canada 3D Printing In Dental Industry Revenue (Billion) Forecast, by Application 2019 & 2032
- Table 40: Mexico 3D Printing In Dental Industry Revenue (Billion) Forecast, by Application 2019 & 2032
- Table 41: Global 3D Printing In Dental Industry Revenue Billion Forecast, by Technology 2019 & 2032
- Table 42: Global 3D Printing In Dental Industry Revenue Billion Forecast, by Product & Service 2019 & 2032
- Table 43: Global 3D Printing In Dental Industry Revenue Billion Forecast, by Application 2019 & 2032
- Table 44: Global 3D Printing In Dental Industry Revenue Billion Forecast, by End User 2019 & 2032
- Table 45: Global 3D Printing In Dental Industry Revenue Billion Forecast, by Country 2019 & 2032
- Table 46: Germany 3D Printing In Dental Industry Revenue (Billion) Forecast, by Application 2019 & 2032
- Table 47: United Kingdom 3D Printing In Dental Industry Revenue (Billion) Forecast, by Application 2019 & 2032
- Table 48: France 3D Printing In Dental Industry Revenue (Billion) Forecast, by Application 2019 & 2032
- Table 49: Italy 3D Printing In Dental Industry Revenue (Billion) Forecast, by Application 2019 & 2032
- Table 50: Spain 3D Printing In Dental Industry Revenue (Billion) Forecast, by Application 2019 & 2032
- Table 51: Rest of Europe 3D Printing In Dental Industry Revenue (Billion) Forecast, by Application 2019 & 2032
- Table 52: Global 3D Printing In Dental Industry Revenue Billion Forecast, by Technology 2019 & 2032
- Table 53: Global 3D Printing In Dental Industry Revenue Billion Forecast, by Product & Service 2019 & 2032
- Table 54: Global 3D Printing In Dental Industry Revenue Billion Forecast, by Application 2019 & 2032
- Table 55: Global 3D Printing In Dental Industry Revenue Billion Forecast, by End User 2019 & 2032
- Table 56: Global 3D Printing In Dental Industry Revenue Billion Forecast, by Country 2019 & 2032
- Table 57: China 3D Printing In Dental Industry Revenue (Billion) Forecast, by Application 2019 & 2032
- Table 58: Japan 3D Printing In Dental Industry Revenue (Billion) Forecast, by Application 2019 & 2032
- Table 59: India 3D Printing In Dental Industry Revenue (Billion) Forecast, by Application 2019 & 2032
- Table 60: Australia 3D Printing In Dental Industry Revenue (Billion) Forecast, by Application 2019 & 2032
- Table 61: South Korea 3D Printing In Dental Industry Revenue (Billion) Forecast, by Application 2019 & 2032
- Table 62: Rest of Asia Pacific 3D Printing In Dental Industry Revenue (Billion) Forecast, by Application 2019 & 2032
- Table 63: Global 3D Printing In Dental Industry Revenue Billion Forecast, by Technology 2019 & 2032
- Table 64: Global 3D Printing In Dental Industry Revenue Billion Forecast, by Product & Service 2019 & 2032
- Table 65: Global 3D Printing In Dental Industry Revenue Billion Forecast, by Application 2019 & 2032
- Table 66: Global 3D Printing In Dental Industry Revenue Billion Forecast, by End User 2019 & 2032
- Table 67: Global 3D Printing In Dental Industry Revenue Billion Forecast, by Country 2019 & 2032
- Table 68: GCC 3D Printing In Dental Industry Revenue (Billion) Forecast, by Application 2019 & 2032
- Table 69: South Africa 3D Printing In Dental Industry Revenue (Billion) Forecast, by Application 2019 & 2032
- Table 70: Rest of Middle East and Africa 3D Printing In Dental Industry Revenue (Billion) Forecast, by Application 2019 & 2032
- Table 71: Global 3D Printing In Dental Industry Revenue Billion Forecast, by Technology 2019 & 2032
- Table 72: Global 3D Printing In Dental Industry Revenue Billion Forecast, by Product & Service 2019 & 2032
- Table 73: Global 3D Printing In Dental Industry Revenue Billion Forecast, by Application 2019 & 2032
- Table 74: Global 3D Printing In Dental Industry Revenue Billion Forecast, by End User 2019 & 2032
- Table 75: Global 3D Printing In Dental Industry Revenue Billion Forecast, by Country 2019 & 2032
- Table 76: Brazil 3D Printing In Dental Industry Revenue (Billion) Forecast, by Application 2019 & 2032
- Table 77: Argentina 3D Printing In Dental Industry Revenue (Billion) Forecast, by Application 2019 & 2032
- Table 78: Rest of South America 3D Printing In Dental Industry Revenue (Billion) Forecast, by Application 2019 & 2032
Frequently Asked Questions
1. What is the projected Compound Annual Growth Rate (CAGR) of the 3D Printing In Dental Industry?
The projected CAGR is approximately 19.50%.
2. Which companies are prominent players in the 3D Printing In Dental Industry?
Key companies in the market include GENERAL ELECTRIC, Desktop Metal Inc (EnvisionTEC), Zortrax, NextDent B V, Formlabs, SprintRay Inc, Asiga*List Not Exhaustive, Rapid Shape GmbH, 3D Systems Inc, Renishaw plc, Ackuretta, Institut Straumann AG, Nexa3D, Stratasys, Quoris3D.
3. What are the main segments of the 3D Printing In Dental Industry?
The market segments include Technology, Product & Service, Application, End User.
4. Can you provide details about the market size?
The market size is estimated to be USD XX Billion as of 2022.
5. What are some drivers contributing to market growth?
Increasing Incidence of Dental Caries and Other Dental Diseases; Rising Demand for Cosmetic Dentistry; Growing Adoption of Dental 3D Printers due to the Advantages it Offers.
6. What are the notable trends driving market growth?
The Orthodontics Segment is Expected to Hold a Major Market Share in the Dental 3D Printing Market.
7. Are there any restraints impacting market growth?
High Cost of Electroceutical Devices.
8. Can you provide examples of recent developments in the market?
In March 2022, Dentsply Sirona, a multinational dental product manufacturer, introduced a new Primeprint 3D printer and post-processing unit. Powered by a 385nm light engine, the newly-unveiled printer is designed to enable dentists to produce accurate models, guides, provisionals, or splints as simply as possible.
9. What pricing options are available for accessing the report?
Pricing options include single-user, multi-user, and enterprise licenses priced at USD 4750, USD 5250, and USD 8750 respectively.
10. Is the market size provided in terms of value or volume?
The market size is provided in terms of value, measured in Billion.
11. Are there any specific market keywords associated with the report?
Yes, the market keyword associated with the report is "3D Printing In Dental Industry," which aids in identifying and referencing the specific market segment covered.
12. How do I determine which pricing option suits my needs best?
The pricing options vary based on user requirements and access needs. Individual users may opt for single-user licenses, while businesses requiring broader access may choose multi-user or enterprise licenses for cost-effective access to the report.
13. Are there any additional resources or data provided in the 3D Printing In Dental Industry report?
While the report offers comprehensive insights, it's advisable to review the specific contents or supplementary materials provided to ascertain if additional resources or data are available.
14. How can I stay updated on further developments or reports in the 3D Printing In Dental Industry?
To stay informed about further developments, trends, and reports in the 3D Printing In Dental Industry, consider subscribing to industry newsletters, following relevant companies and organizations, or regularly checking reputable industry news sources and publications.
Methodology
Step 1 - Identification of Relevant Samples Size from Population Database


Step 2 - Approaches for Defining Global Market Size (Value, Volume* & Price*)

Note*: In applicable scenarios
Step 3 - Data Sources
Primary Research
- Web Analytics
- Survey Reports
- Research Institute
- Latest Research Reports
- Opinion Leaders
Secondary Research
- Annual Reports
- White Paper
- Latest Press Release
- Industry Association
- Paid Database
- Investor Presentations

Step 4 - Data Triangulation
Involves using different sources of information in order to increase the validity of a study
These sources are likely to be stakeholders in a program - participants, other researchers, program staff, other community members, and so on.
Then we put all data in single framework & apply various statistical tools to find out the dynamic on the market.
During the analysis stage, feedback from the stakeholder groups would be compared to determine areas of agreement as well as areas of divergence


