
Key Insights
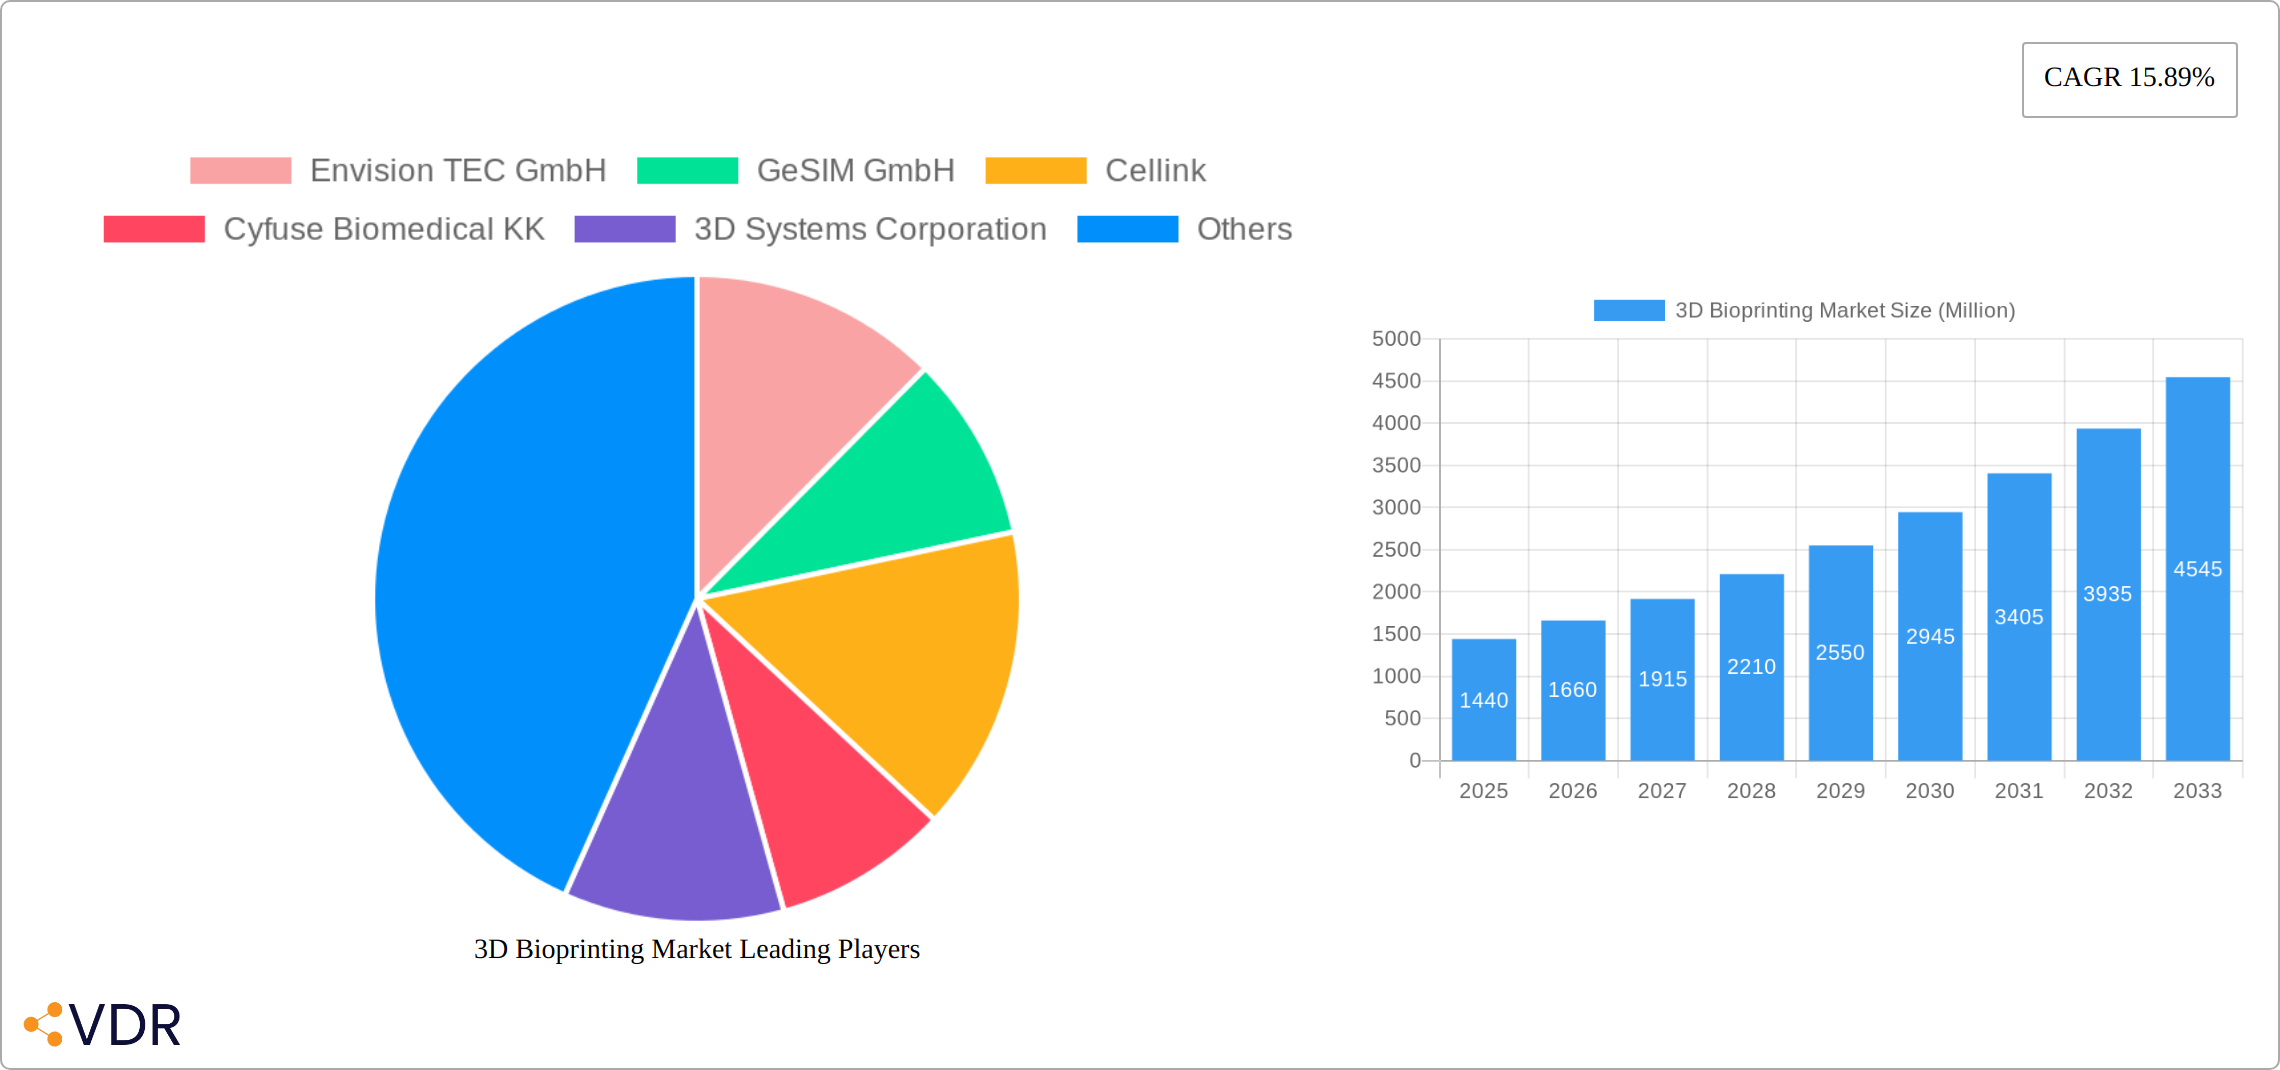
The 3D bioprinting market, valued at $1.44 billion in 2025, is projected to experience robust growth, exhibiting a Compound Annual Growth Rate (CAGR) of 15.89% from 2025 to 2033. This expansion is driven by several key factors. Advancements in bioink technology and bioprinting techniques are enabling the creation of increasingly complex and functional tissues and organs, fueling applications in regenerative medicine. The rising prevalence of chronic diseases and the increasing demand for personalized medicine are further bolstering market growth. Pharmaceutical companies are also adopting 3D bioprinting for drug discovery and development, accelerating the pace of innovation and reducing development costs. The market segmentation reveals a significant contribution from regenerative medicine applications, followed by drug testing and development. Syringe/extrusion bioprinting currently holds a dominant share of the technology segment, although other technologies like inkjet and laser-assisted bioprinting are gaining traction due to their enhanced precision and versatility. North America currently leads the market, benefiting from robust research infrastructure and high healthcare expenditure. However, Asia Pacific is expected to witness significant growth in the coming years due to increasing investments in healthcare infrastructure and technological advancements. Competitive landscape analysis shows a mix of established players and emerging startups, indicating a dynamic and evolving market.
The restraining factors affecting market growth include the high cost of 3D bioprinters and biomaterials, regulatory hurdles related to the adoption of bioprinted tissues and organs, and the need for further technological advancements to enhance the scalability and reproducibility of bioprinting processes. Despite these challenges, the long-term prospects for the 3D bioprinting market remain extremely positive. Ongoing research and development efforts focused on improving bioink composition, enhancing printing resolution, and developing more efficient bioprinting technologies will continue to drive market growth and expand the applications of 3D bioprinting across various sectors. The increasing adoption of 3D bioprinting in personalized medicine and drug development will also be pivotal in shaping the future of this rapidly evolving industry.
3D Bioprinting Market Market Dynamics & Structure
The 3D bioprinting market is experiencing rapid growth, driven by technological advancements and increasing demand across diverse applications. Market concentration is moderate, with several key players holding significant shares, but a landscape characterized by both established corporations and innovative startups. Technological innovation is a primary driver, with continuous improvements in bioprinting technologies, biomaterials, and software solutions. Regulatory frameworks, while still evolving, are increasingly supportive of 3D bioprinting's use in healthcare and research. Competitive product substitutes are limited, bolstering the market's growth trajectory. End-user demographics include pharmaceutical companies, research institutions, hospitals, and biotech firms, with a significant portion of the market focused on regenerative medicine and drug discovery. M&A activity remains a key trend, reflecting industry consolidation and the acquisition of smaller companies with specialized technologies.
- Market Concentration: Moderately concentrated, with top 5 players holding approximately xx% of market share in 2025.
- Technological Innovation: Continuous advancements in bioink formulations, printing resolution, and software integration.
- Regulatory Landscape: Increasingly favorable regulations in key regions, facilitating wider adoption.
- Competitive Substitutes: Limited direct substitutes for 3D bioprinting's unique capabilities.
- M&A Activity: xx M&A deals in the past 5 years, indicative of industry consolidation.
- Innovation Barriers: High upfront investment for R&D and specialized infrastructure, stringent regulatory approvals.
3D Bioprinting Market Growth Trends & Insights
The 3D bioprinting market is poised for explosive growth, projecting a robust Compound Annual Growth Rate (CAGR) of [Insert Updated CAGR]% during the forecast period (2025-2033). Market size is anticipated to reach [Insert Updated Market Size in Million Units] by 2033, a significant increase from [Insert Updated 2025 Market Size in Million Units] in 2025. This expansion is driven by several key factors: widespread adoption across diverse sectors, fueled by continuous technological advancements and a growing appreciation for 3D bioprinting's transformative potential in healthcare and beyond. Groundbreaking innovations, such as the development of bioinks with enhanced biocompatibility and novel printing techniques offering greater precision and speed, are accelerating market penetration and unlocking new applications.
Furthermore, evolving consumer preferences are evident in the surging demand for personalized medicine and regenerative therapies. This shift, coupled with the rising prevalence of chronic diseases and the consequent need for advanced therapeutic solutions, is a major catalyst for market growth. The increasing adoption of organ-on-a-chip models in drug discovery and development further reinforces the market's upward trajectory.
Dominant Regions, Countries, or Segments in 3D Bioprinting Market
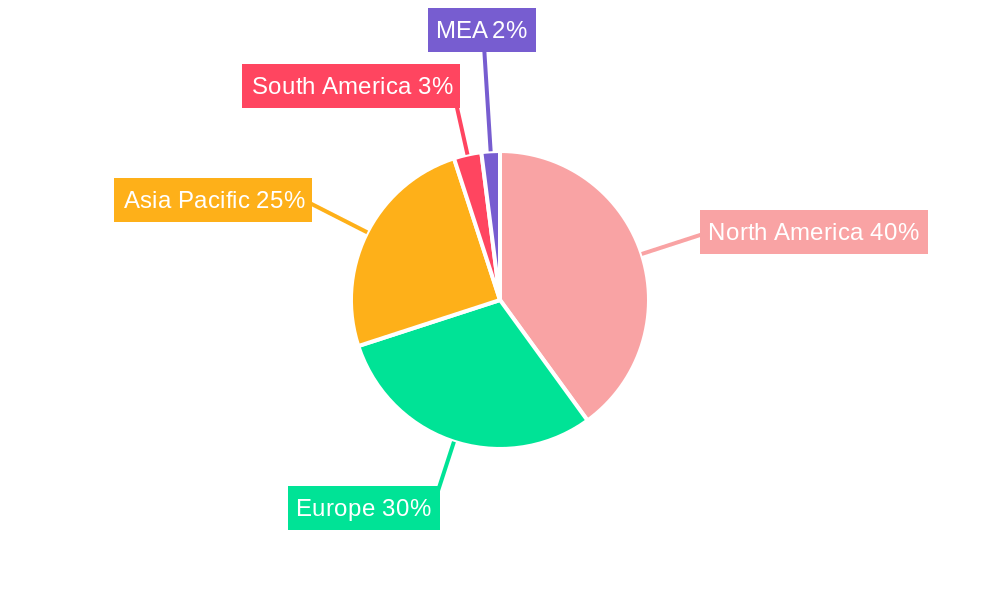
North America currently dominates the 3D bioprinting market, capturing the largest market share. This leadership position is attributable to substantial investments in research and development (R&D), the presence of key industry players, and a supportive regulatory environment. Europe follows closely behind, with both regions exhibiting strong growth potential. A more detailed segment breakdown reveals the following:
- By Component: 3D bioprinters constitute the largest segment, followed by biomaterials (including bioinks and scaffolds). This reflects the high demand for both the core printing equipment and the essential materials required for bioprinting applications.
- By Application: Regenerative medicine remains the leading application segment, showcasing the immense potential of 3D bioprinting in tissue engineering and organ replacement. Drug testing and development are also significant application areas, leveraging the technology for efficient and accurate drug screening and personalized medicine development.
- By Technology: Inkjet and syringe/extrusion bioprinting currently hold the largest market shares due to their established technological maturity, reliability, and relative cost-effectiveness. However, other emerging technologies are gaining traction and are expected to contribute significantly to market growth in the coming years.
Key drivers propelling growth in North America and Europe include:
- Robust Healthcare Infrastructure: Well-established healthcare systems and a large network of research institutions foster innovation and collaboration.
- Favorable Regulatory Environment: Supportive regulatory frameworks and policies accelerate the adoption of innovative bioprinting technologies.
- High Investments in R&D: Significant funding for research and development in bioprinting fuels technological advancements and expands application possibilities.
3D Bioprinting Market Product Landscape
The 3D bioprinting market showcases a diverse product landscape encompassing high-resolution bioprinters, biocompatible inks with enhanced cell viability and functionalities, and sophisticated software solutions for designing and controlling bioprinting processes. Recent innovations include bioinks with improved bioactivity and novel printing techniques for producing complex 3D structures. Key products are differentiated by printing resolution, speed, bioink compatibility, and software integration, impacting their suitability for specific applications. Unique selling propositions often center on specialized bioinks, high-precision printing, and streamlined workflows. Technological advancements focus on improving printing speed, resolution, and the creation of more complex and functional bioprinted tissues and organs.
Key Drivers, Barriers & Challenges in 3D Bioprinting Market
Key Drivers:
- Technological advancements in bioinks, printing techniques, and software.
- Rising demand for personalized medicine and regenerative therapies.
- Increasing investments in R&D and industry collaborations.
Key Challenges & Restraints:
- High costs associated with equipment and biomaterials.
- Stringent regulatory approvals for bioprinted products.
- Limited skilled workforce and expertise in 3D bioprinting technology. The lack of skilled professionals presents a challenge to adoption and implementation, which could hinder market growth by delaying the widespread use of 3D bioprinting technologies. This could result in a slower expansion of the market compared to other life science sectors where skilled labor is more readily available.
Emerging Opportunities in 3D Bioprinting Market
Significant emerging opportunities abound within the 3D bioprinting market. The development of novel bioinks with improved biocompatibility, enhanced functionality, and increased cell viability is a key area of focus. Expansion into new applications, such as personalized drug screening, the creation of complex organ models for disease modeling and drug testing, and the bioprinting of personalized implants, presents substantial growth potential. Making bioprinters and biomaterials more cost-effective will broaden market access, particularly in developing nations. Furthermore, ongoing research into the long-term effects of bioprinted tissues and organs is crucial for building confidence and accelerating widespread adoption.
Growth Accelerators in the 3D Bioprinting Market Industry
Strategic partnerships between research institutions, pharmaceutical companies, and 3D bioprinting companies are accelerating innovation and market penetration. Government initiatives and funding programs are boosting R&D efforts, while advancements in biomaterial science and printing technologies are continuously improving bioprinting capabilities. The increasing applications of 3D bioprinting, especially in personalized medicine, drug discovery, and tissue engineering, will drive long-term growth and expansion into new therapeutic areas.
Key Players Shaping the 3D Bioprinting Market Market
- Envision TEC GmbH
- GeSIM GmbH
- Cellink
- Cyfuse Biomedical KK
- 3D Systems Corporation
- 3D Bioprinting Solutions
- Arcam AB (GE Company)
- RegenHU SA
- Organovo Holdings Inc
- Stratasys Ltd
- Aspect Biosystems Ltd
- REGEMAT 3D
- [Add other key players as needed]
Notable Milestones in 3D Bioprinting Market Sector
- SEP 2022: 3D Systems launched Systemic Bio, a subsidiary focused on accelerating drug discovery and development using 3D bioprinting, potentially generating USD 100 million annually within five years.
- MAY 2022: Regemat 3D secured over EUR 500,000 in funding to advance its 3D bioprinting technology, expanding its product portfolio and capabilities in disease modeling and drug testing.
In-Depth 3D Bioprinting Market Market Outlook
The 3D bioprinting market is poised for sustained growth, driven by continuous technological advancements, increasing research and development investments, and the expanding applications across diverse sectors. The potential to personalize medicine and create more efficient and effective drug discovery processes will be significant drivers of market expansion. Strategic partnerships and collaborations will play a vital role in accelerating innovation and translating laboratory discoveries into commercially viable products. Addressing challenges related to cost, regulatory approvals, and skilled labor will be crucial in maximizing the market's growth potential.
3D Bioprinting Market Segmentation
-
1. Technology
- 1.1. Syringe/Extrusion Bioprinting
- 1.2. Inkjet Bioprinting
- 1.3. Magnetic Levitation Bioprinting
- 1.4. Laser-assisted Bioprinting
- 1.5. Other Technologies
-
2. Component
- 2.1. 3D Bioprinters
- 2.2. Biomaterials
- 2.3. Scaffolds
-
3. Application
- 3.1. Drug Testing and Development
- 3.2. Regenerative Medicine
- 3.3. Food Testing
- 3.4. Research
- 3.5. Other Applications
3D Bioprinting Market Segmentation By Geography
-
1. North America
- 1.1. United States
- 1.2. Canada
-
2. Europe
- 2.1. United Kingdom
- 2.2. Germany
- 2.3. France
- 2.4. Rest of Europe
-
3. Asia Pacific
- 3.1. China
- 3.2. Japan
- 3.3. India
- 3.4. Rest of Asia Pacific
- 4. Rest of the World
3D Bioprinting Market REPORT HIGHLIGHTS
| Aspects | Details |
|---|---|
| Study Period | 2019-2033 |
| Base Year | 2024 |
| Estimated Year | 2025 |
| Forecast Period | 2025-2033 |
| Historical Period | 2019-2024 |
| Growth Rate | CAGR of 15.89% from 2019-2033 |
| Segmentation |
|
Table of Contents
- 1. Introduction
- 1.1. Research Scope
- 1.2. Market Segmentation
- 1.3. Research Methodology
- 1.4. Definitions and Assumptions
- 2. Executive Summary
- 2.1. Introduction
- 3. Market Dynamics
- 3.1. Introduction
- 3.2. Market Drivers
- 3.2.1. Increasing Geriatric Population; Increasing Investments in R&D
- 3.3. Market Restrains
- 3.3.1. Low Awareness and Regulatory Framework; Competition from Traditional Sports Betting
- 3.4. Market Trends
- 3.4.1. Drug Testing and Development to Hold Significant Market Share
- 4. Market Factor Analysis
- 4.1. Porters Five Forces
- 4.2. Supply/Value Chain
- 4.3. PESTEL analysis
- 4.4. Market Entropy
- 4.5. Patent/Trademark Analysis
- 5. Global 3D Bioprinting Market Analysis, Insights and Forecast, 2019-2031
- 5.1. Market Analysis, Insights and Forecast - by Technology
- 5.1.1. Syringe/Extrusion Bioprinting
- 5.1.2. Inkjet Bioprinting
- 5.1.3. Magnetic Levitation Bioprinting
- 5.1.4. Laser-assisted Bioprinting
- 5.1.5. Other Technologies
- 5.2. Market Analysis, Insights and Forecast - by Component
- 5.2.1. 3D Bioprinters
- 5.2.2. Biomaterials
- 5.2.3. Scaffolds
- 5.3. Market Analysis, Insights and Forecast - by Application
- 5.3.1. Drug Testing and Development
- 5.3.2. Regenerative Medicine
- 5.3.3. Food Testing
- 5.3.4. Research
- 5.3.5. Other Applications
- 5.4. Market Analysis, Insights and Forecast - by Region
- 5.4.1. North America
- 5.4.2. Europe
- 5.4.3. Asia Pacific
- 5.4.4. Rest of the World
- 5.1. Market Analysis, Insights and Forecast - by Technology
- 6. North America 3D Bioprinting Market Analysis, Insights and Forecast, 2019-2031
- 6.1. Market Analysis, Insights and Forecast - by Technology
- 6.1.1. Syringe/Extrusion Bioprinting
- 6.1.2. Inkjet Bioprinting
- 6.1.3. Magnetic Levitation Bioprinting
- 6.1.4. Laser-assisted Bioprinting
- 6.1.5. Other Technologies
- 6.2. Market Analysis, Insights and Forecast - by Component
- 6.2.1. 3D Bioprinters
- 6.2.2. Biomaterials
- 6.2.3. Scaffolds
- 6.3. Market Analysis, Insights and Forecast - by Application
- 6.3.1. Drug Testing and Development
- 6.3.2. Regenerative Medicine
- 6.3.3. Food Testing
- 6.3.4. Research
- 6.3.5. Other Applications
- 6.1. Market Analysis, Insights and Forecast - by Technology
- 7. Europe 3D Bioprinting Market Analysis, Insights and Forecast, 2019-2031
- 7.1. Market Analysis, Insights and Forecast - by Technology
- 7.1.1. Syringe/Extrusion Bioprinting
- 7.1.2. Inkjet Bioprinting
- 7.1.3. Magnetic Levitation Bioprinting
- 7.1.4. Laser-assisted Bioprinting
- 7.1.5. Other Technologies
- 7.2. Market Analysis, Insights and Forecast - by Component
- 7.2.1. 3D Bioprinters
- 7.2.2. Biomaterials
- 7.2.3. Scaffolds
- 7.3. Market Analysis, Insights and Forecast - by Application
- 7.3.1. Drug Testing and Development
- 7.3.2. Regenerative Medicine
- 7.3.3. Food Testing
- 7.3.4. Research
- 7.3.5. Other Applications
- 7.1. Market Analysis, Insights and Forecast - by Technology
- 8. Asia Pacific 3D Bioprinting Market Analysis, Insights and Forecast, 2019-2031
- 8.1. Market Analysis, Insights and Forecast - by Technology
- 8.1.1. Syringe/Extrusion Bioprinting
- 8.1.2. Inkjet Bioprinting
- 8.1.3. Magnetic Levitation Bioprinting
- 8.1.4. Laser-assisted Bioprinting
- 8.1.5. Other Technologies
- 8.2. Market Analysis, Insights and Forecast - by Component
- 8.2.1. 3D Bioprinters
- 8.2.2. Biomaterials
- 8.2.3. Scaffolds
- 8.3. Market Analysis, Insights and Forecast - by Application
- 8.3.1. Drug Testing and Development
- 8.3.2. Regenerative Medicine
- 8.3.3. Food Testing
- 8.3.4. Research
- 8.3.5. Other Applications
- 8.1. Market Analysis, Insights and Forecast - by Technology
- 9. Rest of the World 3D Bioprinting Market Analysis, Insights and Forecast, 2019-2031
- 9.1. Market Analysis, Insights and Forecast - by Technology
- 9.1.1. Syringe/Extrusion Bioprinting
- 9.1.2. Inkjet Bioprinting
- 9.1.3. Magnetic Levitation Bioprinting
- 9.1.4. Laser-assisted Bioprinting
- 9.1.5. Other Technologies
- 9.2. Market Analysis, Insights and Forecast - by Component
- 9.2.1. 3D Bioprinters
- 9.2.2. Biomaterials
- 9.2.3. Scaffolds
- 9.3. Market Analysis, Insights and Forecast - by Application
- 9.3.1. Drug Testing and Development
- 9.3.2. Regenerative Medicine
- 9.3.3. Food Testing
- 9.3.4. Research
- 9.3.5. Other Applications
- 9.1. Market Analysis, Insights and Forecast - by Technology
- 10. North America 3D Bioprinting Market Analysis, Insights and Forecast, 2019-2031
- 10.1. Market Analysis, Insights and Forecast - By Country/Sub-region
- 10.1.1 United States
- 10.1.2 Canada
- 10.1.3 Mexico
- 11. Europe 3D Bioprinting Market Analysis, Insights and Forecast, 2019-2031
- 11.1. Market Analysis, Insights and Forecast - By Country/Sub-region
- 11.1.1 Germany
- 11.1.2 United Kingdom
- 11.1.3 France
- 11.1.4 Spain
- 11.1.5 Italy
- 11.1.6 Spain
- 11.1.7 Belgium
- 11.1.8 Netherland
- 11.1.9 Nordics
- 11.1.10 Rest of Europe
- 12. Asia Pacific 3D Bioprinting Market Analysis, Insights and Forecast, 2019-2031
- 12.1. Market Analysis, Insights and Forecast - By Country/Sub-region
- 12.1.1 China
- 12.1.2 Japan
- 12.1.3 India
- 12.1.4 South Korea
- 12.1.5 Southeast Asia
- 12.1.6 Australia
- 12.1.7 Indonesia
- 12.1.8 Phillipes
- 12.1.9 Singapore
- 12.1.10 Thailandc
- 12.1.11 Rest of Asia Pacific
- 13. South America 3D Bioprinting Market Analysis, Insights and Forecast, 2019-2031
- 13.1. Market Analysis, Insights and Forecast - By Country/Sub-region
- 13.1.1 Brazil
- 13.1.2 Argentina
- 13.1.3 Peru
- 13.1.4 Chile
- 13.1.5 Colombia
- 13.1.6 Ecuador
- 13.1.7 Venezuela
- 13.1.8 Rest of South America
- 14. North America 3D Bioprinting Market Analysis, Insights and Forecast, 2019-2031
- 14.1. Market Analysis, Insights and Forecast - By Country/Sub-region
- 14.1.1 United States
- 14.1.2 Canada
- 14.1.3 Mexico
- 15. MEA 3D Bioprinting Market Analysis, Insights and Forecast, 2019-2031
- 15.1. Market Analysis, Insights and Forecast - By Country/Sub-region
- 15.1.1 United Arab Emirates
- 15.1.2 Saudi Arabia
- 15.1.3 South Africa
- 15.1.4 Rest of Middle East and Africa
- 16. Competitive Analysis
- 16.1. Global Market Share Analysis 2024
- 16.2. Company Profiles
- 16.2.1 Envision TEC GmbH
- 16.2.1.1. Overview
- 16.2.1.2. Products
- 16.2.1.3. SWOT Analysis
- 16.2.1.4. Recent Developments
- 16.2.1.5. Financials (Based on Availability)
- 16.2.2 GeSIM GmbH
- 16.2.2.1. Overview
- 16.2.2.2. Products
- 16.2.2.3. SWOT Analysis
- 16.2.2.4. Recent Developments
- 16.2.2.5. Financials (Based on Availability)
- 16.2.3 Cellink
- 16.2.3.1. Overview
- 16.2.3.2. Products
- 16.2.3.3. SWOT Analysis
- 16.2.3.4. Recent Developments
- 16.2.3.5. Financials (Based on Availability)
- 16.2.4 Cyfuse Biomedical KK
- 16.2.4.1. Overview
- 16.2.4.2. Products
- 16.2.4.3. SWOT Analysis
- 16.2.4.4. Recent Developments
- 16.2.4.5. Financials (Based on Availability)
- 16.2.5 3D Systems Corporation
- 16.2.5.1. Overview
- 16.2.5.2. Products
- 16.2.5.3. SWOT Analysis
- 16.2.5.4. Recent Developments
- 16.2.5.5. Financials (Based on Availability)
- 16.2.6 3D Bioprinting Solutions
- 16.2.6.1. Overview
- 16.2.6.2. Products
- 16.2.6.3. SWOT Analysis
- 16.2.6.4. Recent Developments
- 16.2.6.5. Financials (Based on Availability)
- 16.2.7 Arcam AB (GE Company)
- 16.2.7.1. Overview
- 16.2.7.2. Products
- 16.2.7.3. SWOT Analysis
- 16.2.7.4. Recent Developments
- 16.2.7.5. Financials (Based on Availability)
- 16.2.8 RegenHU SA
- 16.2.8.1. Overview
- 16.2.8.2. Products
- 16.2.8.3. SWOT Analysis
- 16.2.8.4. Recent Developments
- 16.2.8.5. Financials (Based on Availability)
- 16.2.9 Organovo Holdings Inc
- 16.2.9.1. Overview
- 16.2.9.2. Products
- 16.2.9.3. SWOT Analysis
- 16.2.9.4. Recent Developments
- 16.2.9.5. Financials (Based on Availability)
- 16.2.10 Stratasys Ltd
- 16.2.10.1. Overview
- 16.2.10.2. Products
- 16.2.10.3. SWOT Analysis
- 16.2.10.4. Recent Developments
- 16.2.10.5. Financials (Based on Availability)
- 16.2.11 Aspect Biosystems Ltd
- 16.2.11.1. Overview
- 16.2.11.2. Products
- 16.2.11.3. SWOT Analysis
- 16.2.11.4. Recent Developments
- 16.2.11.5. Financials (Based on Availability)
- 16.2.12 REGEMAT 3D
- 16.2.12.1. Overview
- 16.2.12.2. Products
- 16.2.12.3. SWOT Analysis
- 16.2.12.4. Recent Developments
- 16.2.12.5. Financials (Based on Availability)
- 16.2.1 Envision TEC GmbH
List of Figures
- Figure 1: Global 3D Bioprinting Market Revenue Breakdown (Million, %) by Region 2024 & 2032
- Figure 2: Global 3D Bioprinting Market Volume Breakdown (K Unit, %) by Region 2024 & 2032
- Figure 3: North America 3D Bioprinting Market Revenue (Million), by Country 2024 & 2032
- Figure 4: North America 3D Bioprinting Market Volume (K Unit), by Country 2024 & 2032
- Figure 5: North America 3D Bioprinting Market Revenue Share (%), by Country 2024 & 2032
- Figure 6: North America 3D Bioprinting Market Volume Share (%), by Country 2024 & 2032
- Figure 7: Europe 3D Bioprinting Market Revenue (Million), by Country 2024 & 2032
- Figure 8: Europe 3D Bioprinting Market Volume (K Unit), by Country 2024 & 2032
- Figure 9: Europe 3D Bioprinting Market Revenue Share (%), by Country 2024 & 2032
- Figure 10: Europe 3D Bioprinting Market Volume Share (%), by Country 2024 & 2032
- Figure 11: Asia Pacific 3D Bioprinting Market Revenue (Million), by Country 2024 & 2032
- Figure 12: Asia Pacific 3D Bioprinting Market Volume (K Unit), by Country 2024 & 2032
- Figure 13: Asia Pacific 3D Bioprinting Market Revenue Share (%), by Country 2024 & 2032
- Figure 14: Asia Pacific 3D Bioprinting Market Volume Share (%), by Country 2024 & 2032
- Figure 15: South America 3D Bioprinting Market Revenue (Million), by Country 2024 & 2032
- Figure 16: South America 3D Bioprinting Market Volume (K Unit), by Country 2024 & 2032
- Figure 17: South America 3D Bioprinting Market Revenue Share (%), by Country 2024 & 2032
- Figure 18: South America 3D Bioprinting Market Volume Share (%), by Country 2024 & 2032
- Figure 19: North America 3D Bioprinting Market Revenue (Million), by Country 2024 & 2032
- Figure 20: North America 3D Bioprinting Market Volume (K Unit), by Country 2024 & 2032
- Figure 21: North America 3D Bioprinting Market Revenue Share (%), by Country 2024 & 2032
- Figure 22: North America 3D Bioprinting Market Volume Share (%), by Country 2024 & 2032
- Figure 23: MEA 3D Bioprinting Market Revenue (Million), by Country 2024 & 2032
- Figure 24: MEA 3D Bioprinting Market Volume (K Unit), by Country 2024 & 2032
- Figure 25: MEA 3D Bioprinting Market Revenue Share (%), by Country 2024 & 2032
- Figure 26: MEA 3D Bioprinting Market Volume Share (%), by Country 2024 & 2032
- Figure 27: North America 3D Bioprinting Market Revenue (Million), by Technology 2024 & 2032
- Figure 28: North America 3D Bioprinting Market Volume (K Unit), by Technology 2024 & 2032
- Figure 29: North America 3D Bioprinting Market Revenue Share (%), by Technology 2024 & 2032
- Figure 30: North America 3D Bioprinting Market Volume Share (%), by Technology 2024 & 2032
- Figure 31: North America 3D Bioprinting Market Revenue (Million), by Component 2024 & 2032
- Figure 32: North America 3D Bioprinting Market Volume (K Unit), by Component 2024 & 2032
- Figure 33: North America 3D Bioprinting Market Revenue Share (%), by Component 2024 & 2032
- Figure 34: North America 3D Bioprinting Market Volume Share (%), by Component 2024 & 2032
- Figure 35: North America 3D Bioprinting Market Revenue (Million), by Application 2024 & 2032
- Figure 36: North America 3D Bioprinting Market Volume (K Unit), by Application 2024 & 2032
- Figure 37: North America 3D Bioprinting Market Revenue Share (%), by Application 2024 & 2032
- Figure 38: North America 3D Bioprinting Market Volume Share (%), by Application 2024 & 2032
- Figure 39: North America 3D Bioprinting Market Revenue (Million), by Country 2024 & 2032
- Figure 40: North America 3D Bioprinting Market Volume (K Unit), by Country 2024 & 2032
- Figure 41: North America 3D Bioprinting Market Revenue Share (%), by Country 2024 & 2032
- Figure 42: North America 3D Bioprinting Market Volume Share (%), by Country 2024 & 2032
- Figure 43: Europe 3D Bioprinting Market Revenue (Million), by Technology 2024 & 2032
- Figure 44: Europe 3D Bioprinting Market Volume (K Unit), by Technology 2024 & 2032
- Figure 45: Europe 3D Bioprinting Market Revenue Share (%), by Technology 2024 & 2032
- Figure 46: Europe 3D Bioprinting Market Volume Share (%), by Technology 2024 & 2032
- Figure 47: Europe 3D Bioprinting Market Revenue (Million), by Component 2024 & 2032
- Figure 48: Europe 3D Bioprinting Market Volume (K Unit), by Component 2024 & 2032
- Figure 49: Europe 3D Bioprinting Market Revenue Share (%), by Component 2024 & 2032
- Figure 50: Europe 3D Bioprinting Market Volume Share (%), by Component 2024 & 2032
- Figure 51: Europe 3D Bioprinting Market Revenue (Million), by Application 2024 & 2032
- Figure 52: Europe 3D Bioprinting Market Volume (K Unit), by Application 2024 & 2032
- Figure 53: Europe 3D Bioprinting Market Revenue Share (%), by Application 2024 & 2032
- Figure 54: Europe 3D Bioprinting Market Volume Share (%), by Application 2024 & 2032
- Figure 55: Europe 3D Bioprinting Market Revenue (Million), by Country 2024 & 2032
- Figure 56: Europe 3D Bioprinting Market Volume (K Unit), by Country 2024 & 2032
- Figure 57: Europe 3D Bioprinting Market Revenue Share (%), by Country 2024 & 2032
- Figure 58: Europe 3D Bioprinting Market Volume Share (%), by Country 2024 & 2032
- Figure 59: Asia Pacific 3D Bioprinting Market Revenue (Million), by Technology 2024 & 2032
- Figure 60: Asia Pacific 3D Bioprinting Market Volume (K Unit), by Technology 2024 & 2032
- Figure 61: Asia Pacific 3D Bioprinting Market Revenue Share (%), by Technology 2024 & 2032
- Figure 62: Asia Pacific 3D Bioprinting Market Volume Share (%), by Technology 2024 & 2032
- Figure 63: Asia Pacific 3D Bioprinting Market Revenue (Million), by Component 2024 & 2032
- Figure 64: Asia Pacific 3D Bioprinting Market Volume (K Unit), by Component 2024 & 2032
- Figure 65: Asia Pacific 3D Bioprinting Market Revenue Share (%), by Component 2024 & 2032
- Figure 66: Asia Pacific 3D Bioprinting Market Volume Share (%), by Component 2024 & 2032
- Figure 67: Asia Pacific 3D Bioprinting Market Revenue (Million), by Application 2024 & 2032
- Figure 68: Asia Pacific 3D Bioprinting Market Volume (K Unit), by Application 2024 & 2032
- Figure 69: Asia Pacific 3D Bioprinting Market Revenue Share (%), by Application 2024 & 2032
- Figure 70: Asia Pacific 3D Bioprinting Market Volume Share (%), by Application 2024 & 2032
- Figure 71: Asia Pacific 3D Bioprinting Market Revenue (Million), by Country 2024 & 2032
- Figure 72: Asia Pacific 3D Bioprinting Market Volume (K Unit), by Country 2024 & 2032
- Figure 73: Asia Pacific 3D Bioprinting Market Revenue Share (%), by Country 2024 & 2032
- Figure 74: Asia Pacific 3D Bioprinting Market Volume Share (%), by Country 2024 & 2032
- Figure 75: Rest of the World 3D Bioprinting Market Revenue (Million), by Technology 2024 & 2032
- Figure 76: Rest of the World 3D Bioprinting Market Volume (K Unit), by Technology 2024 & 2032
- Figure 77: Rest of the World 3D Bioprinting Market Revenue Share (%), by Technology 2024 & 2032
- Figure 78: Rest of the World 3D Bioprinting Market Volume Share (%), by Technology 2024 & 2032
- Figure 79: Rest of the World 3D Bioprinting Market Revenue (Million), by Component 2024 & 2032
- Figure 80: Rest of the World 3D Bioprinting Market Volume (K Unit), by Component 2024 & 2032
- Figure 81: Rest of the World 3D Bioprinting Market Revenue Share (%), by Component 2024 & 2032
- Figure 82: Rest of the World 3D Bioprinting Market Volume Share (%), by Component 2024 & 2032
- Figure 83: Rest of the World 3D Bioprinting Market Revenue (Million), by Application 2024 & 2032
- Figure 84: Rest of the World 3D Bioprinting Market Volume (K Unit), by Application 2024 & 2032
- Figure 85: Rest of the World 3D Bioprinting Market Revenue Share (%), by Application 2024 & 2032
- Figure 86: Rest of the World 3D Bioprinting Market Volume Share (%), by Application 2024 & 2032
- Figure 87: Rest of the World 3D Bioprinting Market Revenue (Million), by Country 2024 & 2032
- Figure 88: Rest of the World 3D Bioprinting Market Volume (K Unit), by Country 2024 & 2032
- Figure 89: Rest of the World 3D Bioprinting Market Revenue Share (%), by Country 2024 & 2032
- Figure 90: Rest of the World 3D Bioprinting Market Volume Share (%), by Country 2024 & 2032
List of Tables
- Table 1: Global 3D Bioprinting Market Revenue Million Forecast, by Region 2019 & 2032
- Table 2: Global 3D Bioprinting Market Volume K Unit Forecast, by Region 2019 & 2032
- Table 3: Global 3D Bioprinting Market Revenue Million Forecast, by Technology 2019 & 2032
- Table 4: Global 3D Bioprinting Market Volume K Unit Forecast, by Technology 2019 & 2032
- Table 5: Global 3D Bioprinting Market Revenue Million Forecast, by Component 2019 & 2032
- Table 6: Global 3D Bioprinting Market Volume K Unit Forecast, by Component 2019 & 2032
- Table 7: Global 3D Bioprinting Market Revenue Million Forecast, by Application 2019 & 2032
- Table 8: Global 3D Bioprinting Market Volume K Unit Forecast, by Application 2019 & 2032
- Table 9: Global 3D Bioprinting Market Revenue Million Forecast, by Region 2019 & 2032
- Table 10: Global 3D Bioprinting Market Volume K Unit Forecast, by Region 2019 & 2032
- Table 11: Global 3D Bioprinting Market Revenue Million Forecast, by Country 2019 & 2032
- Table 12: Global 3D Bioprinting Market Volume K Unit Forecast, by Country 2019 & 2032
- Table 13: United States 3D Bioprinting Market Revenue (Million) Forecast, by Application 2019 & 2032
- Table 14: United States 3D Bioprinting Market Volume (K Unit) Forecast, by Application 2019 & 2032
- Table 15: Canada 3D Bioprinting Market Revenue (Million) Forecast, by Application 2019 & 2032
- Table 16: Canada 3D Bioprinting Market Volume (K Unit) Forecast, by Application 2019 & 2032
- Table 17: Mexico 3D Bioprinting Market Revenue (Million) Forecast, by Application 2019 & 2032
- Table 18: Mexico 3D Bioprinting Market Volume (K Unit) Forecast, by Application 2019 & 2032
- Table 19: Global 3D Bioprinting Market Revenue Million Forecast, by Country 2019 & 2032
- Table 20: Global 3D Bioprinting Market Volume K Unit Forecast, by Country 2019 & 2032
- Table 21: Germany 3D Bioprinting Market Revenue (Million) Forecast, by Application 2019 & 2032
- Table 22: Germany 3D Bioprinting Market Volume (K Unit) Forecast, by Application 2019 & 2032
- Table 23: United Kingdom 3D Bioprinting Market Revenue (Million) Forecast, by Application 2019 & 2032
- Table 24: United Kingdom 3D Bioprinting Market Volume (K Unit) Forecast, by Application 2019 & 2032
- Table 25: France 3D Bioprinting Market Revenue (Million) Forecast, by Application 2019 & 2032
- Table 26: France 3D Bioprinting Market Volume (K Unit) Forecast, by Application 2019 & 2032
- Table 27: Spain 3D Bioprinting Market Revenue (Million) Forecast, by Application 2019 & 2032
- Table 28: Spain 3D Bioprinting Market Volume (K Unit) Forecast, by Application 2019 & 2032
- Table 29: Italy 3D Bioprinting Market Revenue (Million) Forecast, by Application 2019 & 2032
- Table 30: Italy 3D Bioprinting Market Volume (K Unit) Forecast, by Application 2019 & 2032
- Table 31: Spain 3D Bioprinting Market Revenue (Million) Forecast, by Application 2019 & 2032
- Table 32: Spain 3D Bioprinting Market Volume (K Unit) Forecast, by Application 2019 & 2032
- Table 33: Belgium 3D Bioprinting Market Revenue (Million) Forecast, by Application 2019 & 2032
- Table 34: Belgium 3D Bioprinting Market Volume (K Unit) Forecast, by Application 2019 & 2032
- Table 35: Netherland 3D Bioprinting Market Revenue (Million) Forecast, by Application 2019 & 2032
- Table 36: Netherland 3D Bioprinting Market Volume (K Unit) Forecast, by Application 2019 & 2032
- Table 37: Nordics 3D Bioprinting Market Revenue (Million) Forecast, by Application 2019 & 2032
- Table 38: Nordics 3D Bioprinting Market Volume (K Unit) Forecast, by Application 2019 & 2032
- Table 39: Rest of Europe 3D Bioprinting Market Revenue (Million) Forecast, by Application 2019 & 2032
- Table 40: Rest of Europe 3D Bioprinting Market Volume (K Unit) Forecast, by Application 2019 & 2032
- Table 41: Global 3D Bioprinting Market Revenue Million Forecast, by Country 2019 & 2032
- Table 42: Global 3D Bioprinting Market Volume K Unit Forecast, by Country 2019 & 2032
- Table 43: China 3D Bioprinting Market Revenue (Million) Forecast, by Application 2019 & 2032
- Table 44: China 3D Bioprinting Market Volume (K Unit) Forecast, by Application 2019 & 2032
- Table 45: Japan 3D Bioprinting Market Revenue (Million) Forecast, by Application 2019 & 2032
- Table 46: Japan 3D Bioprinting Market Volume (K Unit) Forecast, by Application 2019 & 2032
- Table 47: India 3D Bioprinting Market Revenue (Million) Forecast, by Application 2019 & 2032
- Table 48: India 3D Bioprinting Market Volume (K Unit) Forecast, by Application 2019 & 2032
- Table 49: South Korea 3D Bioprinting Market Revenue (Million) Forecast, by Application 2019 & 2032
- Table 50: South Korea 3D Bioprinting Market Volume (K Unit) Forecast, by Application 2019 & 2032
- Table 51: Southeast Asia 3D Bioprinting Market Revenue (Million) Forecast, by Application 2019 & 2032
- Table 52: Southeast Asia 3D Bioprinting Market Volume (K Unit) Forecast, by Application 2019 & 2032
- Table 53: Australia 3D Bioprinting Market Revenue (Million) Forecast, by Application 2019 & 2032
- Table 54: Australia 3D Bioprinting Market Volume (K Unit) Forecast, by Application 2019 & 2032
- Table 55: Indonesia 3D Bioprinting Market Revenue (Million) Forecast, by Application 2019 & 2032
- Table 56: Indonesia 3D Bioprinting Market Volume (K Unit) Forecast, by Application 2019 & 2032
- Table 57: Phillipes 3D Bioprinting Market Revenue (Million) Forecast, by Application 2019 & 2032
- Table 58: Phillipes 3D Bioprinting Market Volume (K Unit) Forecast, by Application 2019 & 2032
- Table 59: Singapore 3D Bioprinting Market Revenue (Million) Forecast, by Application 2019 & 2032
- Table 60: Singapore 3D Bioprinting Market Volume (K Unit) Forecast, by Application 2019 & 2032
- Table 61: Thailandc 3D Bioprinting Market Revenue (Million) Forecast, by Application 2019 & 2032
- Table 62: Thailandc 3D Bioprinting Market Volume (K Unit) Forecast, by Application 2019 & 2032
- Table 63: Rest of Asia Pacific 3D Bioprinting Market Revenue (Million) Forecast, by Application 2019 & 2032
- Table 64: Rest of Asia Pacific 3D Bioprinting Market Volume (K Unit) Forecast, by Application 2019 & 2032
- Table 65: Global 3D Bioprinting Market Revenue Million Forecast, by Country 2019 & 2032
- Table 66: Global 3D Bioprinting Market Volume K Unit Forecast, by Country 2019 & 2032
- Table 67: Brazil 3D Bioprinting Market Revenue (Million) Forecast, by Application 2019 & 2032
- Table 68: Brazil 3D Bioprinting Market Volume (K Unit) Forecast, by Application 2019 & 2032
- Table 69: Argentina 3D Bioprinting Market Revenue (Million) Forecast, by Application 2019 & 2032
- Table 70: Argentina 3D Bioprinting Market Volume (K Unit) Forecast, by Application 2019 & 2032
- Table 71: Peru 3D Bioprinting Market Revenue (Million) Forecast, by Application 2019 & 2032
- Table 72: Peru 3D Bioprinting Market Volume (K Unit) Forecast, by Application 2019 & 2032
- Table 73: Chile 3D Bioprinting Market Revenue (Million) Forecast, by Application 2019 & 2032
- Table 74: Chile 3D Bioprinting Market Volume (K Unit) Forecast, by Application 2019 & 2032
- Table 75: Colombia 3D Bioprinting Market Revenue (Million) Forecast, by Application 2019 & 2032
- Table 76: Colombia 3D Bioprinting Market Volume (K Unit) Forecast, by Application 2019 & 2032
- Table 77: Ecuador 3D Bioprinting Market Revenue (Million) Forecast, by Application 2019 & 2032
- Table 78: Ecuador 3D Bioprinting Market Volume (K Unit) Forecast, by Application 2019 & 2032
- Table 79: Venezuela 3D Bioprinting Market Revenue (Million) Forecast, by Application 2019 & 2032
- Table 80: Venezuela 3D Bioprinting Market Volume (K Unit) Forecast, by Application 2019 & 2032
- Table 81: Rest of South America 3D Bioprinting Market Revenue (Million) Forecast, by Application 2019 & 2032
- Table 82: Rest of South America 3D Bioprinting Market Volume (K Unit) Forecast, by Application 2019 & 2032
- Table 83: Global 3D Bioprinting Market Revenue Million Forecast, by Country 2019 & 2032
- Table 84: Global 3D Bioprinting Market Volume K Unit Forecast, by Country 2019 & 2032
- Table 85: United States 3D Bioprinting Market Revenue (Million) Forecast, by Application 2019 & 2032
- Table 86: United States 3D Bioprinting Market Volume (K Unit) Forecast, by Application 2019 & 2032
- Table 87: Canada 3D Bioprinting Market Revenue (Million) Forecast, by Application 2019 & 2032
- Table 88: Canada 3D Bioprinting Market Volume (K Unit) Forecast, by Application 2019 & 2032
- Table 89: Mexico 3D Bioprinting Market Revenue (Million) Forecast, by Application 2019 & 2032
- Table 90: Mexico 3D Bioprinting Market Volume (K Unit) Forecast, by Application 2019 & 2032
- Table 91: Global 3D Bioprinting Market Revenue Million Forecast, by Country 2019 & 2032
- Table 92: Global 3D Bioprinting Market Volume K Unit Forecast, by Country 2019 & 2032
- Table 93: United Arab Emirates 3D Bioprinting Market Revenue (Million) Forecast, by Application 2019 & 2032
- Table 94: United Arab Emirates 3D Bioprinting Market Volume (K Unit) Forecast, by Application 2019 & 2032
- Table 95: Saudi Arabia 3D Bioprinting Market Revenue (Million) Forecast, by Application 2019 & 2032
- Table 96: Saudi Arabia 3D Bioprinting Market Volume (K Unit) Forecast, by Application 2019 & 2032
- Table 97: South Africa 3D Bioprinting Market Revenue (Million) Forecast, by Application 2019 & 2032
- Table 98: South Africa 3D Bioprinting Market Volume (K Unit) Forecast, by Application 2019 & 2032
- Table 99: Rest of Middle East and Africa 3D Bioprinting Market Revenue (Million) Forecast, by Application 2019 & 2032
- Table 100: Rest of Middle East and Africa 3D Bioprinting Market Volume (K Unit) Forecast, by Application 2019 & 2032
- Table 101: Global 3D Bioprinting Market Revenue Million Forecast, by Technology 2019 & 2032
- Table 102: Global 3D Bioprinting Market Volume K Unit Forecast, by Technology 2019 & 2032
- Table 103: Global 3D Bioprinting Market Revenue Million Forecast, by Component 2019 & 2032
- Table 104: Global 3D Bioprinting Market Volume K Unit Forecast, by Component 2019 & 2032
- Table 105: Global 3D Bioprinting Market Revenue Million Forecast, by Application 2019 & 2032
- Table 106: Global 3D Bioprinting Market Volume K Unit Forecast, by Application 2019 & 2032
- Table 107: Global 3D Bioprinting Market Revenue Million Forecast, by Country 2019 & 2032
- Table 108: Global 3D Bioprinting Market Volume K Unit Forecast, by Country 2019 & 2032
- Table 109: United States 3D Bioprinting Market Revenue (Million) Forecast, by Application 2019 & 2032
- Table 110: United States 3D Bioprinting Market Volume (K Unit) Forecast, by Application 2019 & 2032
- Table 111: Canada 3D Bioprinting Market Revenue (Million) Forecast, by Application 2019 & 2032
- Table 112: Canada 3D Bioprinting Market Volume (K Unit) Forecast, by Application 2019 & 2032
- Table 113: Global 3D Bioprinting Market Revenue Million Forecast, by Technology 2019 & 2032
- Table 114: Global 3D Bioprinting Market Volume K Unit Forecast, by Technology 2019 & 2032
- Table 115: Global 3D Bioprinting Market Revenue Million Forecast, by Component 2019 & 2032
- Table 116: Global 3D Bioprinting Market Volume K Unit Forecast, by Component 2019 & 2032
- Table 117: Global 3D Bioprinting Market Revenue Million Forecast, by Application 2019 & 2032
- Table 118: Global 3D Bioprinting Market Volume K Unit Forecast, by Application 2019 & 2032
- Table 119: Global 3D Bioprinting Market Revenue Million Forecast, by Country 2019 & 2032
- Table 120: Global 3D Bioprinting Market Volume K Unit Forecast, by Country 2019 & 2032
- Table 121: United Kingdom 3D Bioprinting Market Revenue (Million) Forecast, by Application 2019 & 2032
- Table 122: United Kingdom 3D Bioprinting Market Volume (K Unit) Forecast, by Application 2019 & 2032
- Table 123: Germany 3D Bioprinting Market Revenue (Million) Forecast, by Application 2019 & 2032
- Table 124: Germany 3D Bioprinting Market Volume (K Unit) Forecast, by Application 2019 & 2032
- Table 125: France 3D Bioprinting Market Revenue (Million) Forecast, by Application 2019 & 2032
- Table 126: France 3D Bioprinting Market Volume (K Unit) Forecast, by Application 2019 & 2032
- Table 127: Rest of Europe 3D Bioprinting Market Revenue (Million) Forecast, by Application 2019 & 2032
- Table 128: Rest of Europe 3D Bioprinting Market Volume (K Unit) Forecast, by Application 2019 & 2032
- Table 129: Global 3D Bioprinting Market Revenue Million Forecast, by Technology 2019 & 2032
- Table 130: Global 3D Bioprinting Market Volume K Unit Forecast, by Technology 2019 & 2032
- Table 131: Global 3D Bioprinting Market Revenue Million Forecast, by Component 2019 & 2032
- Table 132: Global 3D Bioprinting Market Volume K Unit Forecast, by Component 2019 & 2032
- Table 133: Global 3D Bioprinting Market Revenue Million Forecast, by Application 2019 & 2032
- Table 134: Global 3D Bioprinting Market Volume K Unit Forecast, by Application 2019 & 2032
- Table 135: Global 3D Bioprinting Market Revenue Million Forecast, by Country 2019 & 2032
- Table 136: Global 3D Bioprinting Market Volume K Unit Forecast, by Country 2019 & 2032
- Table 137: China 3D Bioprinting Market Revenue (Million) Forecast, by Application 2019 & 2032
- Table 138: China 3D Bioprinting Market Volume (K Unit) Forecast, by Application 2019 & 2032
- Table 139: Japan 3D Bioprinting Market Revenue (Million) Forecast, by Application 2019 & 2032
- Table 140: Japan 3D Bioprinting Market Volume (K Unit) Forecast, by Application 2019 & 2032
- Table 141: India 3D Bioprinting Market Revenue (Million) Forecast, by Application 2019 & 2032
- Table 142: India 3D Bioprinting Market Volume (K Unit) Forecast, by Application 2019 & 2032
- Table 143: Rest of Asia Pacific 3D Bioprinting Market Revenue (Million) Forecast, by Application 2019 & 2032
- Table 144: Rest of Asia Pacific 3D Bioprinting Market Volume (K Unit) Forecast, by Application 2019 & 2032
- Table 145: Global 3D Bioprinting Market Revenue Million Forecast, by Technology 2019 & 2032
- Table 146: Global 3D Bioprinting Market Volume K Unit Forecast, by Technology 2019 & 2032
- Table 147: Global 3D Bioprinting Market Revenue Million Forecast, by Component 2019 & 2032
- Table 148: Global 3D Bioprinting Market Volume K Unit Forecast, by Component 2019 & 2032
- Table 149: Global 3D Bioprinting Market Revenue Million Forecast, by Application 2019 & 2032
- Table 150: Global 3D Bioprinting Market Volume K Unit Forecast, by Application 2019 & 2032
- Table 151: Global 3D Bioprinting Market Revenue Million Forecast, by Country 2019 & 2032
- Table 152: Global 3D Bioprinting Market Volume K Unit Forecast, by Country 2019 & 2032
Frequently Asked Questions
1. What is the projected Compound Annual Growth Rate (CAGR) of the 3D Bioprinting Market?
The projected CAGR is approximately 15.89%.
2. Which companies are prominent players in the 3D Bioprinting Market?
Key companies in the market include Envision TEC GmbH, GeSIM GmbH, Cellink, Cyfuse Biomedical KK, 3D Systems Corporation, 3D Bioprinting Solutions, Arcam AB (GE Company), RegenHU SA, Organovo Holdings Inc, Stratasys Ltd, Aspect Biosystems Ltd, REGEMAT 3D.
3. What are the main segments of the 3D Bioprinting Market?
The market segments include Technology, Component, Application.
4. Can you provide details about the market size?
The market size is estimated to be USD 1.44 Million as of 2022.
5. What are some drivers contributing to market growth?
Increasing Geriatric Population; Increasing Investments in R&D.
6. What are the notable trends driving market growth?
Drug Testing and Development to Hold Significant Market Share.
7. Are there any restraints impacting market growth?
Low Awareness and Regulatory Framework; Competition from Traditional Sports Betting.
8. Can you provide examples of recent developments in the market?
SEP 2022 - 3D Systems announced a new 3D bioprinting subsidiary, Systemic Bio, to accelerate drug discovery and development. The new company will leverage 3D Systems' recent breakthroughs in the bioprinting of vascularized human organs and tissues to reduce cost, accelerate new drug development, and ultimately reduce or eliminate animal testing. Systemic Bio plans to open a new market for 3D Systems in the pharmaceutical sector, creating a biotech revenue stream that could approach USD 100 million annually over the next five years.
9. What pricing options are available for accessing the report?
Pricing options include single-user, multi-user, and enterprise licenses priced at USD 4750, USD 5250, and USD 8750 respectively.
10. Is the market size provided in terms of value or volume?
The market size is provided in terms of value, measured in Million and volume, measured in K Unit.
11. Are there any specific market keywords associated with the report?
Yes, the market keyword associated with the report is "3D Bioprinting Market," which aids in identifying and referencing the specific market segment covered.
12. How do I determine which pricing option suits my needs best?
The pricing options vary based on user requirements and access needs. Individual users may opt for single-user licenses, while businesses requiring broader access may choose multi-user or enterprise licenses for cost-effective access to the report.
13. Are there any additional resources or data provided in the 3D Bioprinting Market report?
While the report offers comprehensive insights, it's advisable to review the specific contents or supplementary materials provided to ascertain if additional resources or data are available.
14. How can I stay updated on further developments or reports in the 3D Bioprinting Market?
To stay informed about further developments, trends, and reports in the 3D Bioprinting Market, consider subscribing to industry newsletters, following relevant companies and organizations, or regularly checking reputable industry news sources and publications.
Methodology
Step 1 - Identification of Relevant Samples Size from Population Database


Step 2 - Approaches for Defining Global Market Size (Value, Volume* & Price*)

Note*: In applicable scenarios
Step 3 - Data Sources
Primary Research
- Web Analytics
- Survey Reports
- Research Institute
- Latest Research Reports
- Opinion Leaders
Secondary Research
- Annual Reports
- White Paper
- Latest Press Release
- Industry Association
- Paid Database
- Investor Presentations

Step 4 - Data Triangulation
Involves using different sources of information in order to increase the validity of a study
These sources are likely to be stakeholders in a program - participants, other researchers, program staff, other community members, and so on.
Then we put all data in single framework & apply various statistical tools to find out the dynamic on the market.
During the analysis stage, feedback from the stakeholder groups would be compared to determine areas of agreement as well as areas of divergence


