

Key Insights
The global wireless corrosion sensor market is experiencing significant expansion, driven by the escalating demand for real-time monitoring and predictive maintenance across critical sectors such as oil and gas, energy, and chemical processing. Key growth drivers include the increasing economic impact of corrosion-related damage, necessitating proactive prevention strategies, and continuous advancements in sensor accuracy, reliability, and battery performance. The proliferation of Industry 4.0 and the Internet of Things (IoT) further accelerates adoption, integrating wireless sensors into comprehensive monitoring systems for data-driven insights. The market is segmented by application (e.g., oil-field operations, energy) and sensor type (e.g., sulfate-reducing bacteria, biocide, residual corrosion sensors), presenting numerous specialized opportunities. North America and Europe currently dominate due to established infrastructure and stringent regulations, while the Asia-Pacific region is poised for substantial growth driven by industrialization and infrastructure investment.
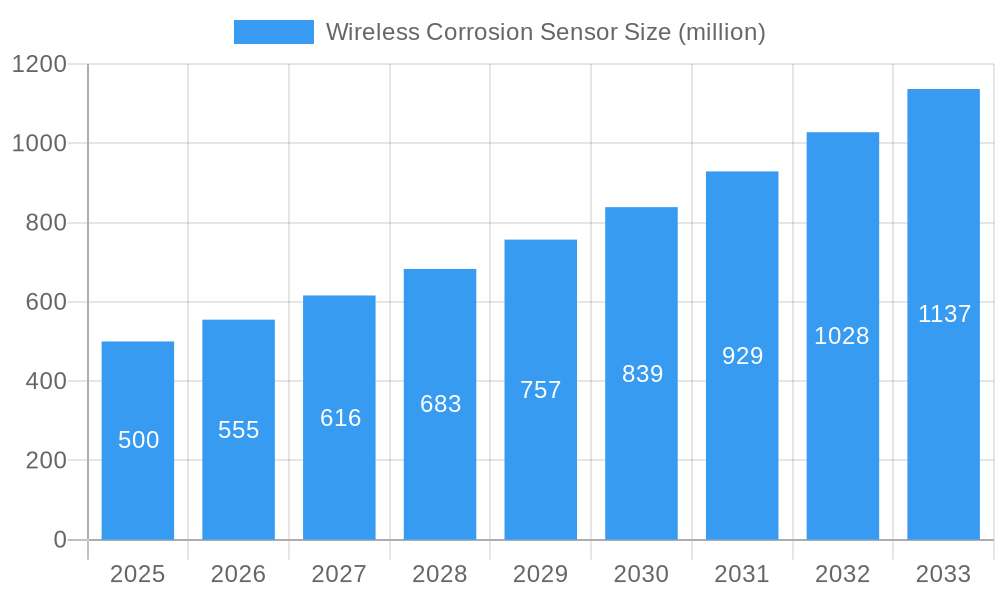
Wireless Corrosion Sensor Market Size (In Billion)
Market challenges include the substantial initial investment required for wireless sensor network deployment, particularly for smaller enterprises. The imperative for robust cybersecurity to safeguard transmitted data and the need to ensure sensor reliability and longevity in harsh operational environments also represent ongoing considerations. Nevertheless, continuous innovation and a growing appreciation for the economic benefits of corrosion mitigation are expected to surmount these hurdles. The wireless corrosion sensor market is projected to reach a size of $9.67 billion by 2025, with a projected Compound Annual Growth Rate (CAGR) of 13.83% from 2025 to 2033. This robust growth trajectory will be sustained by consistent demand across all identified applications and geographic regions.
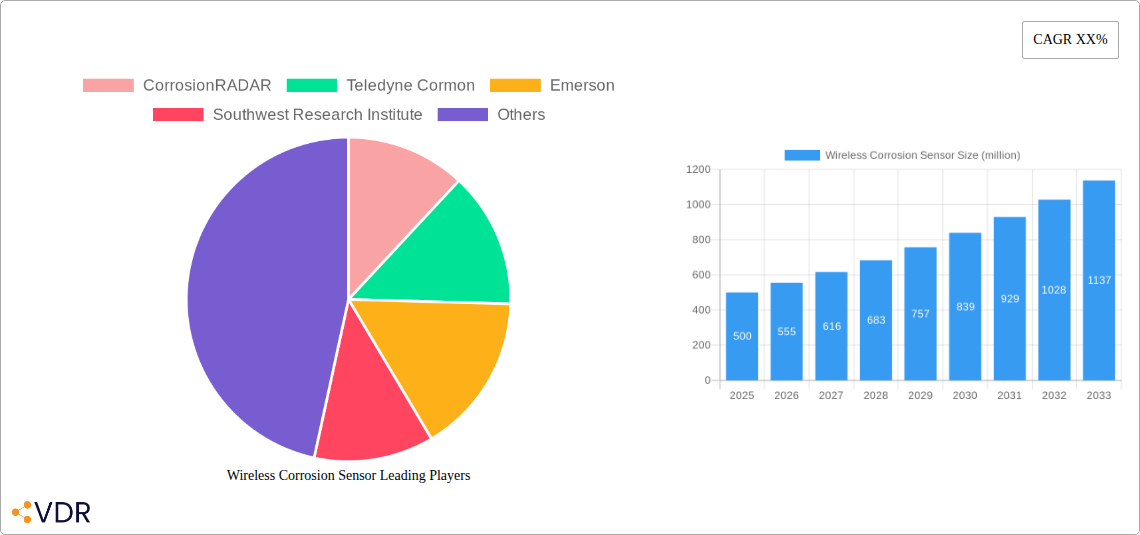
Wireless Corrosion Sensor Company Market Share
Wireless Corrosion Sensor Market Report: 2019-2033
This comprehensive report provides an in-depth analysis of the Wireless Corrosion Sensor market, encompassing market dynamics, growth trends, regional analysis, competitive landscape, and future outlook. The study period covers 2019-2033, with 2025 as the base and estimated year. The forecast period spans 2025-2033, and the historical period encompasses 2019-2024. The report is crucial for industry professionals, investors, and stakeholders seeking actionable insights into this rapidly evolving market. The parent market is the broader corrosion monitoring industry, while the child market focuses specifically on wireless sensor technologies within this sector. The total market size in 2025 is estimated at $xx million.
Wireless Corrosion Sensor Market Dynamics & Structure
The global wireless corrosion sensor market is characterized by moderate concentration, with several key players dominating significant market shares. In 2025, the top 5 players held an estimated xx% market share collectively. Technological innovation is a primary driver, fueled by advancements in sensor technology, wireless communication protocols (e.g., IoT integration), and data analytics capabilities. Stringent regulatory frameworks concerning environmental protection and industrial safety are increasingly influencing market growth. Competitive substitutes include traditional wired corrosion monitoring systems; however, the advantages of wireless sensors (reduced installation costs, enhanced accessibility, real-time data) are driving market adoption. The end-user demographics are primarily concentrated within the oil and gas, energy, and industrial sectors. M&A activity has been relatively moderate in recent years, with approximately xx deals recorded between 2019 and 2024.
- Market Concentration: Moderately concentrated, with top 5 players holding xx% market share (2025).
- Technological Drivers: Advancements in sensor technology, wireless communication (IoT), and data analytics.
- Regulatory Frameworks: Stringent environmental and safety regulations driving adoption.
- Competitive Substitutes: Traditional wired systems, but wireless offers cost and accessibility advantages.
- End-User Demographics: Oil & Gas, Energy, and Industrial sectors.
- M&A Trends: Moderate activity, with approx. xx deals between 2019-2024.
- Innovation Barriers: High initial investment costs, integration complexities, and data security concerns.
Wireless Corrosion Sensor Growth Trends & Insights
The wireless corrosion sensor market exhibited a CAGR of xx% during the historical period (2019-2024) and is projected to maintain a CAGR of xx% during the forecast period (2025-2033). Market size is expected to reach $xx million by 2033, driven by increasing demand across various industrial applications. Adoption rates are accelerating, particularly in sectors prioritizing real-time monitoring and predictive maintenance. Technological disruptions, such as the integration of AI and machine learning for enhanced data analysis and predictive modeling, are significantly impacting market dynamics. Consumer behavior is shifting towards solutions offering improved accuracy, reliability, and ease of use. The market penetration rate is currently at xx% and is projected to reach xx% by 2033.
Dominant Regions, Countries, or Segments in Wireless Corrosion Sensor
The North American region currently dominates the wireless corrosion sensor market, driven by robust oil and gas activities, stringent environmental regulations, and a high concentration of technology providers. Within this region, the United States accounts for the largest share, due to extensive oil and gas infrastructure and a mature industrial base. The Oil-Fields Operations segment holds the largest market share within the application category, while the Sulfate Reducing Bacteria Sensor segment dominates the type category.
- Key Drivers (North America): High oil & gas activity, stringent regulations, strong technological base.
- Key Drivers (Oil-Fields Operations): Increased focus on asset integrity management, enhanced safety regulations.
- Key Drivers (Sulfate Reducing Bacteria Sensor): Growing awareness of microbial induced corrosion (MIC).
- Market Share & Growth Potential: North America holds the largest market share (xx%), with significant growth potential in emerging economies.
Wireless Corrosion Sensor Product Landscape
Wireless corrosion sensors offer a range of features, including real-time data acquisition, remote monitoring capabilities, and integration with various data platforms. Advancements in sensor materials, communication protocols, and data processing algorithms are continuously enhancing performance metrics such as accuracy, sensitivity, and lifespan. Unique selling propositions include reduced maintenance costs, improved safety, and enhanced operational efficiency. Innovative products incorporate advanced analytics for predictive maintenance and automated alerts.
Key Drivers, Barriers & Challenges in Wireless Corrosion Sensor
Key Drivers: Increased demand for real-time monitoring, rising adoption of predictive maintenance strategies, stringent environmental regulations promoting corrosion control, and advancements in sensor technology driving miniaturization and improved accuracy.
Challenges & Restraints: High initial investment costs for wireless sensor infrastructure, concerns regarding data security and network reliability, potential interference from other wireless signals, and the need for skilled personnel for installation and maintenance. These challenges limit widespread adoption, particularly in smaller organizations or developing economies. The total impact of these restraints is estimated to reduce market growth by approximately xx% annually.
Emerging Opportunities in Wireless Corrosion Sensor
The emergence of low-power wide-area networks (LPWANs) for long-range, low-power communication is opening up new opportunities for remote monitoring in geographically dispersed assets. The integration of advanced analytics and AI/ML for predictive maintenance is gaining traction, enabling proactive corrosion management. Untapped markets include infrastructure monitoring (pipelines, bridges) and the growing renewable energy sector. The development of more robust and cost-effective sensors with longer lifespans remains a key area for innovation.
Growth Accelerators in the Wireless Corrosion Sensor Industry
Technological breakthroughs, particularly in sensor miniaturization, energy efficiency, and data analytics, are accelerating market growth. Strategic partnerships between sensor manufacturers and data analytics providers are facilitating the development of integrated solutions. Market expansion strategies focusing on emerging economies, particularly in the Asia-Pacific region, are creating new growth opportunities. Government initiatives promoting industrial automation and digital transformation are further bolstering market expansion.
Key Players Shaping the Wireless Corrosion Sensor Market
- CorrosionRADAR
- Teledyne Cormon
- Emerson
- Southwest Research Institute
- Corr Instruments, LLC
- InfraSensing
- Giatec Scientific Inc.
- Pepperl+Fuchs
- Franklin Fueling Systems
- Walchem
- Hitachi
- JFE Techno-Research
- Cosasco
- Pyxis Lab
Notable Milestones in Wireless Corrosion Sensor Sector
- 2020: CorrosionRADAR launches its next-generation wireless corrosion sensor with improved accuracy.
- 2022: Emerson acquires a smaller sensor technology company, expanding its product portfolio.
- 2023: New industry standards for wireless sensor data security are implemented.
- 2024: Significant investment in R&D for improved sensor lifespan and lower power consumption.
In-Depth Wireless Corrosion Sensor Market Outlook
The future of the wireless corrosion sensor market is promising, driven by continued technological advancements, increasing demand for real-time monitoring, and the growing adoption of predictive maintenance strategies across various industries. Strategic partnerships, market expansion into new regions, and the development of innovative applications will play a crucial role in shaping future growth. The market is poised for substantial expansion, offering significant opportunities for both established players and new entrants.
Wireless Corrosion Sensor Segmentation
-
1. Application
- 1.1. Oil-Fields Operations
- 1.2. O&G
- 1.3. Energy
-
2. Types
- 2.1. Sulfate Reducing Bacteria Sensor
- 2.2. Biocide Sensor
- 2.3. Residual Corrosion Sensor
Wireless Corrosion Sensor Segmentation By Geography
-
1. North America
- 1.1. United States
- 1.2. Canada
- 1.3. Mexico
-
2. South America
- 2.1. Brazil
- 2.2. Argentina
- 2.3. Rest of South America
-
3. Europe
- 3.1. United Kingdom
- 3.2. Germany
- 3.3. France
- 3.4. Italy
- 3.5. Spain
- 3.6. Russia
- 3.7. Benelux
- 3.8. Nordics
- 3.9. Rest of Europe
-
4. Middle East & Africa
- 4.1. Turkey
- 4.2. Israel
- 4.3. GCC
- 4.4. North Africa
- 4.5. South Africa
- 4.6. Rest of Middle East & Africa
-
5. Asia Pacific
- 5.1. China
- 5.2. India
- 5.3. Japan
- 5.4. South Korea
- 5.5. ASEAN
- 5.6. Oceania
- 5.7. Rest of Asia Pacific
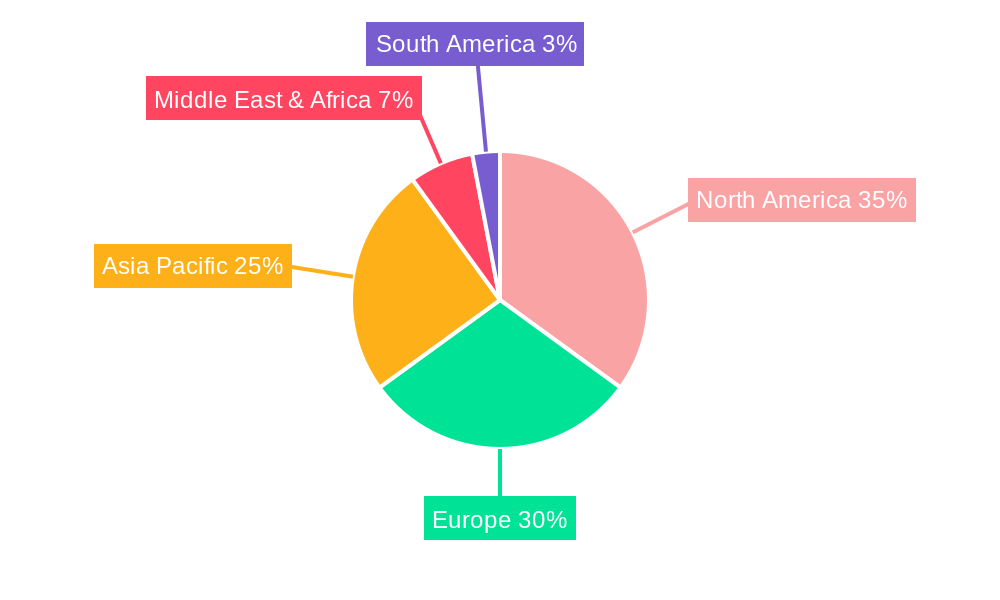
Wireless Corrosion Sensor Regional Market Share
Geographic Coverage of Wireless Corrosion Sensor
Wireless Corrosion Sensor REPORT HIGHLIGHTS
| Aspects | Details |
|---|---|
| Study Period | 2020-2034 |
| Base Year | 2025 |
| Estimated Year | 2026 |
| Forecast Period | 2026-2034 |
| Historical Period | 2020-2025 |
| Growth Rate | CAGR of 13.83% from 2020-2034 |
| Segmentation |
|
Table of Contents
- 1. Introduction
- 1.1. Research Scope
- 1.2. Market Segmentation
- 1.3. Research Objective
- 1.4. Definitions and Assumptions
- 2. Executive Summary
- 2.1. Market Snapshot
- 3. Market Dynamics
- 3.1. Market Drivers
- 3.2. Market Restrains
- 3.3. Market Trends
- 3.4. Market Opportunities
- 4. Market Factor Analysis
- 4.1. Porters Five Forces
- 4.1.1. Bargaining Power of Suppliers
- 4.1.2. Bargaining Power of Buyers
- 4.1.3. Threat of New Entrants
- 4.1.4. Threat of Substitutes
- 4.1.5. Competitive Rivalry
- 4.2. PESTEL analysis
- 4.3. BCG Analysis
- 4.3.1. Stars (High Growth, High Market Share)
- 4.3.2. Cash Cows (Low Growth, High Market Share)
- 4.3.3. Question Mark (High Growth, Low Market Share)
- 4.3.4. Dogs (Low Growth, Low Market Share)
- 4.4. Ansoff Matrix Analysis
- 4.5. Supply Chain Analysis
- 4.6. Regulatory Landscape
- 4.7. Current Market Potential and Opportunity Assessment (TAM–SAM–SOM Framework)
- 4.8. VDR Analyst Note
- 4.1. Porters Five Forces
- 5. Market Analysis, Insights and Forecast 2021-2033
- 5.1. Market Analysis, Insights and Forecast - by Application
- 5.1.1. Oil-Fields Operations
- 5.1.2. O&G
- 5.1.3. Energy
- 5.2. Market Analysis, Insights and Forecast - by Types
- 5.2.1. Sulfate Reducing Bacteria Sensor
- 5.2.2. Biocide Sensor
- 5.2.3. Residual Corrosion Sensor
- 5.3. Market Analysis, Insights and Forecast - by Region
- 5.3.1. North America
- 5.3.2. South America
- 5.3.3. Europe
- 5.3.4. Middle East & Africa
- 5.3.5. Asia Pacific
- 5.1. Market Analysis, Insights and Forecast - by Application
- 6. Global Wireless Corrosion Sensor Analysis, Insights and Forecast, 2021-2033
- 6.1. Market Analysis, Insights and Forecast - by Application
- 6.1.1. Oil-Fields Operations
- 6.1.2. O&G
- 6.1.3. Energy
- 6.2. Market Analysis, Insights and Forecast - by Types
- 6.2.1. Sulfate Reducing Bacteria Sensor
- 6.2.2. Biocide Sensor
- 6.2.3. Residual Corrosion Sensor
- 6.1. Market Analysis, Insights and Forecast - by Application
- 7. North America Wireless Corrosion Sensor Analysis, Insights and Forecast, 2021-2033
- 7.1. Market Analysis, Insights and Forecast - by Application
- 7.1.1. Oil-Fields Operations
- 7.1.2. O&G
- 7.1.3. Energy
- 7.2. Market Analysis, Insights and Forecast - by Types
- 7.2.1. Sulfate Reducing Bacteria Sensor
- 7.2.2. Biocide Sensor
- 7.2.3. Residual Corrosion Sensor
- 7.1. Market Analysis, Insights and Forecast - by Application
- 8. South America Wireless Corrosion Sensor Analysis, Insights and Forecast, 2021-2033
- 8.1. Market Analysis, Insights and Forecast - by Application
- 8.1.1. Oil-Fields Operations
- 8.1.2. O&G
- 8.1.3. Energy
- 8.2. Market Analysis, Insights and Forecast - by Types
- 8.2.1. Sulfate Reducing Bacteria Sensor
- 8.2.2. Biocide Sensor
- 8.2.3. Residual Corrosion Sensor
- 8.1. Market Analysis, Insights and Forecast - by Application
- 9. Europe Wireless Corrosion Sensor Analysis, Insights and Forecast, 2021-2033
- 9.1. Market Analysis, Insights and Forecast - by Application
- 9.1.1. Oil-Fields Operations
- 9.1.2. O&G
- 9.1.3. Energy
- 9.2. Market Analysis, Insights and Forecast - by Types
- 9.2.1. Sulfate Reducing Bacteria Sensor
- 9.2.2. Biocide Sensor
- 9.2.3. Residual Corrosion Sensor
- 9.1. Market Analysis, Insights and Forecast - by Application
- 10. Middle East & Africa Wireless Corrosion Sensor Analysis, Insights and Forecast, 2021-2033
- 10.1. Market Analysis, Insights and Forecast - by Application
- 10.1.1. Oil-Fields Operations
- 10.1.2. O&G
- 10.1.3. Energy
- 10.2. Market Analysis, Insights and Forecast - by Types
- 10.2.1. Sulfate Reducing Bacteria Sensor
- 10.2.2. Biocide Sensor
- 10.2.3. Residual Corrosion Sensor
- 10.1. Market Analysis, Insights and Forecast - by Application
- 11. Asia Pacific Wireless Corrosion Sensor Analysis, Insights and Forecast, 2021-2033
- 11.1. Market Analysis, Insights and Forecast - by Application
- 11.1.1. Oil-Fields Operations
- 11.1.2. O&G
- 11.1.3. Energy
- 11.2. Market Analysis, Insights and Forecast - by Types
- 11.2.1. Sulfate Reducing Bacteria Sensor
- 11.2.2. Biocide Sensor
- 11.2.3. Residual Corrosion Sensor
- 11.1. Market Analysis, Insights and Forecast - by Application
- 12. Competitive Analysis
- 12.1. Company Profiles
- 12.1.1 CorrosionRADAR
- 12.1.1.1. Company Overview
- 12.1.1.2. Products
- 12.1.1.3. Company Financials
- 12.1.1.4. SWOT Analysis
- 12.1.2 Teledyne Cormon
- 12.1.2.1. Company Overview
- 12.1.2.2. Products
- 12.1.2.3. Company Financials
- 12.1.2.4. SWOT Analysis
- 12.1.3 Emerson
- 12.1.3.1. Company Overview
- 12.1.3.2. Products
- 12.1.3.3. Company Financials
- 12.1.3.4. SWOT Analysis
- 12.1.4 Southwest Research Institute
- 12.1.4.1. Company Overview
- 12.1.4.2. Products
- 12.1.4.3. Company Financials
- 12.1.4.4. SWOT Analysis
- 12.1.5 Southwest Research Institute
- 12.1.5.1. Company Overview
- 12.1.5.2. Products
- 12.1.5.3. Company Financials
- 12.1.5.4. SWOT Analysis
- 12.1.6 Corr Instruments
- 12.1.6.1. Company Overview
- 12.1.6.2. Products
- 12.1.6.3. Company Financials
- 12.1.6.4. SWOT Analysis
- 12.1.7 LLC
- 12.1.7.1. Company Overview
- 12.1.7.2. Products
- 12.1.7.3. Company Financials
- 12.1.7.4. SWOT Analysis
- 12.1.8 InfraSensing
- 12.1.8.1. Company Overview
- 12.1.8.2. Products
- 12.1.8.3. Company Financials
- 12.1.8.4. SWOT Analysis
- 12.1.9 Giatec Scientific Inc.
- 12.1.9.1. Company Overview
- 12.1.9.2. Products
- 12.1.9.3. Company Financials
- 12.1.9.4. SWOT Analysis
- 12.1.10 Pepperl+Fuchs
- 12.1.10.1. Company Overview
- 12.1.10.2. Products
- 12.1.10.3. Company Financials
- 12.1.10.4. SWOT Analysis
- 12.1.11 Franklin Fueling Systems
- 12.1.11.1. Company Overview
- 12.1.11.2. Products
- 12.1.11.3. Company Financials
- 12.1.11.4. SWOT Analysis
- 12.1.12 Walchem
- 12.1.12.1. Company Overview
- 12.1.12.2. Products
- 12.1.12.3. Company Financials
- 12.1.12.4. SWOT Analysis
- 12.1.13 Hitachi
- 12.1.13.1. Company Overview
- 12.1.13.2. Products
- 12.1.13.3. Company Financials
- 12.1.13.4. SWOT Analysis
- 12.1.14 JFE Techno-Research
- 12.1.14.1. Company Overview
- 12.1.14.2. Products
- 12.1.14.3. Company Financials
- 12.1.14.4. SWOT Analysis
- 12.1.15 Cosasco
- 12.1.15.1. Company Overview
- 12.1.15.2. Products
- 12.1.15.3. Company Financials
- 12.1.15.4. SWOT Analysis
- 12.1.16 Pyxis Lab
- 12.1.16.1. Company Overview
- 12.1.16.2. Products
- 12.1.16.3. Company Financials
- 12.1.16.4. SWOT Analysis
- 12.1.1 CorrosionRADAR
- 12.2. Market Entropy
- 12.2.1 Company's Key Areas Served
- 12.2.2 Recent Developments
- 12.3. Company Market Share Analysis 2025
- 12.3.1 Top 5 Companies Market Share Analysis
- 12.3.2 Top 3 Companies Market Share Analysis
- 12.4. List of Potential Customers
- 13. Research Methodology
List of Figures
- Figure 1: Global Wireless Corrosion Sensor Revenue Breakdown (billion, %) by Region 2025 & 2033
- Figure 2: Global Wireless Corrosion Sensor Volume Breakdown (K, %) by Region 2025 & 2033
- Figure 3: North America Wireless Corrosion Sensor Revenue (billion), by Application 2025 & 2033
- Figure 4: North America Wireless Corrosion Sensor Volume (K), by Application 2025 & 2033
- Figure 5: North America Wireless Corrosion Sensor Revenue Share (%), by Application 2025 & 2033
- Figure 6: North America Wireless Corrosion Sensor Volume Share (%), by Application 2025 & 2033
- Figure 7: North America Wireless Corrosion Sensor Revenue (billion), by Types 2025 & 2033
- Figure 8: North America Wireless Corrosion Sensor Volume (K), by Types 2025 & 2033
- Figure 9: North America Wireless Corrosion Sensor Revenue Share (%), by Types 2025 & 2033
- Figure 10: North America Wireless Corrosion Sensor Volume Share (%), by Types 2025 & 2033
- Figure 11: North America Wireless Corrosion Sensor Revenue (billion), by Country 2025 & 2033
- Figure 12: North America Wireless Corrosion Sensor Volume (K), by Country 2025 & 2033
- Figure 13: North America Wireless Corrosion Sensor Revenue Share (%), by Country 2025 & 2033
- Figure 14: North America Wireless Corrosion Sensor Volume Share (%), by Country 2025 & 2033
- Figure 15: South America Wireless Corrosion Sensor Revenue (billion), by Application 2025 & 2033
- Figure 16: South America Wireless Corrosion Sensor Volume (K), by Application 2025 & 2033
- Figure 17: South America Wireless Corrosion Sensor Revenue Share (%), by Application 2025 & 2033
- Figure 18: South America Wireless Corrosion Sensor Volume Share (%), by Application 2025 & 2033
- Figure 19: South America Wireless Corrosion Sensor Revenue (billion), by Types 2025 & 2033
- Figure 20: South America Wireless Corrosion Sensor Volume (K), by Types 2025 & 2033
- Figure 21: South America Wireless Corrosion Sensor Revenue Share (%), by Types 2025 & 2033
- Figure 22: South America Wireless Corrosion Sensor Volume Share (%), by Types 2025 & 2033
- Figure 23: South America Wireless Corrosion Sensor Revenue (billion), by Country 2025 & 2033
- Figure 24: South America Wireless Corrosion Sensor Volume (K), by Country 2025 & 2033
- Figure 25: South America Wireless Corrosion Sensor Revenue Share (%), by Country 2025 & 2033
- Figure 26: South America Wireless Corrosion Sensor Volume Share (%), by Country 2025 & 2033
- Figure 27: Europe Wireless Corrosion Sensor Revenue (billion), by Application 2025 & 2033
- Figure 28: Europe Wireless Corrosion Sensor Volume (K), by Application 2025 & 2033
- Figure 29: Europe Wireless Corrosion Sensor Revenue Share (%), by Application 2025 & 2033
- Figure 30: Europe Wireless Corrosion Sensor Volume Share (%), by Application 2025 & 2033
- Figure 31: Europe Wireless Corrosion Sensor Revenue (billion), by Types 2025 & 2033
- Figure 32: Europe Wireless Corrosion Sensor Volume (K), by Types 2025 & 2033
- Figure 33: Europe Wireless Corrosion Sensor Revenue Share (%), by Types 2025 & 2033
- Figure 34: Europe Wireless Corrosion Sensor Volume Share (%), by Types 2025 & 2033
- Figure 35: Europe Wireless Corrosion Sensor Revenue (billion), by Country 2025 & 2033
- Figure 36: Europe Wireless Corrosion Sensor Volume (K), by Country 2025 & 2033
- Figure 37: Europe Wireless Corrosion Sensor Revenue Share (%), by Country 2025 & 2033
- Figure 38: Europe Wireless Corrosion Sensor Volume Share (%), by Country 2025 & 2033
- Figure 39: Middle East & Africa Wireless Corrosion Sensor Revenue (billion), by Application 2025 & 2033
- Figure 40: Middle East & Africa Wireless Corrosion Sensor Volume (K), by Application 2025 & 2033
- Figure 41: Middle East & Africa Wireless Corrosion Sensor Revenue Share (%), by Application 2025 & 2033
- Figure 42: Middle East & Africa Wireless Corrosion Sensor Volume Share (%), by Application 2025 & 2033
- Figure 43: Middle East & Africa Wireless Corrosion Sensor Revenue (billion), by Types 2025 & 2033
- Figure 44: Middle East & Africa Wireless Corrosion Sensor Volume (K), by Types 2025 & 2033
- Figure 45: Middle East & Africa Wireless Corrosion Sensor Revenue Share (%), by Types 2025 & 2033
- Figure 46: Middle East & Africa Wireless Corrosion Sensor Volume Share (%), by Types 2025 & 2033
- Figure 47: Middle East & Africa Wireless Corrosion Sensor Revenue (billion), by Country 2025 & 2033
- Figure 48: Middle East & Africa Wireless Corrosion Sensor Volume (K), by Country 2025 & 2033
- Figure 49: Middle East & Africa Wireless Corrosion Sensor Revenue Share (%), by Country 2025 & 2033
- Figure 50: Middle East & Africa Wireless Corrosion Sensor Volume Share (%), by Country 2025 & 2033
- Figure 51: Asia Pacific Wireless Corrosion Sensor Revenue (billion), by Application 2025 & 2033
- Figure 52: Asia Pacific Wireless Corrosion Sensor Volume (K), by Application 2025 & 2033
- Figure 53: Asia Pacific Wireless Corrosion Sensor Revenue Share (%), by Application 2025 & 2033
- Figure 54: Asia Pacific Wireless Corrosion Sensor Volume Share (%), by Application 2025 & 2033
- Figure 55: Asia Pacific Wireless Corrosion Sensor Revenue (billion), by Types 2025 & 2033
- Figure 56: Asia Pacific Wireless Corrosion Sensor Volume (K), by Types 2025 & 2033
- Figure 57: Asia Pacific Wireless Corrosion Sensor Revenue Share (%), by Types 2025 & 2033
- Figure 58: Asia Pacific Wireless Corrosion Sensor Volume Share (%), by Types 2025 & 2033
- Figure 59: Asia Pacific Wireless Corrosion Sensor Revenue (billion), by Country 2025 & 2033
- Figure 60: Asia Pacific Wireless Corrosion Sensor Volume (K), by Country 2025 & 2033
- Figure 61: Asia Pacific Wireless Corrosion Sensor Revenue Share (%), by Country 2025 & 2033
- Figure 62: Asia Pacific Wireless Corrosion Sensor Volume Share (%), by Country 2025 & 2033
List of Tables
- Table 1: Global Wireless Corrosion Sensor Revenue billion Forecast, by Application 2020 & 2033
- Table 2: Global Wireless Corrosion Sensor Volume K Forecast, by Application 2020 & 2033
- Table 3: Global Wireless Corrosion Sensor Revenue billion Forecast, by Types 2020 & 2033
- Table 4: Global Wireless Corrosion Sensor Volume K Forecast, by Types 2020 & 2033
- Table 5: Global Wireless Corrosion Sensor Revenue billion Forecast, by Region 2020 & 2033
- Table 6: Global Wireless Corrosion Sensor Volume K Forecast, by Region 2020 & 2033
- Table 7: Global Wireless Corrosion Sensor Revenue billion Forecast, by Application 2020 & 2033
- Table 8: Global Wireless Corrosion Sensor Volume K Forecast, by Application 2020 & 2033
- Table 9: Global Wireless Corrosion Sensor Revenue billion Forecast, by Types 2020 & 2033
- Table 10: Global Wireless Corrosion Sensor Volume K Forecast, by Types 2020 & 2033
- Table 11: Global Wireless Corrosion Sensor Revenue billion Forecast, by Country 2020 & 2033
- Table 12: Global Wireless Corrosion Sensor Volume K Forecast, by Country 2020 & 2033
- Table 13: United States Wireless Corrosion Sensor Revenue (billion) Forecast, by Application 2020 & 2033
- Table 14: United States Wireless Corrosion Sensor Volume (K) Forecast, by Application 2020 & 2033
- Table 15: Canada Wireless Corrosion Sensor Revenue (billion) Forecast, by Application 2020 & 2033
- Table 16: Canada Wireless Corrosion Sensor Volume (K) Forecast, by Application 2020 & 2033
- Table 17: Mexico Wireless Corrosion Sensor Revenue (billion) Forecast, by Application 2020 & 2033
- Table 18: Mexico Wireless Corrosion Sensor Volume (K) Forecast, by Application 2020 & 2033
- Table 19: Global Wireless Corrosion Sensor Revenue billion Forecast, by Application 2020 & 2033
- Table 20: Global Wireless Corrosion Sensor Volume K Forecast, by Application 2020 & 2033
- Table 21: Global Wireless Corrosion Sensor Revenue billion Forecast, by Types 2020 & 2033
- Table 22: Global Wireless Corrosion Sensor Volume K Forecast, by Types 2020 & 2033
- Table 23: Global Wireless Corrosion Sensor Revenue billion Forecast, by Country 2020 & 2033
- Table 24: Global Wireless Corrosion Sensor Volume K Forecast, by Country 2020 & 2033
- Table 25: Brazil Wireless Corrosion Sensor Revenue (billion) Forecast, by Application 2020 & 2033
- Table 26: Brazil Wireless Corrosion Sensor Volume (K) Forecast, by Application 2020 & 2033
- Table 27: Argentina Wireless Corrosion Sensor Revenue (billion) Forecast, by Application 2020 & 2033
- Table 28: Argentina Wireless Corrosion Sensor Volume (K) Forecast, by Application 2020 & 2033
- Table 29: Rest of South America Wireless Corrosion Sensor Revenue (billion) Forecast, by Application 2020 & 2033
- Table 30: Rest of South America Wireless Corrosion Sensor Volume (K) Forecast, by Application 2020 & 2033
- Table 31: Global Wireless Corrosion Sensor Revenue billion Forecast, by Application 2020 & 2033
- Table 32: Global Wireless Corrosion Sensor Volume K Forecast, by Application 2020 & 2033
- Table 33: Global Wireless Corrosion Sensor Revenue billion Forecast, by Types 2020 & 2033
- Table 34: Global Wireless Corrosion Sensor Volume K Forecast, by Types 2020 & 2033
- Table 35: Global Wireless Corrosion Sensor Revenue billion Forecast, by Country 2020 & 2033
- Table 36: Global Wireless Corrosion Sensor Volume K Forecast, by Country 2020 & 2033
- Table 37: United Kingdom Wireless Corrosion Sensor Revenue (billion) Forecast, by Application 2020 & 2033
- Table 38: United Kingdom Wireless Corrosion Sensor Volume (K) Forecast, by Application 2020 & 2033
- Table 39: Germany Wireless Corrosion Sensor Revenue (billion) Forecast, by Application 2020 & 2033
- Table 40: Germany Wireless Corrosion Sensor Volume (K) Forecast, by Application 2020 & 2033
- Table 41: France Wireless Corrosion Sensor Revenue (billion) Forecast, by Application 2020 & 2033
- Table 42: France Wireless Corrosion Sensor Volume (K) Forecast, by Application 2020 & 2033
- Table 43: Italy Wireless Corrosion Sensor Revenue (billion) Forecast, by Application 2020 & 2033
- Table 44: Italy Wireless Corrosion Sensor Volume (K) Forecast, by Application 2020 & 2033
- Table 45: Spain Wireless Corrosion Sensor Revenue (billion) Forecast, by Application 2020 & 2033
- Table 46: Spain Wireless Corrosion Sensor Volume (K) Forecast, by Application 2020 & 2033
- Table 47: Russia Wireless Corrosion Sensor Revenue (billion) Forecast, by Application 2020 & 2033
- Table 48: Russia Wireless Corrosion Sensor Volume (K) Forecast, by Application 2020 & 2033
- Table 49: Benelux Wireless Corrosion Sensor Revenue (billion) Forecast, by Application 2020 & 2033
- Table 50: Benelux Wireless Corrosion Sensor Volume (K) Forecast, by Application 2020 & 2033
- Table 51: Nordics Wireless Corrosion Sensor Revenue (billion) Forecast, by Application 2020 & 2033
- Table 52: Nordics Wireless Corrosion Sensor Volume (K) Forecast, by Application 2020 & 2033
- Table 53: Rest of Europe Wireless Corrosion Sensor Revenue (billion) Forecast, by Application 2020 & 2033
- Table 54: Rest of Europe Wireless Corrosion Sensor Volume (K) Forecast, by Application 2020 & 2033
- Table 55: Global Wireless Corrosion Sensor Revenue billion Forecast, by Application 2020 & 2033
- Table 56: Global Wireless Corrosion Sensor Volume K Forecast, by Application 2020 & 2033
- Table 57: Global Wireless Corrosion Sensor Revenue billion Forecast, by Types 2020 & 2033
- Table 58: Global Wireless Corrosion Sensor Volume K Forecast, by Types 2020 & 2033
- Table 59: Global Wireless Corrosion Sensor Revenue billion Forecast, by Country 2020 & 2033
- Table 60: Global Wireless Corrosion Sensor Volume K Forecast, by Country 2020 & 2033
- Table 61: Turkey Wireless Corrosion Sensor Revenue (billion) Forecast, by Application 2020 & 2033
- Table 62: Turkey Wireless Corrosion Sensor Volume (K) Forecast, by Application 2020 & 2033
- Table 63: Israel Wireless Corrosion Sensor Revenue (billion) Forecast, by Application 2020 & 2033
- Table 64: Israel Wireless Corrosion Sensor Volume (K) Forecast, by Application 2020 & 2033
- Table 65: GCC Wireless Corrosion Sensor Revenue (billion) Forecast, by Application 2020 & 2033
- Table 66: GCC Wireless Corrosion Sensor Volume (K) Forecast, by Application 2020 & 2033
- Table 67: North Africa Wireless Corrosion Sensor Revenue (billion) Forecast, by Application 2020 & 2033
- Table 68: North Africa Wireless Corrosion Sensor Volume (K) Forecast, by Application 2020 & 2033
- Table 69: South Africa Wireless Corrosion Sensor Revenue (billion) Forecast, by Application 2020 & 2033
- Table 70: South Africa Wireless Corrosion Sensor Volume (K) Forecast, by Application 2020 & 2033
- Table 71: Rest of Middle East & Africa Wireless Corrosion Sensor Revenue (billion) Forecast, by Application 2020 & 2033
- Table 72: Rest of Middle East & Africa Wireless Corrosion Sensor Volume (K) Forecast, by Application 2020 & 2033
- Table 73: Global Wireless Corrosion Sensor Revenue billion Forecast, by Application 2020 & 2033
- Table 74: Global Wireless Corrosion Sensor Volume K Forecast, by Application 2020 & 2033
- Table 75: Global Wireless Corrosion Sensor Revenue billion Forecast, by Types 2020 & 2033
- Table 76: Global Wireless Corrosion Sensor Volume K Forecast, by Types 2020 & 2033
- Table 77: Global Wireless Corrosion Sensor Revenue billion Forecast, by Country 2020 & 2033
- Table 78: Global Wireless Corrosion Sensor Volume K Forecast, by Country 2020 & 2033
- Table 79: China Wireless Corrosion Sensor Revenue (billion) Forecast, by Application 2020 & 2033
- Table 80: China Wireless Corrosion Sensor Volume (K) Forecast, by Application 2020 & 2033
- Table 81: India Wireless Corrosion Sensor Revenue (billion) Forecast, by Application 2020 & 2033
- Table 82: India Wireless Corrosion Sensor Volume (K) Forecast, by Application 2020 & 2033
- Table 83: Japan Wireless Corrosion Sensor Revenue (billion) Forecast, by Application 2020 & 2033
- Table 84: Japan Wireless Corrosion Sensor Volume (K) Forecast, by Application 2020 & 2033
- Table 85: South Korea Wireless Corrosion Sensor Revenue (billion) Forecast, by Application 2020 & 2033
- Table 86: South Korea Wireless Corrosion Sensor Volume (K) Forecast, by Application 2020 & 2033
- Table 87: ASEAN Wireless Corrosion Sensor Revenue (billion) Forecast, by Application 2020 & 2033
- Table 88: ASEAN Wireless Corrosion Sensor Volume (K) Forecast, by Application 2020 & 2033
- Table 89: Oceania Wireless Corrosion Sensor Revenue (billion) Forecast, by Application 2020 & 2033
- Table 90: Oceania Wireless Corrosion Sensor Volume (K) Forecast, by Application 2020 & 2033
- Table 91: Rest of Asia Pacific Wireless Corrosion Sensor Revenue (billion) Forecast, by Application 2020 & 2033
- Table 92: Rest of Asia Pacific Wireless Corrosion Sensor Volume (K) Forecast, by Application 2020 & 2033
Frequently Asked Questions
1. What is the projected Compound Annual Growth Rate (CAGR) of the Wireless Corrosion Sensor?
The projected CAGR is approximately 13.83%.
2. Which companies are prominent players in the Wireless Corrosion Sensor?
Key companies in the market include CorrosionRADAR, Teledyne Cormon, Emerson, Southwest Research Institute, Southwest Research Institute, Corr Instruments, LLC, InfraSensing, Giatec Scientific Inc., Pepperl+Fuchs, Franklin Fueling Systems, Walchem, Hitachi, JFE Techno-Research, Cosasco, Pyxis Lab.
3. What are the main segments of the Wireless Corrosion Sensor?
The market segments include Application, Types.
4. Can you provide details about the market size?
The market size is estimated to be USD 9.67 billion as of 2022.
5. What are some drivers contributing to market growth?
N/A
6. What are the notable trends driving market growth?
N/A
7. Are there any restraints impacting market growth?
N/A
8. Can you provide examples of recent developments in the market?
N/A
9. What pricing options are available for accessing the report?
Pricing options include single-user, multi-user, and enterprise licenses priced at USD 4350.00, USD 6525.00, and USD 8700.00 respectively.
10. Is the market size provided in terms of value or volume?
The market size is provided in terms of value, measured in billion and volume, measured in K.
11. Are there any specific market keywords associated with the report?
Yes, the market keyword associated with the report is "Wireless Corrosion Sensor," which aids in identifying and referencing the specific market segment covered.
12. How do I determine which pricing option suits my needs best?
The pricing options vary based on user requirements and access needs. Individual users may opt for single-user licenses, while businesses requiring broader access may choose multi-user or enterprise licenses for cost-effective access to the report.
13. Are there any additional resources or data provided in the Wireless Corrosion Sensor report?
While the report offers comprehensive insights, it's advisable to review the specific contents or supplementary materials provided to ascertain if additional resources or data are available.
14. How can I stay updated on further developments or reports in the Wireless Corrosion Sensor?
To stay informed about further developments, trends, and reports in the Wireless Corrosion Sensor, consider subscribing to industry newsletters, following relevant companies and organizations, or regularly checking reputable industry news sources and publications.
Methodology
Step 1 - Identification of Relevant Samples Size from Population Database


Step 2 - Approaches for Defining Global Market Size (Value, Volume* & Price*)

Note*: In applicable scenarios
Step 3 - Data Sources
Primary Research
- Web Analytics
- Survey Reports
- Research Institute
- Latest Research Reports
- Opinion Leaders
Secondary Research
- Annual Reports
- White Paper
- Latest Press Release
- Industry Association
- Paid Database
- Investor Presentations

Step 4 - Data Triangulation
Involves using different sources of information in order to increase the validity of a study
These sources are likely to be stakeholders in a program - participants, other researchers, program staff, other community members, and so on.
Then we put all data in single framework & apply various statistical tools to find out the dynamic on the market.
During the analysis stage, feedback from the stakeholder groups would be compared to determine areas of agreement as well as areas of divergence