

Key Insights
The global Radiography Test Equipment market is experiencing robust expansion, projected to reach a substantial valuation of $1220 Million in 2025. This growth is underpinned by a compelling Compound Annual Growth Rate (CAGR) of 11.75% from 2025 to 2033. Key drivers propelling this market include the increasing stringency of safety and quality regulations across diverse industries, a growing focus on maintaining and inspecting aging infrastructure, and the continuous technological advancements in non-destructive testing (NDT) methodologies. Industries such as Aerospace and Defense, Oil and Gas, Automotive, and Manufacturing are significantly contributing to demand, driven by the critical need for defect detection, material integrity assessment, and quality control throughout production lifecycles. The shift from traditional film radiography to advanced digital solutions like Direct Radiography (DR) and Computed Tomography (CT) is a defining trend, offering enhanced accuracy, speed, and efficiency in inspection processes.
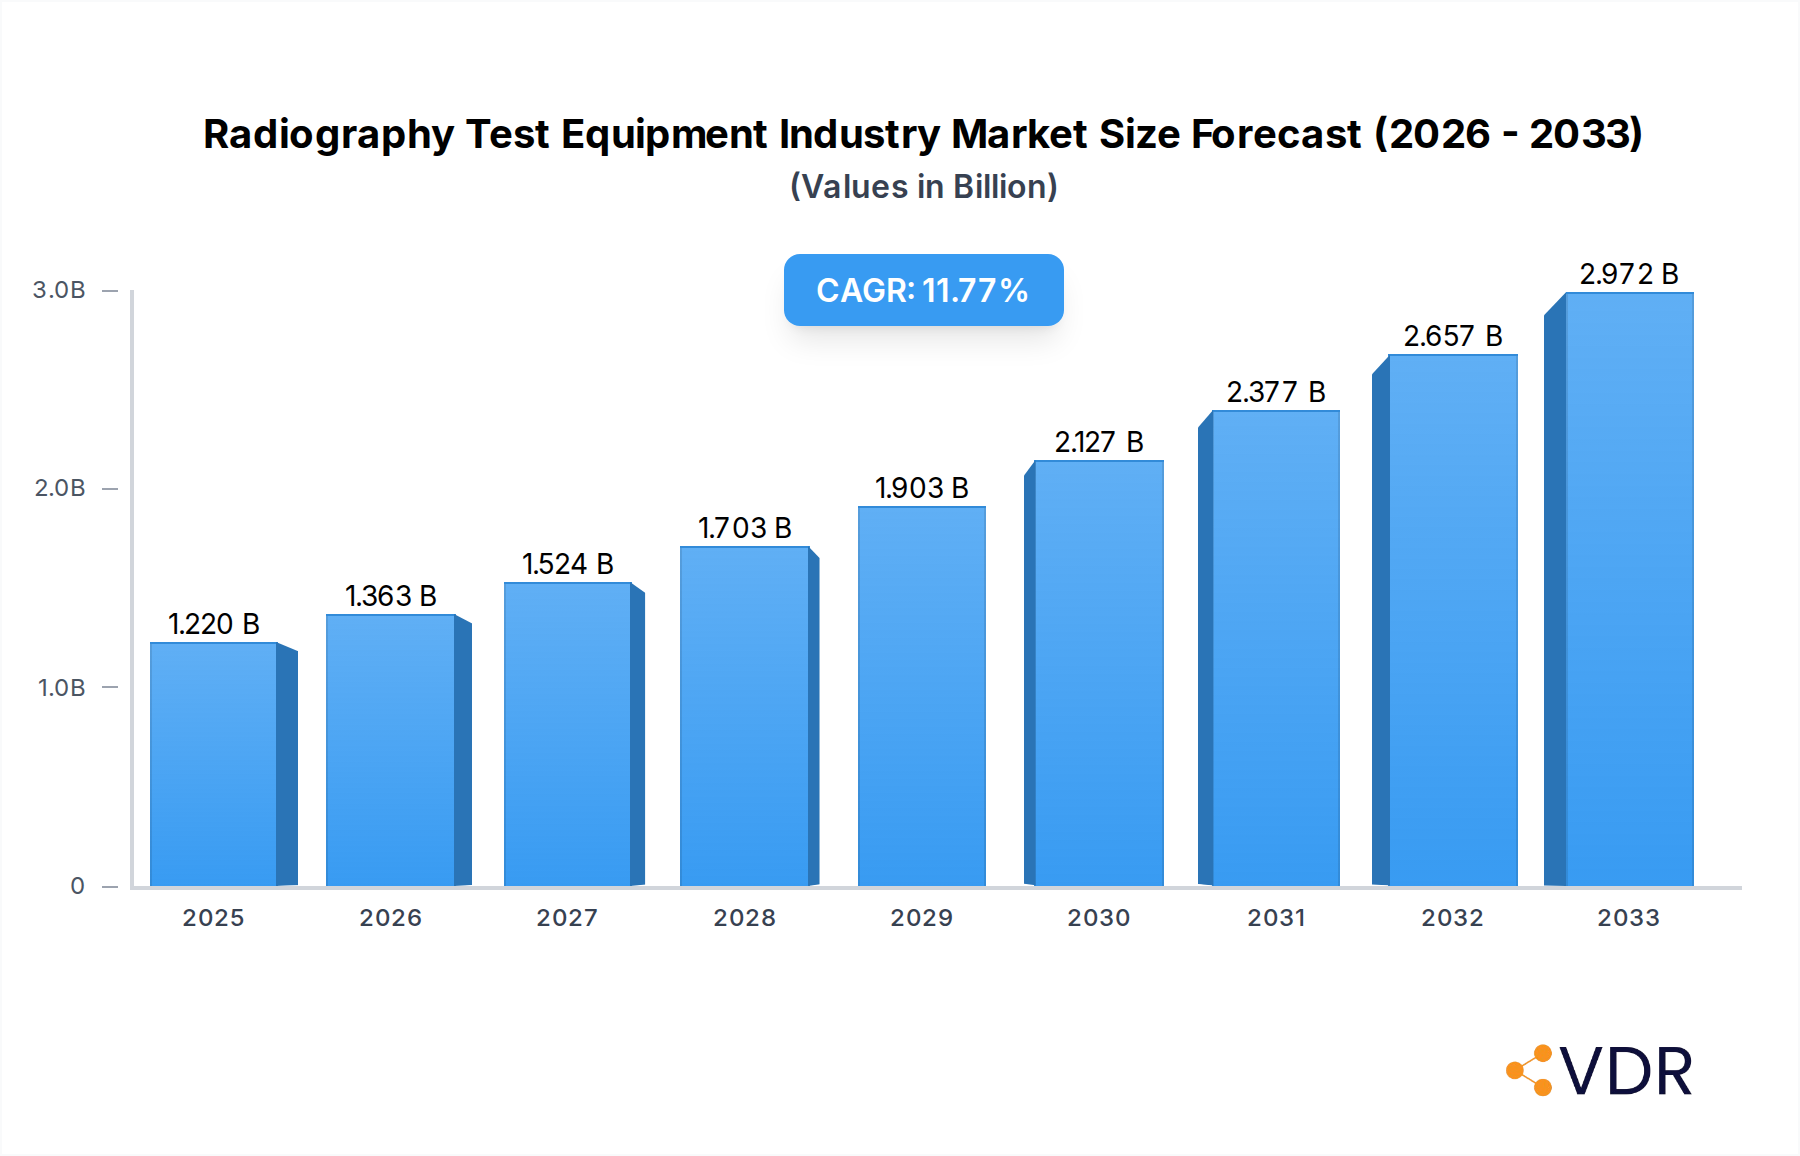
Radiography Test Equipment Industry Market Size (In Billion)
Looking ahead, the market is poised for further innovation and expansion, characterized by several transformative trends. The increasing adoption of automated radiography systems integrated with artificial intelligence (AI) and machine learning (ML) for advanced image analysis and defect recognition is a significant development, promising to reduce inspection times and improve reliability. Furthermore, the demand for portable and compact radiography equipment for on-site inspections in challenging environments continues to rise, providing flexibility and convenience. While high initial investment costs for cutting-edge equipment and a persistent shortage of skilled operators pose potential restraints, the imperative for robust quality control and asset integrity management across critical sectors ensures sustained market momentum. Asia Pacific is anticipated to emerge as a dominant region, fueled by rapid industrialization, infrastructure development, and growing manufacturing capabilities, while North America and Europe maintain significant market shares due to established industrial bases and stringent regulatory frameworks.

Radiography Test Equipment Industry Company Market Share
This comprehensive report provides an in-depth analysis of the Radiography Test Equipment Industry, a critical segment within the broader Non-Destructive Testing (NDT) market. Leveraging a study period from 2019 to 2033, with 2025 as the base and estimated year, and a forecast extending to 2033, this study meticulously examines market dynamics, growth drivers, and strategic opportunities. It incorporates high-traffic keywords such as Industrial X-ray, Computed Radiography (CR), Direct Radiography (DR), Computed Tomography (CT), NDT inspection, quality assurance, aerospace NDT, automotive inspection, and oil & gas NDT to ensure maximum visibility for industry professionals seeking crucial market intelligence. The report highlights how the robust growth of parent markets like global infrastructure development and advanced manufacturing directly accelerates demand in the child market of Radiography Test Equipment, offering unparalleled insights into market evolution and future potential.
Radiography Test Equipment Industry Market Dynamics & Structure
The Radiography Test Equipment Industry exhibits a moderately concentrated market structure, driven by a few dominant players alongside a vibrant ecosystem of specialized innovators. Market concentration is estimated with the top five companies, including Waygate Technologies, GE Healthcare, and Carestream Health, collectively holding approximately 55-60% of the global revenue share in 2025. Technological innovation acts as a primary driver, with continuous advancements in digital radiography (DR) and computed tomography (CT) enhancing image quality, speed, and automation. Regulatory frameworks, such as ASTM, ISO, and sector-specific standards (e.g., API for oil & gas, NADCAP for aerospace), significantly influence product development and adoption, ensuring safety and quality compliance across industries.
Competitive product substitutes, primarily other NDT methods like ultrasonic testing (UT), magnetic particle testing (MPT), and eddy current testing (ECT), pose a challenge, though radiography often remains indispensable for internal defect detection in complex structures. End-user demographics are shifting, with a growing demand for portable, high-resolution, and AI-integrated systems to address the needs of an increasingly distributed and sophisticated manufacturing landscape. The market has witnessed significant M&A trends, with major players acquiring specialized technology firms to expand their product portfolios and geographical reach. For instance, the historical period 2019-2024 saw M&A deal volumes totaling over $3.5 Billion, reflecting strategic consolidations and technology integrations aimed at capturing emerging market segments. Innovation barriers primarily include the high cost of advanced digital systems, the need for specialized operator training, and stringent regulatory approval processes that can prolong market entry for new technologies. However, the push for greater efficiency and reliability in industrial inspection continues to overcome these hurdles, fostering sustained investment in R&D and market expansion.
Radiography Test Equipment Industry Growth Trends & Insights
The Radiography Test Equipment Industry is on a robust growth trajectory, intrinsically linked to the expansion and technological evolution of its parent markets. The global imperative for enhanced safety, structural integrity, and quality control across critical sectors like aerospace, automotive, energy, and infrastructure development forms the bedrock of this growth. For example, massive investments in infrastructure globally, as exemplified by the Indian government's INR 111 Crore National Infrastructure Pipeline in August 2020, directly fuel demand for advanced radiography solutions to inspect welds, materials, and components in bridges, pipelines, and buildings. Similarly, the automotive industry's drive for lightweight materials and complex designs, highlighted by Ford Motor Co's USD 1.05 Billion investment in South African manufacturing in February 2021, necessitates sophisticated radiography for quality assurance and defect detection in critical engine parts and chassis. This interdependency underscores the role of Radiography Test Equipment as a pivotal child market, directly benefiting from economic expansion and technological advancements in its larger industrial ecosystem.
The market size for Radiography Test Equipment has evolved significantly, demonstrating a healthy Compound Annual Growth Rate (CAGR) of 7.8% during the forecast period of 2025-2033, projected to reach approximately $3.9 Billion by 2033. This growth is largely attributable to increasing adoption rates of digital radiography technologies over traditional film radiography. Digital solutions like Direct Radiography (DR) and Computed Radiography (CR) offer superior image quality, faster processing, and environmental benefits, driving their market penetration across various end-user verticals. Technological disruptions, particularly the integration of Artificial Intelligence (AI) and Machine Learning (ML) for automated defect recognition and data analytics, are revolutionizing inspection processes, enhancing efficiency, and reducing human error. Cloud connectivity and IoT capabilities are also transforming data management and remote monitoring, enabling predictive maintenance and more streamlined quality control workflows. Consumer behavior shifts among industrial clients indicate a strong preference for integrated, software-driven solutions that offer comprehensive data insights and are compatible with existing enterprise systems. The demand for portable and versatile radiography systems capable of on-site inspection in challenging environments, such as remote oil & gas pipelines or construction sites, is also rising. Furthermore, stringent regulatory requirements and the increasing emphasis on proactive maintenance to prevent costly failures continue to bolster the demand for reliable and accurate radiography test equipment, ensuring sustained market expansion into the next decade.
Dominant Regions, Countries, or Segments in Radiography Test Equipment Industry
The Asia-Pacific region is poised to dominate the Radiography Test Equipment Industry, driven by robust industrialization, massive infrastructure investments, and increasing adoption of stringent quality control standards. Countries like China, India, and Southeast Asian nations are witnessing unprecedented growth in manufacturing, automotive, aerospace, and construction sectors, creating a fertile ground for radiography solutions. The Indian government's National Infrastructure Pipeline, identifying 6,835 projects with an outlay of INR 111 Crore (approximately $13.3 Billion) in August 2020, exemplifies the scale of development necessitating advanced NDT. This economic boom, coupled with a rising awareness of industrial safety and product quality, positions Asia-Pacific as the leading market contributor, projected to hold over 40% of the global market share by 2033, with a CAGR exceeding 8.5% during the forecast period.
Within the technology segments, Direct Radiography (DR) is anticipated to be the fastest-growing and potentially dominant segment. Its superior image quality, instantaneous results, and environmental benefits over film radiography make it highly attractive for various industrial applications. DR systems offer enhanced throughput and seamless integration with digital workflows, driving adoption across high-volume manufacturing and critical inspection scenarios. While Computed Radiography (CR) continues to provide a valuable bridge from film, and Computed Tomography (CT) offers unparalleled 3D inspection capabilities for complex parts, DR's balance of efficiency, image resolution, and cost-effectiveness positions it for significant expansion. The segment is expected to reach an estimated market value of $1.5 Billion by 2033.
Among the end-user verticals, Manufacturing broadly stands out as a dominant force due to its diverse applications and vast scale. The need for quality assurance in every stage of production—from raw material inspection to final product verification—makes radiography indispensable. However, for specialized growth, the Aerospace and Defense vertical is projected to exhibit exceptional growth potential. The critical safety requirements, the increasing use of advanced composites, and the necessity for flaw detection in high-stress components drive a consistent demand for cutting-edge radiography solutions, particularly high-resolution CT and DR systems. The industry's stringent regulatory environment and zero-tolerance for defects necessitate continuous investment in the most advanced and reliable testing equipment. This segment, though smaller in volume than general manufacturing, commands premium prices for highly specialized equipment and services.
- Key Drivers for Regional Dominance (Asia-Pacific):
- Rapid industrialization and manufacturing expansion.
- Large-scale infrastructure development projects.
- Increasing foreign direct investment in manufacturing hubs (e.g., Ford's investment in South Africa is indicative of similar trends elsewhere, including Asia).
- Growing adoption of international quality and safety standards.
- Favorable government policies promoting industrial growth and NDT adoption.
- A burgeoning pool of skilled labor and research capabilities.
Radiography Test Equipment Industry Product Landscape
The Radiography Test Equipment Industry product landscape is characterized by continuous innovation, moving rapidly from traditional film-based systems to advanced digital solutions. Direct Radiography (DR) panels, offering instantaneous high-resolution images, and Computed Radiography (CR) systems, providing a digital alternative to film with existing X-ray generators, are at the forefront. Computed Tomography (CT) systems are increasingly vital for 3D internal structure analysis in aerospace, automotive, and medical device manufacturing, enabling volumetric inspection. Companies like Waygate Technologies and GE Healthcare lead with robust industrial X-ray and CT scanners, while Carestream Health specializes in digital radiography solutions. Olympus, Zeiss, and Nikon Metrology offer precision metrology-grade CT systems for intricate part inspection. Fujifilm provides advanced CR solutions, and SLB is prominent in oil & gas inspection. TeraRecon focuses on AI-powered image processing, enhancing diagnostic accuracy and speed. Performance metrics continually improve, with advancements in detector technology, X-ray sources, and software, delivering superior spatial resolution, contrast sensitivity, and faster cycle times, thereby boosting throughput and reliability in critical industrial applications.
Key Drivers, Barriers & Challenges in Radiography Test Equipment Industry
The Radiography Test Equipment Industry is primarily propelled by several key drivers. Technologically, the ongoing shift from analog film to digital solutions like Direct Radiography (DR) and Computed Tomography (CT) offers enhanced speed, precision, and environmental benefits, accelerating adoption. Economically, the robust expansion of manufacturing, aerospace, automotive, energy, and infrastructure sectors globally necessitates stringent quality control and safety standards. For instance, the extensive infrastructure projects in India (INR 111 Crore National Infrastructure Pipeline) and manufacturing investments (Ford's USD 1.05 Billion in South Africa) directly translate into increased demand for NDT solutions. Policy-driven factors, including evolving international safety regulations and quality assurance mandates, further compel industries to implement advanced radiography testing, ensuring compliance and reducing the risk of failures.
Despite its growth, the industry faces significant challenges and restraints. High initial capital investment for advanced digital radiography and CT systems can be a substantial barrier, especially for small and medium-sized enterprises (SMEs). Supply chain issues, exacerbated by global events, can lead to delays in component delivery and increase production costs for equipment manufacturers. Regulatory hurdles, while driving adoption, also impose strict requirements for equipment certification and operator training, adding complexity and cost. Intense competitive pressures, particularly in established markets, push down profit margins and necessitate continuous innovation. The scarcity of skilled radiography technicians and interpreters also poses an operational challenge, impacting the efficient deployment and utilization of sophisticated equipment. These factors collectively require strategic planning and investment to mitigate their quantifiable impacts on market growth and accessibility.
Emerging Opportunities in Radiography Test Equipment Industry
Emerging opportunities in the Radiography Test Equipment Industry are largely driven by advancements in digital technologies and the expansion into new application areas. The increasing demand for portable and mobile radiography solutions offers significant untapped market potential, particularly for on-site inspections in remote locations, disaster management, and small-scale manufacturing. Innovative applications include the inspection of additive manufactured (3D printed) components, which require high-resolution volumetric analysis that only advanced CT systems can provide. The integration of Artificial Intelligence (AI) and Machine Learning (ML) for automated defect recognition and predictive maintenance offers a burgeoning opportunity to enhance efficiency, reduce inspection times, and minimize human error. Evolving consumer preferences among industrial users lean towards integrated solutions that offer data analytics, cloud connectivity, and remote monitoring capabilities, creating new avenues for service-based models and software innovation. The development of multi-modality NDT solutions, combining radiography with other inspection techniques, also presents a novel opportunity for comprehensive material characterization and defect detection. These trends highlight a dynamic future for the industry, ripe with potential for technological leadership and market expansion.
Growth Accelerators in the Radiography Test Equipment Industry Industry
Several catalysts are driving long-term growth in the Radiography Test Equipment Industry. Foremost are technological breakthroughs, particularly in detector technology (e.g., higher resolution, faster frame rates), X-ray sources (e.g., micro-focus, nano-focus), and advanced image processing software. These innovations enhance inspection capabilities, making radiography applicable to new materials and complex geometries, such as those found in additive manufacturing or advanced composites. Strategic partnerships between equipment manufacturers (e.g., Waygate Technologies, Carestream Health) and software developers (e.g., TeraRecon for AI imaging) are accelerating the integration of smart analytics and automation, leading to more efficient and accurate inspection workflows. Furthermore, global market expansion strategies, especially targeting emerging economies in Asia-Pacific and Latin America, are unlocking vast new customer bases. The increasing adoption of industry 4.0 principles, emphasizing automation, data exchange, and smart manufacturing, inherently boosts the demand for sophisticated, connected radiography solutions, transforming traditional quality control into intelligent, predictive maintenance, thereby securing sustained industry growth.
Key Players Shaping the Radiography Test Equipment Industry Market
- Waygate Technologies
- GE Healthcare
- Carestream Health
- Olympus
- Zeiss
- Fujifilm
- SLB
- Nikon Metrology
- Hexagon
- TeraRecon
Notable Milestones in Radiography Test Equipment Industry Sector
- August 2020: The Indian government identified and listed 6,835 projects under its INR 111 Crore National Infrastructure Pipeline to attract investments in infrastructure development. This initiative significantly boosted the demand for NDT solutions, including radiography test equipment, for inspecting welds, materials, and structural integrity across various large-scale construction and energy projects, emphasizing quality and safety compliance.
- February 2021: Ford Motor Co announced to invest USD 1.05 Billion in its South African manufacturing operations, which includes upgrades to expand production of its Ranger pickup truck. This substantial investment in advanced manufacturing facilities drives the need for sophisticated radiography test equipment for in-line quality control, material inspection, and defect detection in automotive components, aligning with global trends in smart manufacturing and precision engineering.
In-Depth Radiography Test Equipment Industry Market Outlook
The future outlook for the Radiography Test Equipment Industry is exceptionally promising, underpinned by a confluence of growth accelerators that assure sustained expansion. The relentless march of technological innovation, particularly in AI-driven image analysis, enhanced detector sensitivity, and the miniaturization of X-ray sources, will continue to expand the application scope of radiography into new materials and complex structures. Strategic partnerships and collaborations between hardware manufacturers and software developers are poised to deliver fully integrated, automated inspection platforms, significantly boosting efficiency and accuracy. Furthermore, ongoing global infrastructure development, the robust growth of high-value manufacturing sectors, and increasing regulatory emphasis on safety and quality will consistently fuel demand. The market is projected to reach approximately $3.9 Billion by 2033, demonstrating a resilient CAGR of 7.8% during the forecast period. Untapped opportunities in portable solutions, additive manufacturing inspection, and data-driven predictive maintenance will define strategic pathways for leading players, solidifying radiography test equipment's critical role in ensuring industrial integrity and safety for decades to come.
Radiography Test Equipment Industry Segmentation
-
1. Technology
- 1.1. Film Radiography
- 1.2. Computed Radiography
- 1.3. Direct Radiography
- 1.4. Computed Tomography
-
2. End-user Vertical
- 2.1. Aerospace and Defense
- 2.2. Energy and Power
- 2.3. Construction
- 2.4. Oil and Gas
- 2.5. Automotive
- 2.6. Manufacturing
- 2.7. Other End-user Industries
Radiography Test Equipment Industry Segmentation By Geography
- 1. North America
- 2. Europe
- 3. Asia Pacific
- 4. Latin America
- 5. Middle East
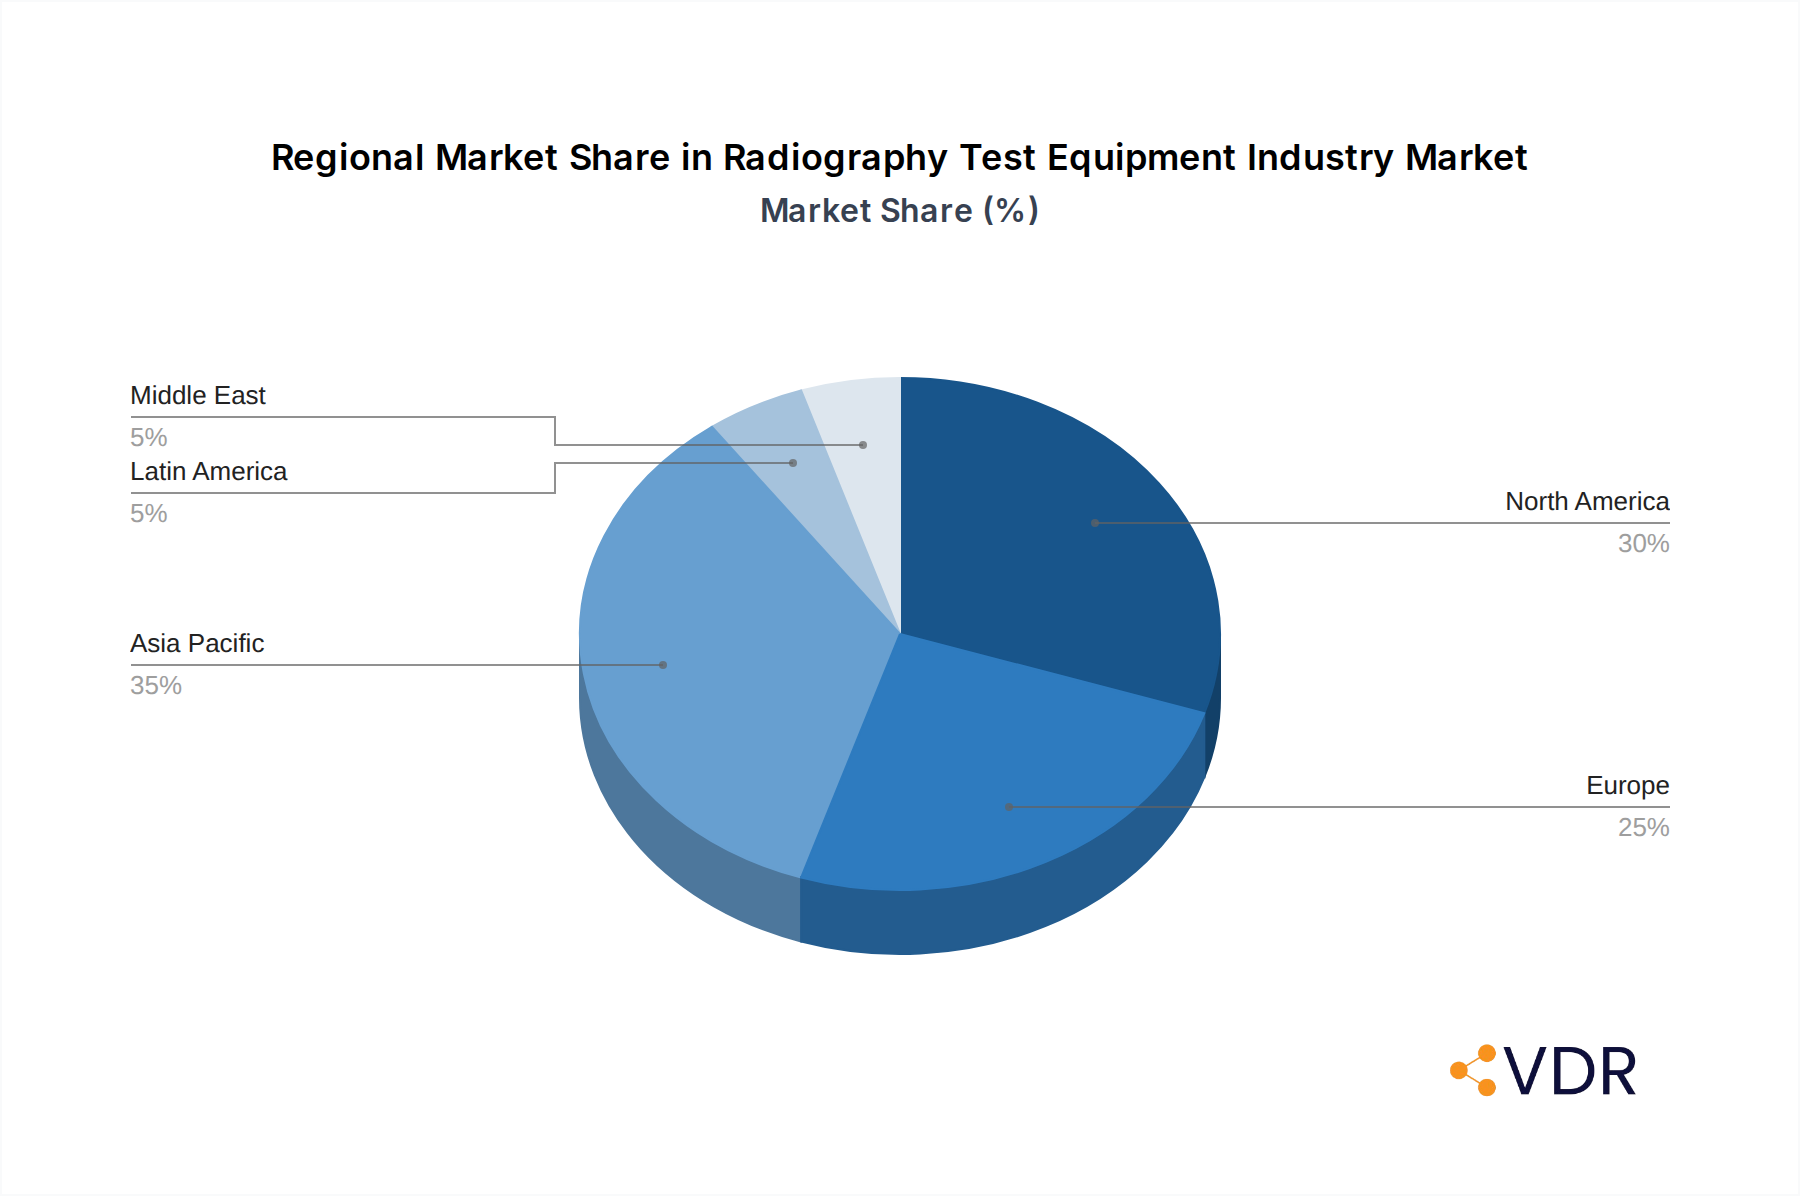
Radiography Test Equipment Industry Regional Market Share
Geographic Coverage of Radiography Test Equipment Industry
Radiography Test Equipment Industry REPORT HIGHLIGHTS
| Aspects | Details |
|---|---|
| Study Period | 2020-2034 |
| Base Year | 2025 |
| Estimated Year | 2026 |
| Forecast Period | 2026-2034 |
| Historical Period | 2020-2025 |
| Growth Rate | CAGR of 11.75% from 2020-2034 |
| Segmentation |
|
Table of Contents
- 1. Introduction
- 1.1. Research Scope
- 1.2. Market Segmentation
- 1.3. Research Objective
- 1.4. Definitions and Assumptions
- 2. Executive Summary
- 2.1. Market Snapshot
- 3. Market Dynamics
- 3.1. Market Drivers
- 3.2. Market Restrains
- 3.3. Market Trends
- 3.4. Market Opportunities
- 4. Market Factor Analysis
- 4.1. Porters Five Forces
- 4.1.1. Bargaining Power of Suppliers
- 4.1.2. Bargaining Power of Buyers
- 4.1.3. Threat of New Entrants
- 4.1.4. Threat of Substitutes
- 4.1.5. Competitive Rivalry
- 4.2. PESTEL analysis
- 4.3. BCG Analysis
- 4.3.1. Stars (High Growth, High Market Share)
- 4.3.2. Cash Cows (Low Growth, High Market Share)
- 4.3.3. Question Mark (High Growth, Low Market Share)
- 4.3.4. Dogs (Low Growth, Low Market Share)
- 4.4. Ansoff Matrix Analysis
- 4.5. Supply Chain Analysis
- 4.6. Regulatory Landscape
- 4.7. Current Market Potential and Opportunity Assessment (TAM–SAM–SOM Framework)
- 4.8. VDR Analyst Note
- 4.1. Porters Five Forces
- 5. Market Analysis, Insights and Forecast 2021-2033
- 5.1. Market Analysis, Insights and Forecast - by Technology
- 5.1.1. Film Radiography
- 5.1.2. Computed Radiography
- 5.1.3. Direct Radiography
- 5.1.4. Computed Tomography
- 5.2. Market Analysis, Insights and Forecast - by End-user Vertical
- 5.2.1. Aerospace and Defense
- 5.2.2. Energy and Power
- 5.2.3. Construction
- 5.2.4. Oil and Gas
- 5.2.5. Automotive
- 5.2.6. Manufacturing
- 5.2.7. Other End-user Industries
- 5.3. Market Analysis, Insights and Forecast - by Region
- 5.3.1. North America
- 5.3.2. Europe
- 5.3.3. Asia Pacific
- 5.3.4. Latin America
- 5.3.5. Middle East
- 5.1. Market Analysis, Insights and Forecast - by Technology
- 6. Global Radiography Test Equipment Industry Analysis, Insights and Forecast, 2021-2033
- 6.1. Market Analysis, Insights and Forecast - by Technology
- 6.1.1. Film Radiography
- 6.1.2. Computed Radiography
- 6.1.3. Direct Radiography
- 6.1.4. Computed Tomography
- 6.2. Market Analysis, Insights and Forecast - by End-user Vertical
- 6.2.1. Aerospace and Defense
- 6.2.2. Energy and Power
- 6.2.3. Construction
- 6.2.4. Oil and Gas
- 6.2.5. Automotive
- 6.2.6. Manufacturing
- 6.2.7. Other End-user Industries
- 6.1. Market Analysis, Insights and Forecast - by Technology
- 7. North America Radiography Test Equipment Industry Analysis, Insights and Forecast, 2021-2033
- 7.1. Market Analysis, Insights and Forecast - by Technology
- 7.1.1. Film Radiography
- 7.1.2. Computed Radiography
- 7.1.3. Direct Radiography
- 7.1.4. Computed Tomography
- 7.2. Market Analysis, Insights and Forecast - by End-user Vertical
- 7.2.1. Aerospace and Defense
- 7.2.2. Energy and Power
- 7.2.3. Construction
- 7.2.4. Oil and Gas
- 7.2.5. Automotive
- 7.2.6. Manufacturing
- 7.2.7. Other End-user Industries
- 7.1. Market Analysis, Insights and Forecast - by Technology
- 8. Europe Radiography Test Equipment Industry Analysis, Insights and Forecast, 2021-2033
- 8.1. Market Analysis, Insights and Forecast - by Technology
- 8.1.1. Film Radiography
- 8.1.2. Computed Radiography
- 8.1.3. Direct Radiography
- 8.1.4. Computed Tomography
- 8.2. Market Analysis, Insights and Forecast - by End-user Vertical
- 8.2.1. Aerospace and Defense
- 8.2.2. Energy and Power
- 8.2.3. Construction
- 8.2.4. Oil and Gas
- 8.2.5. Automotive
- 8.2.6. Manufacturing
- 8.2.7. Other End-user Industries
- 8.1. Market Analysis, Insights and Forecast - by Technology
- 9. Asia Pacific Radiography Test Equipment Industry Analysis, Insights and Forecast, 2021-2033
- 9.1. Market Analysis, Insights and Forecast - by Technology
- 9.1.1. Film Radiography
- 9.1.2. Computed Radiography
- 9.1.3. Direct Radiography
- 9.1.4. Computed Tomography
- 9.2. Market Analysis, Insights and Forecast - by End-user Vertical
- 9.2.1. Aerospace and Defense
- 9.2.2. Energy and Power
- 9.2.3. Construction
- 9.2.4. Oil and Gas
- 9.2.5. Automotive
- 9.2.6. Manufacturing
- 9.2.7. Other End-user Industries
- 9.1. Market Analysis, Insights and Forecast - by Technology
- 10. Latin America Radiography Test Equipment Industry Analysis, Insights and Forecast, 2021-2033
- 10.1. Market Analysis, Insights and Forecast - by Technology
- 10.1.1. Film Radiography
- 10.1.2. Computed Radiography
- 10.1.3. Direct Radiography
- 10.1.4. Computed Tomography
- 10.2. Market Analysis, Insights and Forecast - by End-user Vertical
- 10.2.1. Aerospace and Defense
- 10.2.2. Energy and Power
- 10.2.3. Construction
- 10.2.4. Oil and Gas
- 10.2.5. Automotive
- 10.2.6. Manufacturing
- 10.2.7. Other End-user Industries
- 10.1. Market Analysis, Insights and Forecast - by Technology
- 11. Middle East Radiography Test Equipment Industry Analysis, Insights and Forecast, 2021-2033
- 11.1. Market Analysis, Insights and Forecast - by Technology
- 11.1.1. Film Radiography
- 11.1.2. Computed Radiography
- 11.1.3. Direct Radiography
- 11.1.4. Computed Tomography
- 11.2. Market Analysis, Insights and Forecast - by End-user Vertical
- 11.2.1. Aerospace and Defense
- 11.2.2. Energy and Power
- 11.2.3. Construction
- 11.2.4. Oil and Gas
- 11.2.5. Automotive
- 11.2.6. Manufacturing
- 11.2.7. Other End-user Industries
- 11.1. Market Analysis, Insights and Forecast - by Technology
- 12. Competitive Analysis
- 12.1. Company Profiles
- 12.1.1 Waygate Technologies
- 12.1.1.1. Company Overview
- 12.1.1.2. Products
- 12.1.1.3. Company Financials
- 12.1.1.4. SWOT Analysis
- 12.1.2 GE Healthcare
- 12.1.2.1. Company Overview
- 12.1.2.2. Products
- 12.1.2.3. Company Financials
- 12.1.2.4. SWOT Analysis
- 12.1.3 Carestream Health
- 12.1.3.1. Company Overview
- 12.1.3.2. Products
- 12.1.3.3. Company Financials
- 12.1.3.4. SWOT Analysis
- 12.1.4 Olympus
- 12.1.4.1. Company Overview
- 12.1.4.2. Products
- 12.1.4.3. Company Financials
- 12.1.4.4. SWOT Analysis
- 12.1.5 Zeiss
- 12.1.5.1. Company Overview
- 12.1.5.2. Products
- 12.1.5.3. Company Financials
- 12.1.5.4. SWOT Analysis
- 12.1.6 Fujifilm
- 12.1.6.1. Company Overview
- 12.1.6.2. Products
- 12.1.6.3. Company Financials
- 12.1.6.4. SWOT Analysis
- 12.1.7 SLB
- 12.1.7.1. Company Overview
- 12.1.7.2. Products
- 12.1.7.3. Company Financials
- 12.1.7.4. SWOT Analysis
- 12.1.8 Nikon Metrology
- 12.1.8.1. Company Overview
- 12.1.8.2. Products
- 12.1.8.3. Company Financials
- 12.1.8.4. SWOT Analysis
- 12.1.9 Hexagon
- 12.1.9.1. Company Overview
- 12.1.9.2. Products
- 12.1.9.3. Company Financials
- 12.1.9.4. SWOT Analysis
- 12.1.10 TeraRecon
- 12.1.10.1. Company Overview
- 12.1.10.2. Products
- 12.1.10.3. Company Financials
- 12.1.10.4. SWOT Analysis
- 12.1.1 Waygate Technologies
- 12.2. Market Entropy
- 12.2.1 Company's Key Areas Served
- 12.2.2 Recent Developments
- 12.3. Company Market Share Analysis 2025
- 12.3.1 Top 5 Companies Market Share Analysis
- 12.3.2 Top 3 Companies Market Share Analysis
- 12.4. List of Potential Customers
- 13. Research Methodology
List of Figures
- Figure 1: Global Radiography Test Equipment Industry Revenue Breakdown (Million, %) by Region 2025 & 2033
- Figure 2: Global Radiography Test Equipment Industry Volume Breakdown (K Units, %) by Region 2025 & 2033
- Figure 3: North America Radiography Test Equipment Industry Revenue (Million), by Technology 2025 & 2033
- Figure 4: North America Radiography Test Equipment Industry Volume (K Units), by Technology 2025 & 2033
- Figure 5: North America Radiography Test Equipment Industry Revenue Share (%), by Technology 2025 & 2033
- Figure 6: North America Radiography Test Equipment Industry Volume Share (%), by Technology 2025 & 2033
- Figure 7: North America Radiography Test Equipment Industry Revenue (Million), by End-user Vertical 2025 & 2033
- Figure 8: North America Radiography Test Equipment Industry Volume (K Units), by End-user Vertical 2025 & 2033
- Figure 9: North America Radiography Test Equipment Industry Revenue Share (%), by End-user Vertical 2025 & 2033
- Figure 10: North America Radiography Test Equipment Industry Volume Share (%), by End-user Vertical 2025 & 2033
- Figure 11: North America Radiography Test Equipment Industry Revenue (Million), by Country 2025 & 2033
- Figure 12: North America Radiography Test Equipment Industry Volume (K Units), by Country 2025 & 2033
- Figure 13: North America Radiography Test Equipment Industry Revenue Share (%), by Country 2025 & 2033
- Figure 14: North America Radiography Test Equipment Industry Volume Share (%), by Country 2025 & 2033
- Figure 15: Europe Radiography Test Equipment Industry Revenue (Million), by Technology 2025 & 2033
- Figure 16: Europe Radiography Test Equipment Industry Volume (K Units), by Technology 2025 & 2033
- Figure 17: Europe Radiography Test Equipment Industry Revenue Share (%), by Technology 2025 & 2033
- Figure 18: Europe Radiography Test Equipment Industry Volume Share (%), by Technology 2025 & 2033
- Figure 19: Europe Radiography Test Equipment Industry Revenue (Million), by End-user Vertical 2025 & 2033
- Figure 20: Europe Radiography Test Equipment Industry Volume (K Units), by End-user Vertical 2025 & 2033
- Figure 21: Europe Radiography Test Equipment Industry Revenue Share (%), by End-user Vertical 2025 & 2033
- Figure 22: Europe Radiography Test Equipment Industry Volume Share (%), by End-user Vertical 2025 & 2033
- Figure 23: Europe Radiography Test Equipment Industry Revenue (Million), by Country 2025 & 2033
- Figure 24: Europe Radiography Test Equipment Industry Volume (K Units), by Country 2025 & 2033
- Figure 25: Europe Radiography Test Equipment Industry Revenue Share (%), by Country 2025 & 2033
- Figure 26: Europe Radiography Test Equipment Industry Volume Share (%), by Country 2025 & 2033
- Figure 27: Asia Pacific Radiography Test Equipment Industry Revenue (Million), by Technology 2025 & 2033
- Figure 28: Asia Pacific Radiography Test Equipment Industry Volume (K Units), by Technology 2025 & 2033
- Figure 29: Asia Pacific Radiography Test Equipment Industry Revenue Share (%), by Technology 2025 & 2033
- Figure 30: Asia Pacific Radiography Test Equipment Industry Volume Share (%), by Technology 2025 & 2033
- Figure 31: Asia Pacific Radiography Test Equipment Industry Revenue (Million), by End-user Vertical 2025 & 2033
- Figure 32: Asia Pacific Radiography Test Equipment Industry Volume (K Units), by End-user Vertical 2025 & 2033
- Figure 33: Asia Pacific Radiography Test Equipment Industry Revenue Share (%), by End-user Vertical 2025 & 2033
- Figure 34: Asia Pacific Radiography Test Equipment Industry Volume Share (%), by End-user Vertical 2025 & 2033
- Figure 35: Asia Pacific Radiography Test Equipment Industry Revenue (Million), by Country 2025 & 2033
- Figure 36: Asia Pacific Radiography Test Equipment Industry Volume (K Units), by Country 2025 & 2033
- Figure 37: Asia Pacific Radiography Test Equipment Industry Revenue Share (%), by Country 2025 & 2033
- Figure 38: Asia Pacific Radiography Test Equipment Industry Volume Share (%), by Country 2025 & 2033
- Figure 39: Latin America Radiography Test Equipment Industry Revenue (Million), by Technology 2025 & 2033
- Figure 40: Latin America Radiography Test Equipment Industry Volume (K Units), by Technology 2025 & 2033
- Figure 41: Latin America Radiography Test Equipment Industry Revenue Share (%), by Technology 2025 & 2033
- Figure 42: Latin America Radiography Test Equipment Industry Volume Share (%), by Technology 2025 & 2033
- Figure 43: Latin America Radiography Test Equipment Industry Revenue (Million), by End-user Vertical 2025 & 2033
- Figure 44: Latin America Radiography Test Equipment Industry Volume (K Units), by End-user Vertical 2025 & 2033
- Figure 45: Latin America Radiography Test Equipment Industry Revenue Share (%), by End-user Vertical 2025 & 2033
- Figure 46: Latin America Radiography Test Equipment Industry Volume Share (%), by End-user Vertical 2025 & 2033
- Figure 47: Latin America Radiography Test Equipment Industry Revenue (Million), by Country 2025 & 2033
- Figure 48: Latin America Radiography Test Equipment Industry Volume (K Units), by Country 2025 & 2033
- Figure 49: Latin America Radiography Test Equipment Industry Revenue Share (%), by Country 2025 & 2033
- Figure 50: Latin America Radiography Test Equipment Industry Volume Share (%), by Country 2025 & 2033
- Figure 51: Middle East Radiography Test Equipment Industry Revenue (Million), by Technology 2025 & 2033
- Figure 52: Middle East Radiography Test Equipment Industry Volume (K Units), by Technology 2025 & 2033
- Figure 53: Middle East Radiography Test Equipment Industry Revenue Share (%), by Technology 2025 & 2033
- Figure 54: Middle East Radiography Test Equipment Industry Volume Share (%), by Technology 2025 & 2033
- Figure 55: Middle East Radiography Test Equipment Industry Revenue (Million), by End-user Vertical 2025 & 2033
- Figure 56: Middle East Radiography Test Equipment Industry Volume (K Units), by End-user Vertical 2025 & 2033
- Figure 57: Middle East Radiography Test Equipment Industry Revenue Share (%), by End-user Vertical 2025 & 2033
- Figure 58: Middle East Radiography Test Equipment Industry Volume Share (%), by End-user Vertical 2025 & 2033
- Figure 59: Middle East Radiography Test Equipment Industry Revenue (Million), by Country 2025 & 2033
- Figure 60: Middle East Radiography Test Equipment Industry Volume (K Units), by Country 2025 & 2033
- Figure 61: Middle East Radiography Test Equipment Industry Revenue Share (%), by Country 2025 & 2033
- Figure 62: Middle East Radiography Test Equipment Industry Volume Share (%), by Country 2025 & 2033
List of Tables
- Table 1: Global Radiography Test Equipment Industry Revenue Million Forecast, by Technology 2020 & 2033
- Table 2: Global Radiography Test Equipment Industry Volume K Units Forecast, by Technology 2020 & 2033
- Table 3: Global Radiography Test Equipment Industry Revenue Million Forecast, by End-user Vertical 2020 & 2033
- Table 4: Global Radiography Test Equipment Industry Volume K Units Forecast, by End-user Vertical 2020 & 2033
- Table 5: Global Radiography Test Equipment Industry Revenue Million Forecast, by Region 2020 & 2033
- Table 6: Global Radiography Test Equipment Industry Volume K Units Forecast, by Region 2020 & 2033
- Table 7: Global Radiography Test Equipment Industry Revenue Million Forecast, by Technology 2020 & 2033
- Table 8: Global Radiography Test Equipment Industry Volume K Units Forecast, by Technology 2020 & 2033
- Table 9: Global Radiography Test Equipment Industry Revenue Million Forecast, by End-user Vertical 2020 & 2033
- Table 10: Global Radiography Test Equipment Industry Volume K Units Forecast, by End-user Vertical 2020 & 2033
- Table 11: Global Radiography Test Equipment Industry Revenue Million Forecast, by Country 2020 & 2033
- Table 12: Global Radiography Test Equipment Industry Volume K Units Forecast, by Country 2020 & 2033
- Table 13: Global Radiography Test Equipment Industry Revenue Million Forecast, by Technology 2020 & 2033
- Table 14: Global Radiography Test Equipment Industry Volume K Units Forecast, by Technology 2020 & 2033
- Table 15: Global Radiography Test Equipment Industry Revenue Million Forecast, by End-user Vertical 2020 & 2033
- Table 16: Global Radiography Test Equipment Industry Volume K Units Forecast, by End-user Vertical 2020 & 2033
- Table 17: Global Radiography Test Equipment Industry Revenue Million Forecast, by Country 2020 & 2033
- Table 18: Global Radiography Test Equipment Industry Volume K Units Forecast, by Country 2020 & 2033
- Table 19: Global Radiography Test Equipment Industry Revenue Million Forecast, by Technology 2020 & 2033
- Table 20: Global Radiography Test Equipment Industry Volume K Units Forecast, by Technology 2020 & 2033
- Table 21: Global Radiography Test Equipment Industry Revenue Million Forecast, by End-user Vertical 2020 & 2033
- Table 22: Global Radiography Test Equipment Industry Volume K Units Forecast, by End-user Vertical 2020 & 2033
- Table 23: Global Radiography Test Equipment Industry Revenue Million Forecast, by Country 2020 & 2033
- Table 24: Global Radiography Test Equipment Industry Volume K Units Forecast, by Country 2020 & 2033
- Table 25: Global Radiography Test Equipment Industry Revenue Million Forecast, by Technology 2020 & 2033
- Table 26: Global Radiography Test Equipment Industry Volume K Units Forecast, by Technology 2020 & 2033
- Table 27: Global Radiography Test Equipment Industry Revenue Million Forecast, by End-user Vertical 2020 & 2033
- Table 28: Global Radiography Test Equipment Industry Volume K Units Forecast, by End-user Vertical 2020 & 2033
- Table 29: Global Radiography Test Equipment Industry Revenue Million Forecast, by Country 2020 & 2033
- Table 30: Global Radiography Test Equipment Industry Volume K Units Forecast, by Country 2020 & 2033
- Table 31: Global Radiography Test Equipment Industry Revenue Million Forecast, by Technology 2020 & 2033
- Table 32: Global Radiography Test Equipment Industry Volume K Units Forecast, by Technology 2020 & 2033
- Table 33: Global Radiography Test Equipment Industry Revenue Million Forecast, by End-user Vertical 2020 & 2033
- Table 34: Global Radiography Test Equipment Industry Volume K Units Forecast, by End-user Vertical 2020 & 2033
- Table 35: Global Radiography Test Equipment Industry Revenue Million Forecast, by Country 2020 & 2033
- Table 36: Global Radiography Test Equipment Industry Volume K Units Forecast, by Country 2020 & 2033
Frequently Asked Questions
1. What is the projected Compound Annual Growth Rate (CAGR) of the Radiography Test Equipment Industry?
The projected CAGR is approximately 11.75%.
2. Which companies are prominent players in the Radiography Test Equipment Industry?
Key companies in the market include Waygate Technologies, GE Healthcare, Carestream Health, Olympus , Zeiss, Fujifilm, SLB, Nikon Metrology , Hexagon, TeraRecon.
3. What are the main segments of the Radiography Test Equipment Industry?
The market segments include Technology, End-user Vertical.
4. Can you provide details about the market size?
The market size is estimated to be USD 1.22 Million as of 2022.
5. What are some drivers contributing to market growth?
Advent of Portable Radiography Equipment.
6. What are the notable trends driving market growth?
Application in Aerospace to Account for a Significant Portion of the Market Demand.
7. Are there any restraints impacting market growth?
Rising Privacy and Security Concerns.
8. Can you provide examples of recent developments in the market?
August 2020 - The Indian government identified and listed 6,835 projects under its INR 111 crore National Infrastructure Pipeline to attract investments in infrastructure development.
9. What pricing options are available for accessing the report?
Pricing options include single-user, multi-user, and enterprise licenses priced at USD 4750, USD 5250, and USD 8750 respectively.
10. Is the market size provided in terms of value or volume?
The market size is provided in terms of value, measured in Million and volume, measured in K Units.
11. Are there any specific market keywords associated with the report?
Yes, the market keyword associated with the report is "Radiography Test Equipment Industry," which aids in identifying and referencing the specific market segment covered.
12. How do I determine which pricing option suits my needs best?
The pricing options vary based on user requirements and access needs. Individual users may opt for single-user licenses, while businesses requiring broader access may choose multi-user or enterprise licenses for cost-effective access to the report.
13. Are there any additional resources or data provided in the Radiography Test Equipment Industry report?
While the report offers comprehensive insights, it's advisable to review the specific contents or supplementary materials provided to ascertain if additional resources or data are available.
14. How can I stay updated on further developments or reports in the Radiography Test Equipment Industry?
To stay informed about further developments, trends, and reports in the Radiography Test Equipment Industry, consider subscribing to industry newsletters, following relevant companies and organizations, or regularly checking reputable industry news sources and publications.
Methodology
Step 1 - Identification of Relevant Samples Size from Population Database


Step 2 - Approaches for Defining Global Market Size (Value, Volume* & Price*)

Note*: In applicable scenarios
Step 3 - Data Sources
Primary Research
- Web Analytics
- Survey Reports
- Research Institute
- Latest Research Reports
- Opinion Leaders
Secondary Research
- Annual Reports
- White Paper
- Latest Press Release
- Industry Association
- Paid Database
- Investor Presentations

Step 4 - Data Triangulation
Involves using different sources of information in order to increase the validity of a study
These sources are likely to be stakeholders in a program - participants, other researchers, program staff, other community members, and so on.
Then we put all data in single framework & apply various statistical tools to find out the dynamic on the market.
During the analysis stage, feedback from the stakeholder groups would be compared to determine areas of agreement as well as areas of divergence