

Key Insights
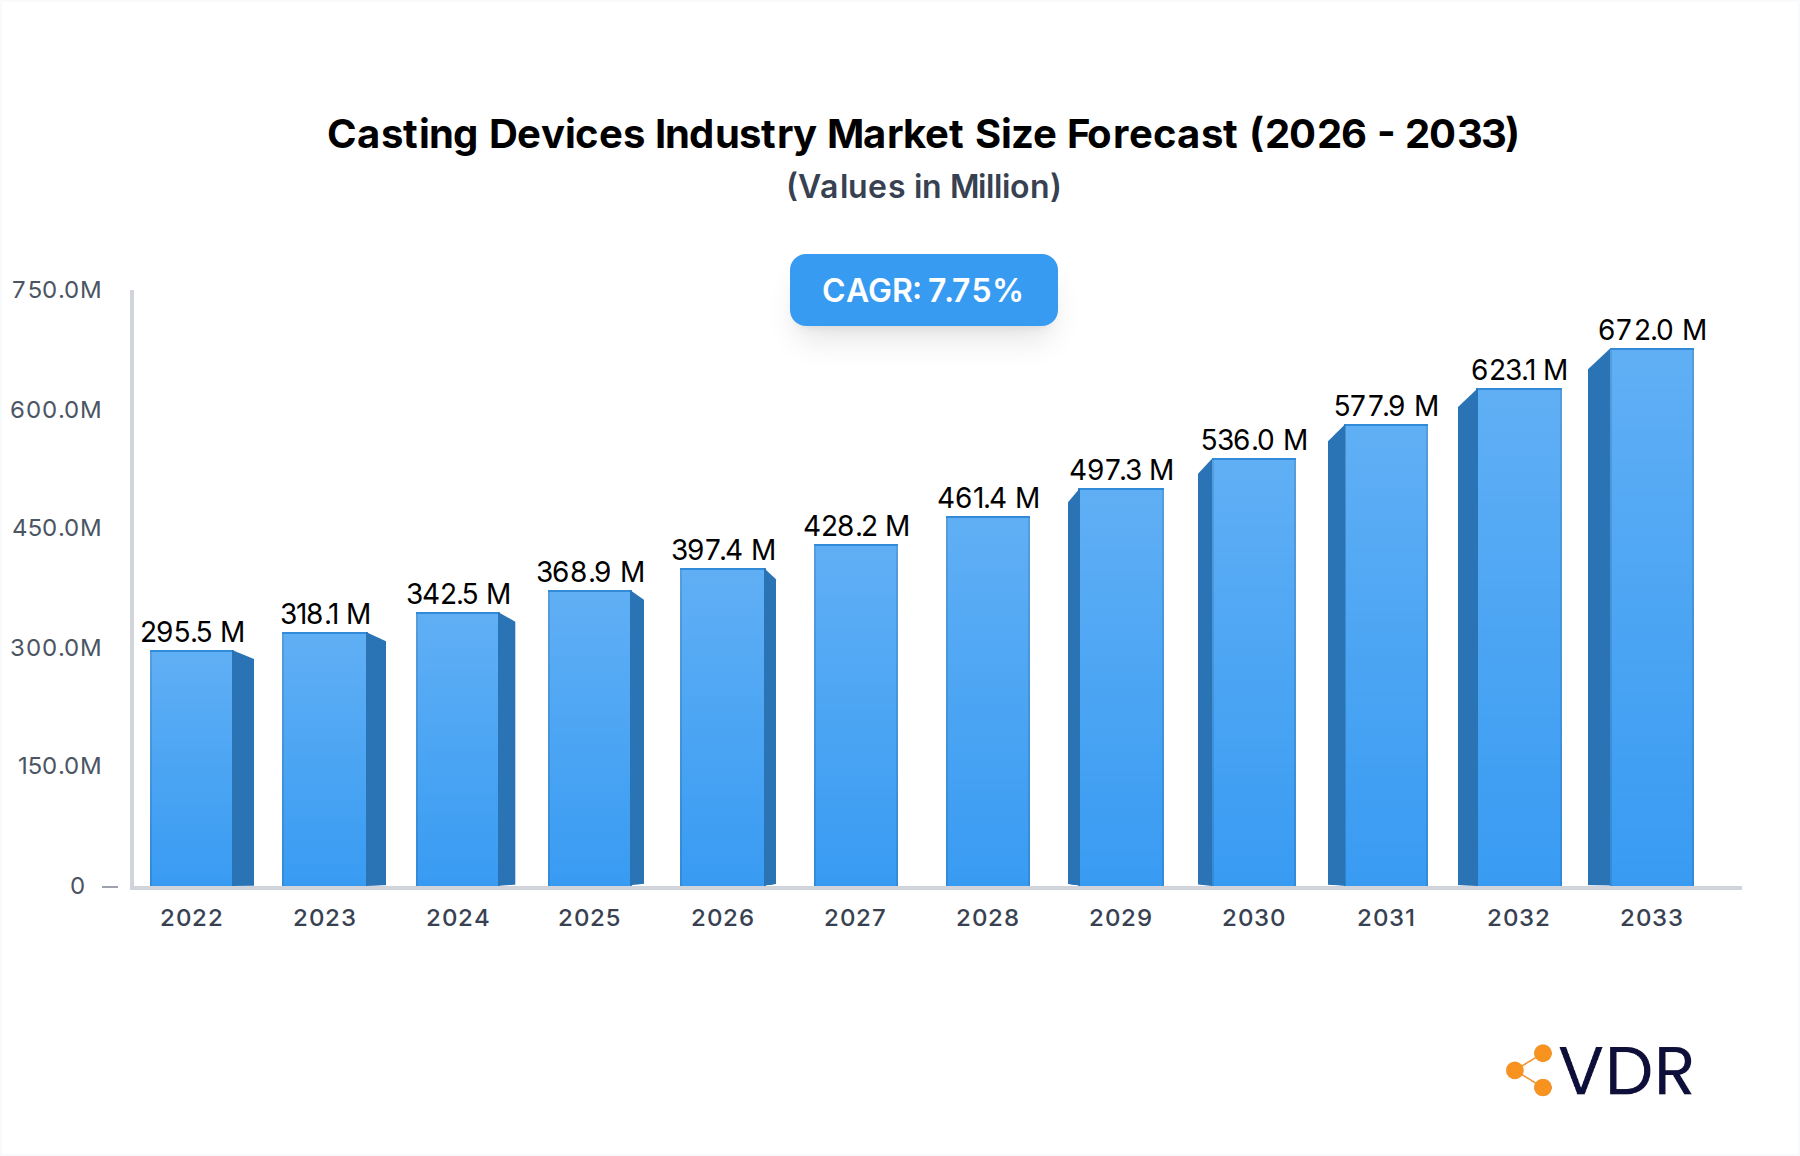
The Casting Devices Industry is poised for substantial growth, driven by the escalating demand for seamless content sharing and entertainment across various platforms. With a current estimated market size of USD 295.51 million as of 2022 and a projected Compound Annual Growth Rate (CAGR) of 7.56%, the market is expected to expand significantly through 2033. Key growth drivers include the proliferation of smart home ecosystems, the increasing adoption of high-definition streaming content, and the convenience offered by wireless casting solutions in both residential and commercial settings. The expanding capabilities of smart TVs and the growing popularity of media streamers are further fueling this upward trajectory. The industry benefits from an innovative landscape where companies are continuously introducing enhanced user experiences and broader device compatibility.

Casting Devices Industry Market Size (In Million)
The market is segmented by type into Game Consoles, Media Streamers, and Smart TVs, with Media Streamers and Smart TVs expected to capture a larger share due to their widespread consumer adoption. End-user segments comprise Commercial and Residential, with the residential sector currently dominating due to increased home entertainment spending. However, the commercial segment is showing robust growth, driven by its application in meeting rooms, education, and digital signage. While a wealth of innovation drives the market, potential restraints could include increasing internet dependency for seamless casting, and evolving regulatory landscapes around content streaming and data privacy. Geographically, North America and Asia Pacific are anticipated to lead market expansion, owing to their early adoption of advanced technologies and a large consumer base.
Casting Devices Industry Company Market Share
Unlock unparalleled insights into the dynamic Casting Devices industry with this comprehensive market research report. Spanning from 2019 to 2033, this study delves deep into market dynamics, growth trends, regional dominance, product innovation, and the strategic landscape. We meticulously analyze the interplay between parent and child markets, providing a granular understanding of how various segments and applications are shaping the future of seamless content streaming and device interaction. This report is an indispensable resource for industry professionals seeking to navigate competitive pressures, capitalize on emerging opportunities, and drive strategic growth in the global casting devices market.
Casting Devices Industry Market Dynamics & Structure
The Casting Devices industry exhibits a moderate market concentration, with key players like Samsung Electronics Co Ltd, LG Electronics Inc, Microsoft Corporation, Amazon com Inc, and Google Inc holding significant shares. Technological innovation remains a primary driver, fueled by advancements in wireless protocols (Wi-Fi 6, Bluetooth 5.0), ultra-high definition streaming capabilities, and artificial intelligence for personalized content recommendations. Regulatory frameworks, primarily focused on data privacy and content licensing, influence market entry and product development. Competitive product substitutes, including built-in smart TV casting features and dedicated smart home hubs, continuously challenge standalone casting devices. End-user demographics are shifting, with a growing demand for seamless integration in both residential and commercial settings. Mergers and acquisitions (M&A) are a notable trend, with strategic acquisitions aimed at expanding product portfolios and market reach. For instance, in the historical period 2019-2024, an estimated 15 M&A deals were recorded, indicating consolidation and strategic realignment. Innovation barriers include the high cost of R&D for next-generation technologies and the need for widespread ecosystem compatibility.
- Market Concentration: Moderately concentrated, with a few dominant players.
- Technological Innovation Drivers: Wi-Fi 6/6E, 8K streaming, AI-powered features, Matter protocol integration.
- Regulatory Frameworks: Data privacy (GDPR, CCPA), content licensing, interoperability standards.
- Competitive Product Substitutes: Integrated smart TV casting, game consoles with streaming apps, smart displays.
- End-User Demographics: Growing demand from both residential and commercial sectors, with a focus on ease of use and seamless integration.
- M&A Trends: Strategic acquisitions to broaden product offerings and strengthen market position. The volume of M&A deals in the 2019-2024 period is estimated at 15 transactions, with an average deal value of xx million USD.
Casting Devices Industry Growth Trends & Insights
The global Casting Devices industry is projected to witness robust growth, driven by an escalating demand for convenient and versatile content streaming solutions across residential and commercial applications. The market size evolution is marked by a consistent upward trajectory, with the installed base of casting devices projected to reach xx million units by 2025, growing to xx million units by 2033. Adoption rates are significantly influenced by increasing penetration of high-speed internet services and the proliferation of smart home ecosystems. Technological disruptions, such as the evolution of Wi-Fi standards and the emergence of AI-driven user experiences, are creating new avenues for growth and product differentiation. Consumer behavior shifts are pivotal, with a discernible move towards over-the-top (OTT) content consumption and a preference for seamless content sharing across multiple devices. The CAGR for the forecast period 2025–2033 is estimated at xx%, reflecting sustained market expansion. Market penetration is expected to surge from xx% in 2025 to xx% by 2033, particularly in emerging economies. The increasing adoption of media streamers and smart TVs as primary entertainment hubs further bolsters this growth. The integration of casting functionalities into gaming consoles, such as those offered by Microsoft Corporation and Sony (indirectly through app partnerships), is also expanding the addressable market. For instance, the Media Streamers segment is anticipated to grow at a CAGR of xx%, reaching xx million units by 2033.
Dominant Regions, Countries, or Segments in Casting Devices Industry
The Media Streamers segment, within the broader Casting Devices industry, is identified as a key driver of market growth, exhibiting exceptional dominance. This segment encompasses a wide array of devices designed specifically for streaming digital media, including popular offerings from Roku Inc, Amazon com Inc, and Google Inc. The rapid adoption of these devices in Residential end-user segments globally, coupled with their increasing presence in Commercial settings like hotels and meeting rooms, underscores their widespread appeal. North America currently leads in market share, driven by high disposable incomes, a well-established digital infrastructure, and a mature OTT content consumption landscape. The United States, in particular, represents a significant market due to the early adoption of smart home technologies and a strong consumer preference for flexible entertainment options.
- Dominant Segment: Media Streamers are leading the growth, propelled by their versatility and affordability.
- Leading End-User Segment: Residential users constitute the largest consumer base, with growing adoption in commercial spaces.
- Dominant Region: North America, particularly the United States, currently holds the largest market share.
- Key Drivers in North America: High disposable income, advanced internet infrastructure, strong OTT platform penetration, and early adoption of smart home technology.
- Market Share & Growth Potential: The Media Streamers segment is expected to account for xx% of the total casting devices market by 2025, with a projected CAGR of xx% during the forecast period. Countries like Canada and Mexico are also showing significant growth potential. The commercial adoption in hospitality and enterprise sectors, driven by the need for easy content sharing and presentations, is also a substantial growth factor. The increasing availability of 4K and HDR content further fuels the demand for high-performance media streamers.
Casting Devices Industry Product Landscape
The casting devices industry is characterized by continuous product innovation, focusing on enhanced user experience, superior streaming quality, and broader compatibility. Devices now offer seamless integration with various platforms, supporting high-definition video and immersive audio. Key innovations include advancements in wireless connectivity for faster data transfer, AI-powered features for personalized content discovery, and enhanced security protocols. Applications range from casual content sharing for entertainment in residential settings to critical presentation and collaboration tools in commercial environments. Performance metrics such as latency, resolution support (4K, 8K), and power efficiency are constantly being improved. Unique selling propositions include ease of setup, intuitive user interfaces, and compatibility with a wide array of smart home ecosystems and operating systems.
Key Drivers, Barriers & Challenges in Casting Devices Industry
Key Drivers:
- Rising Demand for OTT Content: The burgeoning popularity of streaming services fuels the need for efficient content delivery devices.
- Smart Home Ecosystem Expansion: Integration with smart home devices creates a more connected and convenient user experience.
- Technological Advancements: Improvements in Wi-Fi speeds, resolution support (4K/8K), and processing power enhance device performance.
- Increasing Internet Penetration: Wider access to high-speed internet globally enables seamless streaming.
- Gaming Industry Growth: Casting functionalities within game consoles allow for streaming gameplay and entertainment.
Barriers & Challenges:
- Interoperability Issues: Ensuring seamless compatibility across different operating systems and device manufacturers remains a hurdle.
- Content Licensing and Copyright: Navigating complex content rights and regional restrictions can be challenging.
- Security and Privacy Concerns: Protecting user data and preventing unauthorized access are critical.
- Supply Chain Disruptions: Geopolitical events and manufacturing complexities can impact product availability and cost. An estimated xx% of manufacturers faced significant supply chain disruptions in 2023, impacting production by xx million units.
- Price Sensitivity: While demand is high, consumers remain sensitive to the cost of advanced casting devices.
Emerging Opportunities in Casting Devices Industry
Emerging opportunities lie in the increasing demand for enterprise-grade casting solutions for hybrid work environments, enabling seamless collaboration and remote presentation sharing. The integration of AI for predictive content delivery and personalized user interfaces presents a significant avenue for innovation. Untapped markets in developing economies, with growing internet penetration and disposable incomes, offer substantial growth potential. Furthermore, the development of specialized casting devices for niche applications, such as educational institutions and healthcare facilities, can open new market segments. The evolving landscape of augmented reality (AR) and virtual reality (VR) content also presents opportunities for advanced casting technologies to deliver immersive experiences.
Growth Accelerators in the Casting Devices Industry Industry
Long-term growth in the Casting Devices industry will be significantly propelled by ongoing technological breakthroughs, particularly in the realm of 5G connectivity and next-generation Wi-Fi standards, which promise even lower latency and higher bandwidth for streaming. Strategic partnerships between hardware manufacturers, content providers, and platform developers will be crucial for fostering ecosystem growth and enhancing user adoption. Market expansion strategies targeting underserved regions and developing economies, coupled with the introduction of more affordable and feature-rich devices, will unlock new consumer bases. The growing adoption of the Matter protocol, aiming to unify smart home device connectivity, will also act as a significant growth accelerator by simplifying device integration and enhancing user experience.
Key Players Shaping the Casting Devices Industry Market
- LG Electronics Inc
- Anycast
- Hisense Co Ltd
- Samsung Electronics Co Ltd
- Mirascreen
- Microsoft Corporation
- Amazon com Inc
- Airtame ApS
- Roku Inc
- Nvidia Corporation
- Google Inc
- Apple Inc
- EZCast
Notable Milestones in Casting Devices Industry Sector
- 2020: Introduction of Wi-Fi 6-enabled casting devices, significantly improving streaming speeds and reducing latency.
- 2021: Enhanced integration of voice control and AI-powered personalization features across major casting platforms.
- 2022: Increased focus on security and privacy features in casting devices following growing user concerns.
- 2023: The launch of next-generation media streamers supporting 8K resolution and advanced HDR formats, setting new benchmarks for visual quality.
- 2024: Growing momentum for the Matter protocol adoption, promising greater interoperability across smart home ecosystems.
In-Depth Casting Devices Industry Market Outlook
The future outlook for the Casting Devices industry is exceptionally promising, driven by a convergence of accelerating technological advancements and evolving consumer preferences. The continued expansion of the smart home ecosystem, coupled with the increasing demand for seamless content streaming across all devices, will act as primary growth accelerators. Strategic alliances between key players, such as those between Samsung Electronics Co Ltd and Google Inc, are expected to foster innovation and expand market reach. The penetration of high-speed internet infrastructure globally, especially in emerging economies, will unlock significant untapped market potential. Investments in research and development for next-generation technologies, including AI-driven personalization and immersive content delivery, will further solidify the industry's growth trajectory, positioning casting devices as indispensable components of modern digital lifestyles.
Casting Devices Industry Segmentation
-
1. Type
- 1.1. Game Consoles
- 1.2. Media Streamers
- 1.3. Smart TVs
-
2. End-User
- 2.1. Commercial
- 2.2. Residential
Casting Devices Industry Segmentation By Geography
- 1. North America
- 2. Europe
- 3. Asia Pacific
- 4. Rest of the World

Casting Devices Industry Regional Market Share
Geographic Coverage of Casting Devices Industry
Casting Devices Industry REPORT HIGHLIGHTS
| Aspects | Details |
|---|---|
| Study Period | 2020-2034 |
| Base Year | 2025 |
| Estimated Year | 2026 |
| Forecast Period | 2026-2034 |
| Historical Period | 2020-2025 |
| Growth Rate | CAGR of 7.56% from 2020-2034 |
| Segmentation |
|
Table of Contents
- 1. Introduction
- 1.1. Research Scope
- 1.2. Market Segmentation
- 1.3. Research Objective
- 1.4. Definitions and Assumptions
- 2. Executive Summary
- 2.1. Market Snapshot
- 3. Market Dynamics
- 3.1. Market Drivers
- 3.2. Market Restrains
- 3.3. Market Trends
- 3.4. Market Opportunities
- 4. Market Factor Analysis
- 4.1. Porters Five Forces
- 4.1.1. Bargaining Power of Suppliers
- 4.1.2. Bargaining Power of Buyers
- 4.1.3. Threat of New Entrants
- 4.1.4. Threat of Substitutes
- 4.1.5. Competitive Rivalry
- 4.2. PESTEL analysis
- 4.3. BCG Analysis
- 4.3.1. Stars (High Growth, High Market Share)
- 4.3.2. Cash Cows (Low Growth, High Market Share)
- 4.3.3. Question Mark (High Growth, Low Market Share)
- 4.3.4. Dogs (Low Growth, Low Market Share)
- 4.4. Ansoff Matrix Analysis
- 4.5. Supply Chain Analysis
- 4.6. Regulatory Landscape
- 4.7. Current Market Potential and Opportunity Assessment (TAM–SAM–SOM Framework)
- 4.8. VDR Analyst Note
- 4.1. Porters Five Forces
- 5. Market Analysis, Insights and Forecast 2021-2033
- 5.1. Market Analysis, Insights and Forecast - by Type
- 5.1.1. Game Consoles
- 5.1.2. Media Streamers
- 5.1.3. Smart TVs
- 5.2. Market Analysis, Insights and Forecast - by End-User
- 5.2.1. Commercial
- 5.2.2. Residential
- 5.3. Market Analysis, Insights and Forecast - by Region
- 5.3.1. North America
- 5.3.2. Europe
- 5.3.3. Asia Pacific
- 5.3.4. Rest of the World
- 5.1. Market Analysis, Insights and Forecast - by Type
- 6. Global Casting Devices Industry Analysis, Insights and Forecast, 2021-2033
- 6.1. Market Analysis, Insights and Forecast - by Type
- 6.1.1. Game Consoles
- 6.1.2. Media Streamers
- 6.1.3. Smart TVs
- 6.2. Market Analysis, Insights and Forecast - by End-User
- 6.2.1. Commercial
- 6.2.2. Residential
- 6.1. Market Analysis, Insights and Forecast - by Type
- 7. North America Casting Devices Industry Analysis, Insights and Forecast, 2021-2033
- 7.1. Market Analysis, Insights and Forecast - by Type
- 7.1.1. Game Consoles
- 7.1.2. Media Streamers
- 7.1.3. Smart TVs
- 7.2. Market Analysis, Insights and Forecast - by End-User
- 7.2.1. Commercial
- 7.2.2. Residential
- 7.1. Market Analysis, Insights and Forecast - by Type
- 8. Europe Casting Devices Industry Analysis, Insights and Forecast, 2021-2033
- 8.1. Market Analysis, Insights and Forecast - by Type
- 8.1.1. Game Consoles
- 8.1.2. Media Streamers
- 8.1.3. Smart TVs
- 8.2. Market Analysis, Insights and Forecast - by End-User
- 8.2.1. Commercial
- 8.2.2. Residential
- 8.1. Market Analysis, Insights and Forecast - by Type
- 9. Asia Pacific Casting Devices Industry Analysis, Insights and Forecast, 2021-2033
- 9.1. Market Analysis, Insights and Forecast - by Type
- 9.1.1. Game Consoles
- 9.1.2. Media Streamers
- 9.1.3. Smart TVs
- 9.2. Market Analysis, Insights and Forecast - by End-User
- 9.2.1. Commercial
- 9.2.2. Residential
- 9.1. Market Analysis, Insights and Forecast - by Type
- 10. Rest of the World Casting Devices Industry Analysis, Insights and Forecast, 2021-2033
- 10.1. Market Analysis, Insights and Forecast - by Type
- 10.1.1. Game Consoles
- 10.1.2. Media Streamers
- 10.1.3. Smart TVs
- 10.2. Market Analysis, Insights and Forecast - by End-User
- 10.2.1. Commercial
- 10.2.2. Residential
- 10.1. Market Analysis, Insights and Forecast - by Type
- 11. Competitive Analysis
- 11.1. Company Profiles
- 11.1.1 LG Electronics Inc
- 11.1.1.1. Company Overview
- 11.1.1.2. Products
- 11.1.1.3. Company Financials
- 11.1.1.4. SWOT Analysis
- 11.1.2 Anycast
- 11.1.2.1. Company Overview
- 11.1.2.2. Products
- 11.1.2.3. Company Financials
- 11.1.2.4. SWOT Analysis
- 11.1.3 Hisense Co Ltd
- 11.1.3.1. Company Overview
- 11.1.3.2. Products
- 11.1.3.3. Company Financials
- 11.1.3.4. SWOT Analysis
- 11.1.4 Samsung Electronics Co Ltd
- 11.1.4.1. Company Overview
- 11.1.4.2. Products
- 11.1.4.3. Company Financials
- 11.1.4.4. SWOT Analysis
- 11.1.5 Mirascreen
- 11.1.5.1. Company Overview
- 11.1.5.2. Products
- 11.1.5.3. Company Financials
- 11.1.5.4. SWOT Analysis
- 11.1.6 Microsoft Corporation
- 11.1.6.1. Company Overview
- 11.1.6.2. Products
- 11.1.6.3. Company Financials
- 11.1.6.4. SWOT Analysis
- 11.1.7 Amazon com Inc
- 11.1.7.1. Company Overview
- 11.1.7.2. Products
- 11.1.7.3. Company Financials
- 11.1.7.4. SWOT Analysis
- 11.1.8 Airtame ApS
- 11.1.8.1. Company Overview
- 11.1.8.2. Products
- 11.1.8.3. Company Financials
- 11.1.8.4. SWOT Analysis
- 11.1.9 Roku Inc
- 11.1.9.1. Company Overview
- 11.1.9.2. Products
- 11.1.9.3. Company Financials
- 11.1.9.4. SWOT Analysis
- 11.1.10 Nvidia Corporation
- 11.1.10.1. Company Overview
- 11.1.10.2. Products
- 11.1.10.3. Company Financials
- 11.1.10.4. SWOT Analysis
- 11.1.11 Google Inc
- 11.1.11.1. Company Overview
- 11.1.11.2. Products
- 11.1.11.3. Company Financials
- 11.1.11.4. SWOT Analysis
- 11.1.12 Apple Inc
- 11.1.12.1. Company Overview
- 11.1.12.2. Products
- 11.1.12.3. Company Financials
- 11.1.12.4. SWOT Analysis
- 11.1.13 EZCast
- 11.1.13.1. Company Overview
- 11.1.13.2. Products
- 11.1.13.3. Company Financials
- 11.1.13.4. SWOT Analysis
- 11.1.1 LG Electronics Inc
- 11.2. Market Entropy
- 11.2.1 Company's Key Areas Served
- 11.2.2 Recent Developments
- 11.3. Company Market Share Analysis 2025
- 11.3.1 Top 5 Companies Market Share Analysis
- 11.3.2 Top 3 Companies Market Share Analysis
- 11.4. List of Potential Customers
- 12. Research Methodology
List of Figures
- Figure 1: Global Casting Devices Industry Revenue Breakdown (million, %) by Region 2025 & 2033
- Figure 2: Global Casting Devices Industry Volume Breakdown (K Unit, %) by Region 2025 & 2033
- Figure 3: North America Casting Devices Industry Revenue (million), by Type 2025 & 2033
- Figure 4: North America Casting Devices Industry Volume (K Unit), by Type 2025 & 2033
- Figure 5: North America Casting Devices Industry Revenue Share (%), by Type 2025 & 2033
- Figure 6: North America Casting Devices Industry Volume Share (%), by Type 2025 & 2033
- Figure 7: North America Casting Devices Industry Revenue (million), by End-User 2025 & 2033
- Figure 8: North America Casting Devices Industry Volume (K Unit), by End-User 2025 & 2033
- Figure 9: North America Casting Devices Industry Revenue Share (%), by End-User 2025 & 2033
- Figure 10: North America Casting Devices Industry Volume Share (%), by End-User 2025 & 2033
- Figure 11: North America Casting Devices Industry Revenue (million), by Country 2025 & 2033
- Figure 12: North America Casting Devices Industry Volume (K Unit), by Country 2025 & 2033
- Figure 13: North America Casting Devices Industry Revenue Share (%), by Country 2025 & 2033
- Figure 14: North America Casting Devices Industry Volume Share (%), by Country 2025 & 2033
- Figure 15: Europe Casting Devices Industry Revenue (million), by Type 2025 & 2033
- Figure 16: Europe Casting Devices Industry Volume (K Unit), by Type 2025 & 2033
- Figure 17: Europe Casting Devices Industry Revenue Share (%), by Type 2025 & 2033
- Figure 18: Europe Casting Devices Industry Volume Share (%), by Type 2025 & 2033
- Figure 19: Europe Casting Devices Industry Revenue (million), by End-User 2025 & 2033
- Figure 20: Europe Casting Devices Industry Volume (K Unit), by End-User 2025 & 2033
- Figure 21: Europe Casting Devices Industry Revenue Share (%), by End-User 2025 & 2033
- Figure 22: Europe Casting Devices Industry Volume Share (%), by End-User 2025 & 2033
- Figure 23: Europe Casting Devices Industry Revenue (million), by Country 2025 & 2033
- Figure 24: Europe Casting Devices Industry Volume (K Unit), by Country 2025 & 2033
- Figure 25: Europe Casting Devices Industry Revenue Share (%), by Country 2025 & 2033
- Figure 26: Europe Casting Devices Industry Volume Share (%), by Country 2025 & 2033
- Figure 27: Asia Pacific Casting Devices Industry Revenue (million), by Type 2025 & 2033
- Figure 28: Asia Pacific Casting Devices Industry Volume (K Unit), by Type 2025 & 2033
- Figure 29: Asia Pacific Casting Devices Industry Revenue Share (%), by Type 2025 & 2033
- Figure 30: Asia Pacific Casting Devices Industry Volume Share (%), by Type 2025 & 2033
- Figure 31: Asia Pacific Casting Devices Industry Revenue (million), by End-User 2025 & 2033
- Figure 32: Asia Pacific Casting Devices Industry Volume (K Unit), by End-User 2025 & 2033
- Figure 33: Asia Pacific Casting Devices Industry Revenue Share (%), by End-User 2025 & 2033
- Figure 34: Asia Pacific Casting Devices Industry Volume Share (%), by End-User 2025 & 2033
- Figure 35: Asia Pacific Casting Devices Industry Revenue (million), by Country 2025 & 2033
- Figure 36: Asia Pacific Casting Devices Industry Volume (K Unit), by Country 2025 & 2033
- Figure 37: Asia Pacific Casting Devices Industry Revenue Share (%), by Country 2025 & 2033
- Figure 38: Asia Pacific Casting Devices Industry Volume Share (%), by Country 2025 & 2033
- Figure 39: Rest of the World Casting Devices Industry Revenue (million), by Type 2025 & 2033
- Figure 40: Rest of the World Casting Devices Industry Volume (K Unit), by Type 2025 & 2033
- Figure 41: Rest of the World Casting Devices Industry Revenue Share (%), by Type 2025 & 2033
- Figure 42: Rest of the World Casting Devices Industry Volume Share (%), by Type 2025 & 2033
- Figure 43: Rest of the World Casting Devices Industry Revenue (million), by End-User 2025 & 2033
- Figure 44: Rest of the World Casting Devices Industry Volume (K Unit), by End-User 2025 & 2033
- Figure 45: Rest of the World Casting Devices Industry Revenue Share (%), by End-User 2025 & 2033
- Figure 46: Rest of the World Casting Devices Industry Volume Share (%), by End-User 2025 & 2033
- Figure 47: Rest of the World Casting Devices Industry Revenue (million), by Country 2025 & 2033
- Figure 48: Rest of the World Casting Devices Industry Volume (K Unit), by Country 2025 & 2033
- Figure 49: Rest of the World Casting Devices Industry Revenue Share (%), by Country 2025 & 2033
- Figure 50: Rest of the World Casting Devices Industry Volume Share (%), by Country 2025 & 2033
List of Tables
- Table 1: Global Casting Devices Industry Revenue million Forecast, by Type 2020 & 2033
- Table 2: Global Casting Devices Industry Volume K Unit Forecast, by Type 2020 & 2033
- Table 3: Global Casting Devices Industry Revenue million Forecast, by End-User 2020 & 2033
- Table 4: Global Casting Devices Industry Volume K Unit Forecast, by End-User 2020 & 2033
- Table 5: Global Casting Devices Industry Revenue million Forecast, by Region 2020 & 2033
- Table 6: Global Casting Devices Industry Volume K Unit Forecast, by Region 2020 & 2033
- Table 7: Global Casting Devices Industry Revenue million Forecast, by Type 2020 & 2033
- Table 8: Global Casting Devices Industry Volume K Unit Forecast, by Type 2020 & 2033
- Table 9: Global Casting Devices Industry Revenue million Forecast, by End-User 2020 & 2033
- Table 10: Global Casting Devices Industry Volume K Unit Forecast, by End-User 2020 & 2033
- Table 11: Global Casting Devices Industry Revenue million Forecast, by Country 2020 & 2033
- Table 12: Global Casting Devices Industry Volume K Unit Forecast, by Country 2020 & 2033
- Table 13: Global Casting Devices Industry Revenue million Forecast, by Type 2020 & 2033
- Table 14: Global Casting Devices Industry Volume K Unit Forecast, by Type 2020 & 2033
- Table 15: Global Casting Devices Industry Revenue million Forecast, by End-User 2020 & 2033
- Table 16: Global Casting Devices Industry Volume K Unit Forecast, by End-User 2020 & 2033
- Table 17: Global Casting Devices Industry Revenue million Forecast, by Country 2020 & 2033
- Table 18: Global Casting Devices Industry Volume K Unit Forecast, by Country 2020 & 2033
- Table 19: Global Casting Devices Industry Revenue million Forecast, by Type 2020 & 2033
- Table 20: Global Casting Devices Industry Volume K Unit Forecast, by Type 2020 & 2033
- Table 21: Global Casting Devices Industry Revenue million Forecast, by End-User 2020 & 2033
- Table 22: Global Casting Devices Industry Volume K Unit Forecast, by End-User 2020 & 2033
- Table 23: Global Casting Devices Industry Revenue million Forecast, by Country 2020 & 2033
- Table 24: Global Casting Devices Industry Volume K Unit Forecast, by Country 2020 & 2033
- Table 25: Global Casting Devices Industry Revenue million Forecast, by Type 2020 & 2033
- Table 26: Global Casting Devices Industry Volume K Unit Forecast, by Type 2020 & 2033
- Table 27: Global Casting Devices Industry Revenue million Forecast, by End-User 2020 & 2033
- Table 28: Global Casting Devices Industry Volume K Unit Forecast, by End-User 2020 & 2033
- Table 29: Global Casting Devices Industry Revenue million Forecast, by Country 2020 & 2033
- Table 30: Global Casting Devices Industry Volume K Unit Forecast, by Country 2020 & 2033
Frequently Asked Questions
1. What is the projected Compound Annual Growth Rate (CAGR) of the Casting Devices Industry?
The projected CAGR is approximately 7.56%.
2. Which companies are prominent players in the Casting Devices Industry?
Key companies in the market include LG Electronics Inc, Anycast, Hisense Co Ltd, Samsung Electronics Co Ltd, Mirascreen, Microsoft Corporation, Amazon com Inc , Airtame ApS, Roku Inc, Nvidia Corporation, Google Inc, Apple Inc, EZCast.
3. What are the main segments of the Casting Devices Industry?
The market segments include Type, End-User.
4. Can you provide details about the market size?
The market size is estimated to be USD 295.51 million as of 2022.
5. What are some drivers contributing to market growth?
; Growing Consumption of Video-on-Demand (VoD) Services; Increasing Adoption of Casting Devices with Changing Consumer Behavior.
6. What are the notable trends driving market growth?
Smart TV Segment is expected to occupy a Significant Market Share during the Forecast Period.
7. Are there any restraints impacting market growth?
; Increasing Availability of Native Smart TV Apps.
8. Can you provide examples of recent developments in the market?
N/A
9. What pricing options are available for accessing the report?
Pricing options include single-user, multi-user, and enterprise licenses priced at USD 4750, USD 5250, and USD 8750 respectively.
10. Is the market size provided in terms of value or volume?
The market size is provided in terms of value, measured in million and volume, measured in K Unit.
11. Are there any specific market keywords associated with the report?
Yes, the market keyword associated with the report is "Casting Devices Industry," which aids in identifying and referencing the specific market segment covered.
12. How do I determine which pricing option suits my needs best?
The pricing options vary based on user requirements and access needs. Individual users may opt for single-user licenses, while businesses requiring broader access may choose multi-user or enterprise licenses for cost-effective access to the report.
13. Are there any additional resources or data provided in the Casting Devices Industry report?
While the report offers comprehensive insights, it's advisable to review the specific contents or supplementary materials provided to ascertain if additional resources or data are available.
14. How can I stay updated on further developments or reports in the Casting Devices Industry?
To stay informed about further developments, trends, and reports in the Casting Devices Industry, consider subscribing to industry newsletters, following relevant companies and organizations, or regularly checking reputable industry news sources and publications.
Methodology
Step 1 - Identification of Relevant Samples Size from Population Database


Step 2 - Approaches for Defining Global Market Size (Value, Volume* & Price*)

Note*: In applicable scenarios
Step 3 - Data Sources
Primary Research
- Web Analytics
- Survey Reports
- Research Institute
- Latest Research Reports
- Opinion Leaders
Secondary Research
- Annual Reports
- White Paper
- Latest Press Release
- Industry Association
- Paid Database
- Investor Presentations

Step 4 - Data Triangulation
Involves using different sources of information in order to increase the validity of a study
These sources are likely to be stakeholders in a program - participants, other researchers, program staff, other community members, and so on.
Then we put all data in single framework & apply various statistical tools to find out the dynamic on the market.
During the analysis stage, feedback from the stakeholder groups would be compared to determine areas of agreement as well as areas of divergence