
Key Insights
The global wind power gearbox market is experiencing robust growth, projected to reach a substantial size driven by the increasing demand for renewable energy sources and the expansion of wind power capacity worldwide. The market's Compound Annual Growth Rate (CAGR) of 8.70% from 2019 to 2024 indicates a significant upward trajectory. This growth is fueled by several factors, including government incentives promoting renewable energy adoption, technological advancements leading to more efficient and reliable gearboxes, and the rising need for energy security and diversification. The market is segmented by location of deployment, with onshore and offshore segments contributing significantly. Onshore deployments currently dominate, but offshore wind energy is rapidly gaining traction, presenting a substantial growth opportunity due to higher wind speeds and increased capacity potential. Key players like Dana Brevini SpA, Siemens Gamesa Renewable Energy SA, and ZF Friedrichshafen AG are driving innovation and competition, constantly developing advanced gearbox designs to improve efficiency, durability, and maintainability. Regional variations exist, with North America, Europe, and Asia Pacific representing major market segments. Continued investment in wind energy infrastructure and the ongoing shift towards cleaner energy sources are expected to further propel the market's growth throughout the forecast period (2025-2033).
The market's restraints primarily involve the high initial investment costs associated with wind power projects, including gearbox procurement and installation. However, decreasing manufacturing costs and technological improvements are steadily mitigating this challenge. Furthermore, the need for specialized maintenance and repair services for these complex components presents a secondary constraint. Despite these limitations, the long-term outlook for the wind power gearbox market remains overwhelmingly positive. The continued global focus on reducing carbon emissions and the increasing adoption of renewable energy will ensure sustained demand for advanced and reliable gearboxes within the wind energy sector. The market is expected to witness consolidation amongst key players, along with strategic partnerships and mergers and acquisitions. This consolidation will contribute to increased efficiency and technological innovation, pushing the limits of gearbox performance and reliability.
Wind Power Gearbox Market: A Comprehensive Market Report (2019-2033)
This comprehensive report provides an in-depth analysis of the global Wind Power Gearbox Market, encompassing market dynamics, growth trends, regional analysis, product landscape, and key players. The report covers the period from 2019 to 2033, with a focus on the forecast period 2025-2033 and a base year of 2025. This report is a must-have for industry professionals, investors, and anyone seeking to understand this rapidly evolving market within the broader renewable energy sector. The parent market is the Renewable Energy sector and the child market is Wind Turbine Components. The total market size is predicted to be xx Million units by 2033.
Wind Power Gearbox Market Dynamics & Structure
The Wind Power Gearbox market is characterized by a moderately concentrated structure, with several major players holding significant market share. Technological innovation is a key driver, with continuous advancements in gearbox design leading to improved efficiency, reliability, and durability. Stringent regulatory frameworks focused on renewable energy integration and emission reduction policies are also pivotal in shaping market growth. Competitive product substitutes, primarily direct-drive technology, pose a challenge, but the cost-effectiveness and established technology of geared wind turbines ensure continued market relevance. End-user demographics are primarily large-scale wind farm developers and independent power producers (IPPs). M&A activity within the sector has been relatively moderate in recent years, with xx deals recorded between 2019 and 2024, representing a xx% increase compared to the previous period.
- Market Concentration: Moderately concentrated, with top 5 players holding approximately xx% market share in 2024.
- Technological Innovation: Focus on increasing efficiency (reducing weight and losses), enhancing reliability, and extending lifespan.
- Regulatory Framework: Government subsidies and renewable energy mandates are crucial growth drivers.
- Competitive Substitutes: Direct-drive wind turbines pose a challenge, but geared systems retain cost advantages.
- M&A Activity: xx deals between 2019-2024, indicating moderate consolidation.
- Innovation Barriers: High R&D costs and stringent testing requirements.
Wind Power Gearbox Market Growth Trends & Insights
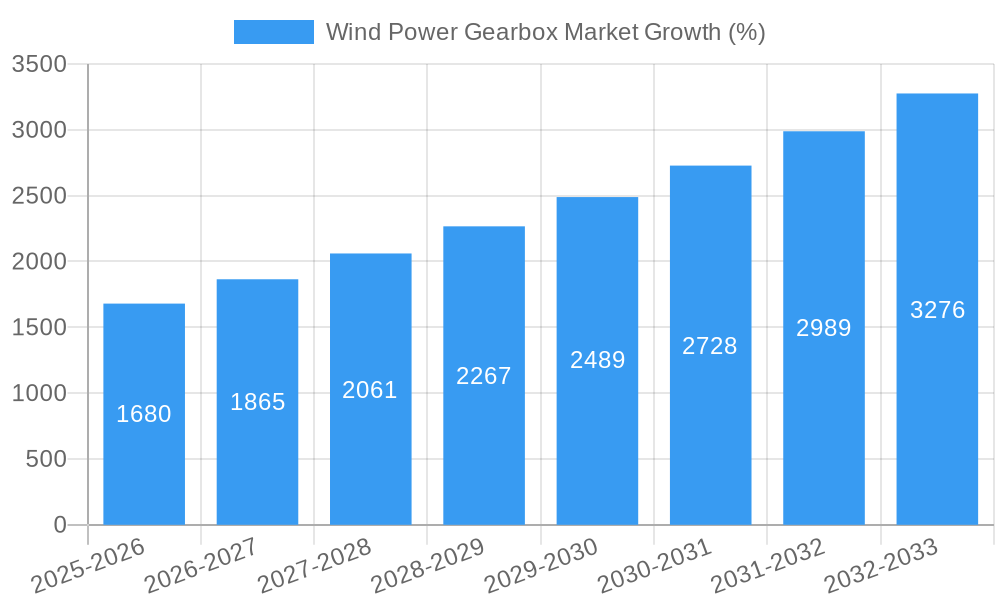
The Wind Power Gearbox market exhibits substantial growth potential, driven by the burgeoning global demand for renewable energy. The market size expanded from xx Million units in 2019 to xx Million units in 2024, indicating a CAGR of xx%. This growth is projected to continue, reaching xx Million units by 2033, with a projected CAGR of xx% during the forecast period. Technological disruptions, such as advancements in bearing technology and improved lubrication systems, are further enhancing gearbox performance and lifespan. Shifting consumer behavior towards sustainable energy solutions and increasing government support for renewable energy projects are key contributors to market expansion. Market penetration within the overall wind energy sector is expected to remain robust, driven by continuous growth in the installation of both onshore and offshore wind farms.
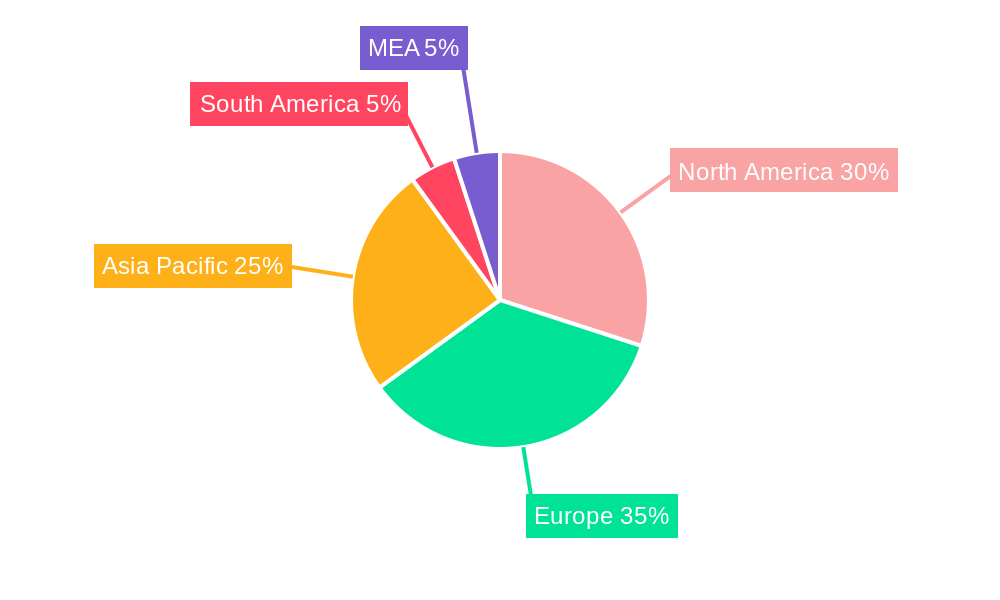
Dominant Regions, Countries, or Segments in Wind Power Gearbox Market
The wind power gearbox market is significantly driven by the growth in onshore deployments, particularly in regions with extensive land availability and supportive governmental policies such as China, India and the US. This segment is expected to account for approximately xx% of the total market value by 2033. The offshore segment exhibits a higher growth potential owing to the enormous capacity of offshore wind farms, albeit with higher initial investment and operational costs. Key regions driving market expansion include:
- Asia Pacific: Rapid growth in wind energy capacity, particularly in China and India.
- Europe: Strong regulatory support for renewable energy and significant offshore wind development.
- North America: Increasing investments in onshore wind capacity and expanding offshore projects.
Key Drivers for Onshore Dominance:
- Lower installation costs compared to offshore projects.
- Easier access and maintenance.
- Abundant land availability in several regions.
- Supportive government policies and incentives.
Key Drivers for Offshore Growth Potential:
- High wind resource potential at sea.
- Increasing government investments in offshore wind farms.
- Technological advances reducing installation and maintenance challenges.
Wind Power Gearbox Market Product Landscape
The wind power gearbox market features a range of products tailored to specific wind turbine designs and capacities. Innovations focus on enhanced efficiency, reliability, and reduced weight. Modern gearboxes incorporate advanced materials, optimized designs, and improved lubrication systems. Key performance metrics include efficiency, noise levels, and lifespan. Unique selling propositions often revolve around customized solutions, advanced monitoring systems, and long-term service agreements. The market is seeing the emergence of gearboxes designed for higher capacity turbines, reflecting the trend towards larger wind turbines.
Key Drivers, Barriers & Challenges in Wind Power Gearbox Market
Key Drivers:
- Growing demand for renewable energy globally.
- Government incentives and supportive policies.
- Technological advancements enhancing gearbox performance.
- Increasing wind farm capacity and size.
Challenges & Restraints:
- High initial investment costs associated with wind power projects.
- Potential supply chain disruptions impacting component availability and prices.
- Stringent regulatory requirements and environmental concerns.
- Competition from direct-drive technology. The market share for Direct Drive Wind Turbines is currently at xx% and is projected to be at xx% by 2033.
Emerging Opportunities in Wind Power Gearbox Market
- Expanding offshore wind energy market represents a significant opportunity.
- Growing demand for higher-capacity gearboxes for larger wind turbines.
- Development of advanced materials and designs to enhance efficiency and reduce weight.
- Integration of smart technologies and digital monitoring systems for improved maintenance and optimization.
Growth Accelerators in the Wind Power Gearbox Market Industry
Technological breakthroughs, particularly in materials science and lubrication technology, are key growth catalysts. Strategic partnerships between gearbox manufacturers and wind turbine OEMs facilitate innovation and market access. Expansion into emerging markets and proactive engagement with evolving government regulations also contribute to sustained market growth.
Key Players Shaping the Wind Power Gearbox Market Market
- Dana Brevini SpA
- Siemens Gamesa Renewable Energy SA
- ME Production AS
- Stork Gears & Services BV
- Winergy Group
- Turbine Repair Solutions
- Elecon Engineering Company Limited
- ZF Friedrichshafen AG
Notable Milestones in Wind Power Gearbox Market Sector
- September 2023: Sany Renewable Energy unveils its 919 wind turbine platform, featuring modular gearboxes for 8.5-11 MW turbines. This signifies a push towards higher-capacity turbines and modular design.
- June 2022: Eickhoff Wind Asia opens a state-of-the-art gearbox assembly facility in Chennai, expanding manufacturing capabilities in Asia. This enhances their position in a key growth market.
- March 2022: SKF introduces advancements in rolling bearing technology, leading to lighter drivetrains and cost savings for larger onshore turbines. This innovation directly addresses a key challenge in scaling up onshore wind turbine sizes.
In-Depth Wind Power Gearbox Market Market Outlook
The Wind Power Gearbox Market is poised for sustained growth, driven by the ongoing global transition to renewable energy. Future market potential is significant, particularly in the offshore wind sector. Strategic opportunities exist for manufacturers who can innovate in areas such as material science, lubrication, and digitalization. Partnerships and collaborations across the wind energy value chain will be crucial for capturing market share in this dynamic and evolving industry.
Wind Power Gearbox Market Segmentation
-
1. Location of Deployment
- 1.1. Onshore
- 1.2. Offshore
Wind Power Gearbox Market Segmentation By Geography
-
1. North America
- 1.1. United States
- 1.2. Canada
- 1.3. Rest of North America
-
2. Asia Pacific
- 2.1. China
- 2.2. India
- 2.3. Japan
- 2.4. Asutralia
- 2.5. Rest of Asia Pacific
-
3. Europe
- 3.1. United Kingdom
- 3.2. Germany
- 3.3. France
- 3.4. Spain
- 3.5. Rest of Europe
-
4. South America
- 4.1. Brazil
- 4.2. Argentina
- 4.3. Chile
- 4.4. Rest of South America
-
5. Middle East and Africa
- 5.1. Saudi Arabia
- 5.2. United Arab Emirates
- 5.3. South Africa
- 5.4. Rest of Middle East
Wind Power Gearbox Market REPORT HIGHLIGHTS
| Aspects | Details |
|---|---|
| Study Period | 2019-2033 |
| Base Year | 2024 |
| Estimated Year | 2025 |
| Forecast Period | 2025-2033 |
| Historical Period | 2019-2024 |
| Growth Rate | CAGR of 8.70% from 2019-2033 |
| Segmentation |
|
Table of Contents
- 1. Introduction
- 1.1. Research Scope
- 1.2. Market Segmentation
- 1.3. Research Methodology
- 1.4. Definitions and Assumptions
- 2. Executive Summary
- 2.1. Introduction
- 3. Market Dynamics
- 3.1. Introduction
- 3.2. Market Drivers
- 3.2.1. Increasing Adoption of Wind Energy4.; Growing Investments in Wind Energy
- 3.3. Market Restrains
- 3.3.1. Increasing Penetration of Other Sources of Renewable Energy
- 3.4. Market Trends
- 3.4.1. Offshore Segment to Register Higher Growth
- 4. Market Factor Analysis
- 4.1. Porters Five Forces
- 4.2. Supply/Value Chain
- 4.3. PESTEL analysis
- 4.4. Market Entropy
- 4.5. Patent/Trademark Analysis
- 5. Global Wind Power Gearbox Market Analysis, Insights and Forecast, 2019-2031
- 5.1. Market Analysis, Insights and Forecast - by Location of Deployment
- 5.1.1. Onshore
- 5.1.2. Offshore
- 5.2. Market Analysis, Insights and Forecast - by Region
- 5.2.1. North America
- 5.2.2. Asia Pacific
- 5.2.3. Europe
- 5.2.4. South America
- 5.2.5. Middle East and Africa
- 5.1. Market Analysis, Insights and Forecast - by Location of Deployment
- 6. North America Wind Power Gearbox Market Analysis, Insights and Forecast, 2019-2031
- 6.1. Market Analysis, Insights and Forecast - by Location of Deployment
- 6.1.1. Onshore
- 6.1.2. Offshore
- 6.1. Market Analysis, Insights and Forecast - by Location of Deployment
- 7. Asia Pacific Wind Power Gearbox Market Analysis, Insights and Forecast, 2019-2031
- 7.1. Market Analysis, Insights and Forecast - by Location of Deployment
- 7.1.1. Onshore
- 7.1.2. Offshore
- 7.1. Market Analysis, Insights and Forecast - by Location of Deployment
- 8. Europe Wind Power Gearbox Market Analysis, Insights and Forecast, 2019-2031
- 8.1. Market Analysis, Insights and Forecast - by Location of Deployment
- 8.1.1. Onshore
- 8.1.2. Offshore
- 8.1. Market Analysis, Insights and Forecast - by Location of Deployment
- 9. South America Wind Power Gearbox Market Analysis, Insights and Forecast, 2019-2031
- 9.1. Market Analysis, Insights and Forecast - by Location of Deployment
- 9.1.1. Onshore
- 9.1.2. Offshore
- 9.1. Market Analysis, Insights and Forecast - by Location of Deployment
- 10. Middle East and Africa Wind Power Gearbox Market Analysis, Insights and Forecast, 2019-2031
- 10.1. Market Analysis, Insights and Forecast - by Location of Deployment
- 10.1.1. Onshore
- 10.1.2. Offshore
- 10.1. Market Analysis, Insights and Forecast - by Location of Deployment
- 11. North America Wind Power Gearbox Market Analysis, Insights and Forecast, 2019-2031
- 11.1. Market Analysis, Insights and Forecast - By Country/Sub-region
- 11.1.1 United States
- 11.1.2 Canada
- 11.1.3 Mexico
- 12. Europe Wind Power Gearbox Market Analysis, Insights and Forecast, 2019-2031
- 12.1. Market Analysis, Insights and Forecast - By Country/Sub-region
- 12.1.1 Germany
- 12.1.2 United Kingdom
- 12.1.3 France
- 12.1.4 Spain
- 12.1.5 Italy
- 12.1.6 Spain
- 12.1.7 Belgium
- 12.1.8 Netherland
- 12.1.9 Nordics
- 12.1.10 Rest of Europe
- 13. Asia Pacific Wind Power Gearbox Market Analysis, Insights and Forecast, 2019-2031
- 13.1. Market Analysis, Insights and Forecast - By Country/Sub-region
- 13.1.1 China
- 13.1.2 Japan
- 13.1.3 India
- 13.1.4 South Korea
- 13.1.5 Southeast Asia
- 13.1.6 Australia
- 13.1.7 Indonesia
- 13.1.8 Phillipes
- 13.1.9 Singapore
- 13.1.10 Thailandc
- 13.1.11 Rest of Asia Pacific
- 14. South America Wind Power Gearbox Market Analysis, Insights and Forecast, 2019-2031
- 14.1. Market Analysis, Insights and Forecast - By Country/Sub-region
- 14.1.1 Brazil
- 14.1.2 Argentina
- 14.1.3 Peru
- 14.1.4 Chile
- 14.1.5 Colombia
- 14.1.6 Ecuador
- 14.1.7 Venezuela
- 14.1.8 Rest of South America
- 15. North America Wind Power Gearbox Market Analysis, Insights and Forecast, 2019-2031
- 15.1. Market Analysis, Insights and Forecast - By Country/Sub-region
- 15.1.1 United States
- 15.1.2 Canada
- 15.1.3 Mexico
- 16. MEA Wind Power Gearbox Market Analysis, Insights and Forecast, 2019-2031
- 16.1. Market Analysis, Insights and Forecast - By Country/Sub-region
- 16.1.1 United Arab Emirates
- 16.1.2 Saudi Arabia
- 16.1.3 South Africa
- 16.1.4 Rest of Middle East and Africa
- 17. Competitive Analysis
- 17.1. Global Market Share Analysis 2024
- 17.2. Company Profiles
- 17.2.1 Dana Brevini SpA
- 17.2.1.1. Overview
- 17.2.1.2. Products
- 17.2.1.3. SWOT Analysis
- 17.2.1.4. Recent Developments
- 17.2.1.5. Financials (Based on Availability)
- 17.2.2 Siemens Gamesa Renewable Energy SA
- 17.2.2.1. Overview
- 17.2.2.2. Products
- 17.2.2.3. SWOT Analysis
- 17.2.2.4. Recent Developments
- 17.2.2.5. Financials (Based on Availability)
- 17.2.3 ME Production AS
- 17.2.3.1. Overview
- 17.2.3.2. Products
- 17.2.3.3. SWOT Analysis
- 17.2.3.4. Recent Developments
- 17.2.3.5. Financials (Based on Availability)
- 17.2.4 Stork Gears & Services BV
- 17.2.4.1. Overview
- 17.2.4.2. Products
- 17.2.4.3. SWOT Analysis
- 17.2.4.4. Recent Developments
- 17.2.4.5. Financials (Based on Availability)
- 17.2.5 Winergy Group
- 17.2.5.1. Overview
- 17.2.5.2. Products
- 17.2.5.3. SWOT Analysis
- 17.2.5.4. Recent Developments
- 17.2.5.5. Financials (Based on Availability)
- 17.2.6 Turbine Repair Solutions
- 17.2.6.1. Overview
- 17.2.6.2. Products
- 17.2.6.3. SWOT Analysis
- 17.2.6.4. Recent Developments
- 17.2.6.5. Financials (Based on Availability)
- 17.2.7 Elecon Engineering Company Limited*List Not Exhaustive
- 17.2.7.1. Overview
- 17.2.7.2. Products
- 17.2.7.3. SWOT Analysis
- 17.2.7.4. Recent Developments
- 17.2.7.5. Financials (Based on Availability)
- 17.2.8 ZF Friedrichshafen AG
- 17.2.8.1. Overview
- 17.2.8.2. Products
- 17.2.8.3. SWOT Analysis
- 17.2.8.4. Recent Developments
- 17.2.8.5. Financials (Based on Availability)
- 17.2.1 Dana Brevini SpA
List of Figures
- Figure 1: Global Wind Power Gearbox Market Revenue Breakdown (Million, %) by Region 2024 & 2032
- Figure 2: Global Wind Power Gearbox Market Volume Breakdown (K Unit, %) by Region 2024 & 2032
- Figure 3: North America Wind Power Gearbox Market Revenue (Million), by Country 2024 & 2032
- Figure 4: North America Wind Power Gearbox Market Volume (K Unit), by Country 2024 & 2032
- Figure 5: North America Wind Power Gearbox Market Revenue Share (%), by Country 2024 & 2032
- Figure 6: North America Wind Power Gearbox Market Volume Share (%), by Country 2024 & 2032
- Figure 7: Europe Wind Power Gearbox Market Revenue (Million), by Country 2024 & 2032
- Figure 8: Europe Wind Power Gearbox Market Volume (K Unit), by Country 2024 & 2032
- Figure 9: Europe Wind Power Gearbox Market Revenue Share (%), by Country 2024 & 2032
- Figure 10: Europe Wind Power Gearbox Market Volume Share (%), by Country 2024 & 2032
- Figure 11: Asia Pacific Wind Power Gearbox Market Revenue (Million), by Country 2024 & 2032
- Figure 12: Asia Pacific Wind Power Gearbox Market Volume (K Unit), by Country 2024 & 2032
- Figure 13: Asia Pacific Wind Power Gearbox Market Revenue Share (%), by Country 2024 & 2032
- Figure 14: Asia Pacific Wind Power Gearbox Market Volume Share (%), by Country 2024 & 2032
- Figure 15: South America Wind Power Gearbox Market Revenue (Million), by Country 2024 & 2032
- Figure 16: South America Wind Power Gearbox Market Volume (K Unit), by Country 2024 & 2032
- Figure 17: South America Wind Power Gearbox Market Revenue Share (%), by Country 2024 & 2032
- Figure 18: South America Wind Power Gearbox Market Volume Share (%), by Country 2024 & 2032
- Figure 19: North America Wind Power Gearbox Market Revenue (Million), by Country 2024 & 2032
- Figure 20: North America Wind Power Gearbox Market Volume (K Unit), by Country 2024 & 2032
- Figure 21: North America Wind Power Gearbox Market Revenue Share (%), by Country 2024 & 2032
- Figure 22: North America Wind Power Gearbox Market Volume Share (%), by Country 2024 & 2032
- Figure 23: MEA Wind Power Gearbox Market Revenue (Million), by Country 2024 & 2032
- Figure 24: MEA Wind Power Gearbox Market Volume (K Unit), by Country 2024 & 2032
- Figure 25: MEA Wind Power Gearbox Market Revenue Share (%), by Country 2024 & 2032
- Figure 26: MEA Wind Power Gearbox Market Volume Share (%), by Country 2024 & 2032
- Figure 27: North America Wind Power Gearbox Market Revenue (Million), by Location of Deployment 2024 & 2032
- Figure 28: North America Wind Power Gearbox Market Volume (K Unit), by Location of Deployment 2024 & 2032
- Figure 29: North America Wind Power Gearbox Market Revenue Share (%), by Location of Deployment 2024 & 2032
- Figure 30: North America Wind Power Gearbox Market Volume Share (%), by Location of Deployment 2024 & 2032
- Figure 31: North America Wind Power Gearbox Market Revenue (Million), by Country 2024 & 2032
- Figure 32: North America Wind Power Gearbox Market Volume (K Unit), by Country 2024 & 2032
- Figure 33: North America Wind Power Gearbox Market Revenue Share (%), by Country 2024 & 2032
- Figure 34: North America Wind Power Gearbox Market Volume Share (%), by Country 2024 & 2032
- Figure 35: Asia Pacific Wind Power Gearbox Market Revenue (Million), by Location of Deployment 2024 & 2032
- Figure 36: Asia Pacific Wind Power Gearbox Market Volume (K Unit), by Location of Deployment 2024 & 2032
- Figure 37: Asia Pacific Wind Power Gearbox Market Revenue Share (%), by Location of Deployment 2024 & 2032
- Figure 38: Asia Pacific Wind Power Gearbox Market Volume Share (%), by Location of Deployment 2024 & 2032
- Figure 39: Asia Pacific Wind Power Gearbox Market Revenue (Million), by Country 2024 & 2032
- Figure 40: Asia Pacific Wind Power Gearbox Market Volume (K Unit), by Country 2024 & 2032
- Figure 41: Asia Pacific Wind Power Gearbox Market Revenue Share (%), by Country 2024 & 2032
- Figure 42: Asia Pacific Wind Power Gearbox Market Volume Share (%), by Country 2024 & 2032
- Figure 43: Europe Wind Power Gearbox Market Revenue (Million), by Location of Deployment 2024 & 2032
- Figure 44: Europe Wind Power Gearbox Market Volume (K Unit), by Location of Deployment 2024 & 2032
- Figure 45: Europe Wind Power Gearbox Market Revenue Share (%), by Location of Deployment 2024 & 2032
- Figure 46: Europe Wind Power Gearbox Market Volume Share (%), by Location of Deployment 2024 & 2032
- Figure 47: Europe Wind Power Gearbox Market Revenue (Million), by Country 2024 & 2032
- Figure 48: Europe Wind Power Gearbox Market Volume (K Unit), by Country 2024 & 2032
- Figure 49: Europe Wind Power Gearbox Market Revenue Share (%), by Country 2024 & 2032
- Figure 50: Europe Wind Power Gearbox Market Volume Share (%), by Country 2024 & 2032
- Figure 51: South America Wind Power Gearbox Market Revenue (Million), by Location of Deployment 2024 & 2032
- Figure 52: South America Wind Power Gearbox Market Volume (K Unit), by Location of Deployment 2024 & 2032
- Figure 53: South America Wind Power Gearbox Market Revenue Share (%), by Location of Deployment 2024 & 2032
- Figure 54: South America Wind Power Gearbox Market Volume Share (%), by Location of Deployment 2024 & 2032
- Figure 55: South America Wind Power Gearbox Market Revenue (Million), by Country 2024 & 2032
- Figure 56: South America Wind Power Gearbox Market Volume (K Unit), by Country 2024 & 2032
- Figure 57: South America Wind Power Gearbox Market Revenue Share (%), by Country 2024 & 2032
- Figure 58: South America Wind Power Gearbox Market Volume Share (%), by Country 2024 & 2032
- Figure 59: Middle East and Africa Wind Power Gearbox Market Revenue (Million), by Location of Deployment 2024 & 2032
- Figure 60: Middle East and Africa Wind Power Gearbox Market Volume (K Unit), by Location of Deployment 2024 & 2032
- Figure 61: Middle East and Africa Wind Power Gearbox Market Revenue Share (%), by Location of Deployment 2024 & 2032
- Figure 62: Middle East and Africa Wind Power Gearbox Market Volume Share (%), by Location of Deployment 2024 & 2032
- Figure 63: Middle East and Africa Wind Power Gearbox Market Revenue (Million), by Country 2024 & 2032
- Figure 64: Middle East and Africa Wind Power Gearbox Market Volume (K Unit), by Country 2024 & 2032
- Figure 65: Middle East and Africa Wind Power Gearbox Market Revenue Share (%), by Country 2024 & 2032
- Figure 66: Middle East and Africa Wind Power Gearbox Market Volume Share (%), by Country 2024 & 2032
List of Tables
- Table 1: Global Wind Power Gearbox Market Revenue Million Forecast, by Region 2019 & 2032
- Table 2: Global Wind Power Gearbox Market Volume K Unit Forecast, by Region 2019 & 2032
- Table 3: Global Wind Power Gearbox Market Revenue Million Forecast, by Location of Deployment 2019 & 2032
- Table 4: Global Wind Power Gearbox Market Volume K Unit Forecast, by Location of Deployment 2019 & 2032
- Table 5: Global Wind Power Gearbox Market Revenue Million Forecast, by Region 2019 & 2032
- Table 6: Global Wind Power Gearbox Market Volume K Unit Forecast, by Region 2019 & 2032
- Table 7: Global Wind Power Gearbox Market Revenue Million Forecast, by Country 2019 & 2032
- Table 8: Global Wind Power Gearbox Market Volume K Unit Forecast, by Country 2019 & 2032
- Table 9: United States Wind Power Gearbox Market Revenue (Million) Forecast, by Application 2019 & 2032
- Table 10: United States Wind Power Gearbox Market Volume (K Unit) Forecast, by Application 2019 & 2032
- Table 11: Canada Wind Power Gearbox Market Revenue (Million) Forecast, by Application 2019 & 2032
- Table 12: Canada Wind Power Gearbox Market Volume (K Unit) Forecast, by Application 2019 & 2032
- Table 13: Mexico Wind Power Gearbox Market Revenue (Million) Forecast, by Application 2019 & 2032
- Table 14: Mexico Wind Power Gearbox Market Volume (K Unit) Forecast, by Application 2019 & 2032
- Table 15: Global Wind Power Gearbox Market Revenue Million Forecast, by Country 2019 & 2032
- Table 16: Global Wind Power Gearbox Market Volume K Unit Forecast, by Country 2019 & 2032
- Table 17: Germany Wind Power Gearbox Market Revenue (Million) Forecast, by Application 2019 & 2032
- Table 18: Germany Wind Power Gearbox Market Volume (K Unit) Forecast, by Application 2019 & 2032
- Table 19: United Kingdom Wind Power Gearbox Market Revenue (Million) Forecast, by Application 2019 & 2032
- Table 20: United Kingdom Wind Power Gearbox Market Volume (K Unit) Forecast, by Application 2019 & 2032
- Table 21: France Wind Power Gearbox Market Revenue (Million) Forecast, by Application 2019 & 2032
- Table 22: France Wind Power Gearbox Market Volume (K Unit) Forecast, by Application 2019 & 2032
- Table 23: Spain Wind Power Gearbox Market Revenue (Million) Forecast, by Application 2019 & 2032
- Table 24: Spain Wind Power Gearbox Market Volume (K Unit) Forecast, by Application 2019 & 2032
- Table 25: Italy Wind Power Gearbox Market Revenue (Million) Forecast, by Application 2019 & 2032
- Table 26: Italy Wind Power Gearbox Market Volume (K Unit) Forecast, by Application 2019 & 2032
- Table 27: Spain Wind Power Gearbox Market Revenue (Million) Forecast, by Application 2019 & 2032
- Table 28: Spain Wind Power Gearbox Market Volume (K Unit) Forecast, by Application 2019 & 2032
- Table 29: Belgium Wind Power Gearbox Market Revenue (Million) Forecast, by Application 2019 & 2032
- Table 30: Belgium Wind Power Gearbox Market Volume (K Unit) Forecast, by Application 2019 & 2032
- Table 31: Netherland Wind Power Gearbox Market Revenue (Million) Forecast, by Application 2019 & 2032
- Table 32: Netherland Wind Power Gearbox Market Volume (K Unit) Forecast, by Application 2019 & 2032
- Table 33: Nordics Wind Power Gearbox Market Revenue (Million) Forecast, by Application 2019 & 2032
- Table 34: Nordics Wind Power Gearbox Market Volume (K Unit) Forecast, by Application 2019 & 2032
- Table 35: Rest of Europe Wind Power Gearbox Market Revenue (Million) Forecast, by Application 2019 & 2032
- Table 36: Rest of Europe Wind Power Gearbox Market Volume (K Unit) Forecast, by Application 2019 & 2032
- Table 37: Global Wind Power Gearbox Market Revenue Million Forecast, by Country 2019 & 2032
- Table 38: Global Wind Power Gearbox Market Volume K Unit Forecast, by Country 2019 & 2032
- Table 39: China Wind Power Gearbox Market Revenue (Million) Forecast, by Application 2019 & 2032
- Table 40: China Wind Power Gearbox Market Volume (K Unit) Forecast, by Application 2019 & 2032
- Table 41: Japan Wind Power Gearbox Market Revenue (Million) Forecast, by Application 2019 & 2032
- Table 42: Japan Wind Power Gearbox Market Volume (K Unit) Forecast, by Application 2019 & 2032
- Table 43: India Wind Power Gearbox Market Revenue (Million) Forecast, by Application 2019 & 2032
- Table 44: India Wind Power Gearbox Market Volume (K Unit) Forecast, by Application 2019 & 2032
- Table 45: South Korea Wind Power Gearbox Market Revenue (Million) Forecast, by Application 2019 & 2032
- Table 46: South Korea Wind Power Gearbox Market Volume (K Unit) Forecast, by Application 2019 & 2032
- Table 47: Southeast Asia Wind Power Gearbox Market Revenue (Million) Forecast, by Application 2019 & 2032
- Table 48: Southeast Asia Wind Power Gearbox Market Volume (K Unit) Forecast, by Application 2019 & 2032
- Table 49: Australia Wind Power Gearbox Market Revenue (Million) Forecast, by Application 2019 & 2032
- Table 50: Australia Wind Power Gearbox Market Volume (K Unit) Forecast, by Application 2019 & 2032
- Table 51: Indonesia Wind Power Gearbox Market Revenue (Million) Forecast, by Application 2019 & 2032
- Table 52: Indonesia Wind Power Gearbox Market Volume (K Unit) Forecast, by Application 2019 & 2032
- Table 53: Phillipes Wind Power Gearbox Market Revenue (Million) Forecast, by Application 2019 & 2032
- Table 54: Phillipes Wind Power Gearbox Market Volume (K Unit) Forecast, by Application 2019 & 2032
- Table 55: Singapore Wind Power Gearbox Market Revenue (Million) Forecast, by Application 2019 & 2032
- Table 56: Singapore Wind Power Gearbox Market Volume (K Unit) Forecast, by Application 2019 & 2032
- Table 57: Thailandc Wind Power Gearbox Market Revenue (Million) Forecast, by Application 2019 & 2032
- Table 58: Thailandc Wind Power Gearbox Market Volume (K Unit) Forecast, by Application 2019 & 2032
- Table 59: Rest of Asia Pacific Wind Power Gearbox Market Revenue (Million) Forecast, by Application 2019 & 2032
- Table 60: Rest of Asia Pacific Wind Power Gearbox Market Volume (K Unit) Forecast, by Application 2019 & 2032
- Table 61: Global Wind Power Gearbox Market Revenue Million Forecast, by Country 2019 & 2032
- Table 62: Global Wind Power Gearbox Market Volume K Unit Forecast, by Country 2019 & 2032
- Table 63: Brazil Wind Power Gearbox Market Revenue (Million) Forecast, by Application 2019 & 2032
- Table 64: Brazil Wind Power Gearbox Market Volume (K Unit) Forecast, by Application 2019 & 2032
- Table 65: Argentina Wind Power Gearbox Market Revenue (Million) Forecast, by Application 2019 & 2032
- Table 66: Argentina Wind Power Gearbox Market Volume (K Unit) Forecast, by Application 2019 & 2032
- Table 67: Peru Wind Power Gearbox Market Revenue (Million) Forecast, by Application 2019 & 2032
- Table 68: Peru Wind Power Gearbox Market Volume (K Unit) Forecast, by Application 2019 & 2032
- Table 69: Chile Wind Power Gearbox Market Revenue (Million) Forecast, by Application 2019 & 2032
- Table 70: Chile Wind Power Gearbox Market Volume (K Unit) Forecast, by Application 2019 & 2032
- Table 71: Colombia Wind Power Gearbox Market Revenue (Million) Forecast, by Application 2019 & 2032
- Table 72: Colombia Wind Power Gearbox Market Volume (K Unit) Forecast, by Application 2019 & 2032
- Table 73: Ecuador Wind Power Gearbox Market Revenue (Million) Forecast, by Application 2019 & 2032
- Table 74: Ecuador Wind Power Gearbox Market Volume (K Unit) Forecast, by Application 2019 & 2032
- Table 75: Venezuela Wind Power Gearbox Market Revenue (Million) Forecast, by Application 2019 & 2032
- Table 76: Venezuela Wind Power Gearbox Market Volume (K Unit) Forecast, by Application 2019 & 2032
- Table 77: Rest of South America Wind Power Gearbox Market Revenue (Million) Forecast, by Application 2019 & 2032
- Table 78: Rest of South America Wind Power Gearbox Market Volume (K Unit) Forecast, by Application 2019 & 2032
- Table 79: Global Wind Power Gearbox Market Revenue Million Forecast, by Country 2019 & 2032
- Table 80: Global Wind Power Gearbox Market Volume K Unit Forecast, by Country 2019 & 2032
- Table 81: United States Wind Power Gearbox Market Revenue (Million) Forecast, by Application 2019 & 2032
- Table 82: United States Wind Power Gearbox Market Volume (K Unit) Forecast, by Application 2019 & 2032
- Table 83: Canada Wind Power Gearbox Market Revenue (Million) Forecast, by Application 2019 & 2032
- Table 84: Canada Wind Power Gearbox Market Volume (K Unit) Forecast, by Application 2019 & 2032
- Table 85: Mexico Wind Power Gearbox Market Revenue (Million) Forecast, by Application 2019 & 2032
- Table 86: Mexico Wind Power Gearbox Market Volume (K Unit) Forecast, by Application 2019 & 2032
- Table 87: Global Wind Power Gearbox Market Revenue Million Forecast, by Country 2019 & 2032
- Table 88: Global Wind Power Gearbox Market Volume K Unit Forecast, by Country 2019 & 2032
- Table 89: United Arab Emirates Wind Power Gearbox Market Revenue (Million) Forecast, by Application 2019 & 2032
- Table 90: United Arab Emirates Wind Power Gearbox Market Volume (K Unit) Forecast, by Application 2019 & 2032
- Table 91: Saudi Arabia Wind Power Gearbox Market Revenue (Million) Forecast, by Application 2019 & 2032
- Table 92: Saudi Arabia Wind Power Gearbox Market Volume (K Unit) Forecast, by Application 2019 & 2032
- Table 93: South Africa Wind Power Gearbox Market Revenue (Million) Forecast, by Application 2019 & 2032
- Table 94: South Africa Wind Power Gearbox Market Volume (K Unit) Forecast, by Application 2019 & 2032
- Table 95: Rest of Middle East and Africa Wind Power Gearbox Market Revenue (Million) Forecast, by Application 2019 & 2032
- Table 96: Rest of Middle East and Africa Wind Power Gearbox Market Volume (K Unit) Forecast, by Application 2019 & 2032
- Table 97: Global Wind Power Gearbox Market Revenue Million Forecast, by Location of Deployment 2019 & 2032
- Table 98: Global Wind Power Gearbox Market Volume K Unit Forecast, by Location of Deployment 2019 & 2032
- Table 99: Global Wind Power Gearbox Market Revenue Million Forecast, by Country 2019 & 2032
- Table 100: Global Wind Power Gearbox Market Volume K Unit Forecast, by Country 2019 & 2032
- Table 101: United States Wind Power Gearbox Market Revenue (Million) Forecast, by Application 2019 & 2032
- Table 102: United States Wind Power Gearbox Market Volume (K Unit) Forecast, by Application 2019 & 2032
- Table 103: Canada Wind Power Gearbox Market Revenue (Million) Forecast, by Application 2019 & 2032
- Table 104: Canada Wind Power Gearbox Market Volume (K Unit) Forecast, by Application 2019 & 2032
- Table 105: Rest of North America Wind Power Gearbox Market Revenue (Million) Forecast, by Application 2019 & 2032
- Table 106: Rest of North America Wind Power Gearbox Market Volume (K Unit) Forecast, by Application 2019 & 2032
- Table 107: Global Wind Power Gearbox Market Revenue Million Forecast, by Location of Deployment 2019 & 2032
- Table 108: Global Wind Power Gearbox Market Volume K Unit Forecast, by Location of Deployment 2019 & 2032
- Table 109: Global Wind Power Gearbox Market Revenue Million Forecast, by Country 2019 & 2032
- Table 110: Global Wind Power Gearbox Market Volume K Unit Forecast, by Country 2019 & 2032
- Table 111: China Wind Power Gearbox Market Revenue (Million) Forecast, by Application 2019 & 2032
- Table 112: China Wind Power Gearbox Market Volume (K Unit) Forecast, by Application 2019 & 2032
- Table 113: India Wind Power Gearbox Market Revenue (Million) Forecast, by Application 2019 & 2032
- Table 114: India Wind Power Gearbox Market Volume (K Unit) Forecast, by Application 2019 & 2032
- Table 115: Japan Wind Power Gearbox Market Revenue (Million) Forecast, by Application 2019 & 2032
- Table 116: Japan Wind Power Gearbox Market Volume (K Unit) Forecast, by Application 2019 & 2032
- Table 117: Asutralia Wind Power Gearbox Market Revenue (Million) Forecast, by Application 2019 & 2032
- Table 118: Asutralia Wind Power Gearbox Market Volume (K Unit) Forecast, by Application 2019 & 2032
- Table 119: Rest of Asia Pacific Wind Power Gearbox Market Revenue (Million) Forecast, by Application 2019 & 2032
- Table 120: Rest of Asia Pacific Wind Power Gearbox Market Volume (K Unit) Forecast, by Application 2019 & 2032
- Table 121: Global Wind Power Gearbox Market Revenue Million Forecast, by Location of Deployment 2019 & 2032
- Table 122: Global Wind Power Gearbox Market Volume K Unit Forecast, by Location of Deployment 2019 & 2032
- Table 123: Global Wind Power Gearbox Market Revenue Million Forecast, by Country 2019 & 2032
- Table 124: Global Wind Power Gearbox Market Volume K Unit Forecast, by Country 2019 & 2032
- Table 125: United Kingdom Wind Power Gearbox Market Revenue (Million) Forecast, by Application 2019 & 2032
- Table 126: United Kingdom Wind Power Gearbox Market Volume (K Unit) Forecast, by Application 2019 & 2032
- Table 127: Germany Wind Power Gearbox Market Revenue (Million) Forecast, by Application 2019 & 2032
- Table 128: Germany Wind Power Gearbox Market Volume (K Unit) Forecast, by Application 2019 & 2032
- Table 129: France Wind Power Gearbox Market Revenue (Million) Forecast, by Application 2019 & 2032
- Table 130: France Wind Power Gearbox Market Volume (K Unit) Forecast, by Application 2019 & 2032
- Table 131: Spain Wind Power Gearbox Market Revenue (Million) Forecast, by Application 2019 & 2032
- Table 132: Spain Wind Power Gearbox Market Volume (K Unit) Forecast, by Application 2019 & 2032
- Table 133: Rest of Europe Wind Power Gearbox Market Revenue (Million) Forecast, by Application 2019 & 2032
- Table 134: Rest of Europe Wind Power Gearbox Market Volume (K Unit) Forecast, by Application 2019 & 2032
- Table 135: Global Wind Power Gearbox Market Revenue Million Forecast, by Location of Deployment 2019 & 2032
- Table 136: Global Wind Power Gearbox Market Volume K Unit Forecast, by Location of Deployment 2019 & 2032
- Table 137: Global Wind Power Gearbox Market Revenue Million Forecast, by Country 2019 & 2032
- Table 138: Global Wind Power Gearbox Market Volume K Unit Forecast, by Country 2019 & 2032
- Table 139: Brazil Wind Power Gearbox Market Revenue (Million) Forecast, by Application 2019 & 2032
- Table 140: Brazil Wind Power Gearbox Market Volume (K Unit) Forecast, by Application 2019 & 2032
- Table 141: Argentina Wind Power Gearbox Market Revenue (Million) Forecast, by Application 2019 & 2032
- Table 142: Argentina Wind Power Gearbox Market Volume (K Unit) Forecast, by Application 2019 & 2032
- Table 143: Chile Wind Power Gearbox Market Revenue (Million) Forecast, by Application 2019 & 2032
- Table 144: Chile Wind Power Gearbox Market Volume (K Unit) Forecast, by Application 2019 & 2032
- Table 145: Rest of South America Wind Power Gearbox Market Revenue (Million) Forecast, by Application 2019 & 2032
- Table 146: Rest of South America Wind Power Gearbox Market Volume (K Unit) Forecast, by Application 2019 & 2032
- Table 147: Global Wind Power Gearbox Market Revenue Million Forecast, by Location of Deployment 2019 & 2032
- Table 148: Global Wind Power Gearbox Market Volume K Unit Forecast, by Location of Deployment 2019 & 2032
- Table 149: Global Wind Power Gearbox Market Revenue Million Forecast, by Country 2019 & 2032
- Table 150: Global Wind Power Gearbox Market Volume K Unit Forecast, by Country 2019 & 2032
- Table 151: Saudi Arabia Wind Power Gearbox Market Revenue (Million) Forecast, by Application 2019 & 2032
- Table 152: Saudi Arabia Wind Power Gearbox Market Volume (K Unit) Forecast, by Application 2019 & 2032
- Table 153: United Arab Emirates Wind Power Gearbox Market Revenue (Million) Forecast, by Application 2019 & 2032
- Table 154: United Arab Emirates Wind Power Gearbox Market Volume (K Unit) Forecast, by Application 2019 & 2032
- Table 155: South Africa Wind Power Gearbox Market Revenue (Million) Forecast, by Application 2019 & 2032
- Table 156: South Africa Wind Power Gearbox Market Volume (K Unit) Forecast, by Application 2019 & 2032
- Table 157: Rest of Middle East Wind Power Gearbox Market Revenue (Million) Forecast, by Application 2019 & 2032
- Table 158: Rest of Middle East Wind Power Gearbox Market Volume (K Unit) Forecast, by Application 2019 & 2032
Frequently Asked Questions
1. What is the projected Compound Annual Growth Rate (CAGR) of the Wind Power Gearbox Market?
The projected CAGR is approximately 8.70%.
2. Which companies are prominent players in the Wind Power Gearbox Market?
Key companies in the market include Dana Brevini SpA, Siemens Gamesa Renewable Energy SA, ME Production AS, Stork Gears & Services BV, Winergy Group, Turbine Repair Solutions, Elecon Engineering Company Limited*List Not Exhaustive, ZF Friedrichshafen AG.
3. What are the main segments of the Wind Power Gearbox Market?
The market segments include Location of Deployment.
4. Can you provide details about the market size?
The market size is estimated to be USD 19.92 Million as of 2022.
5. What are some drivers contributing to market growth?
Increasing Adoption of Wind Energy4.; Growing Investments in Wind Energy.
6. What are the notable trends driving market growth?
Offshore Segment to Register Higher Growth.
7. Are there any restraints impacting market growth?
Increasing Penetration of Other Sources of Renewable Energy.
8. Can you provide examples of recent developments in the market?
In September 2023, Sany Renewable Energy (Sany RE) revealed its latest 919 wind turbine platform. The 919 Platform adopts an integrated design, and developments on the 919 Platform share structural components such as the hub, main shaft, front bedplate, blades, gearboxes, and electrical systems are developed as modular systems to cover capacity from 8.5 MW to 11 MW wind turbines with rotor diameters ranging from 214 meters to 230 meters.
9. What pricing options are available for accessing the report?
Pricing options include single-user, multi-user, and enterprise licenses priced at USD 4750, USD 5250, and USD 8750 respectively.
10. Is the market size provided in terms of value or volume?
The market size is provided in terms of value, measured in Million and volume, measured in K Unit.
11. Are there any specific market keywords associated with the report?
Yes, the market keyword associated with the report is "Wind Power Gearbox Market," which aids in identifying and referencing the specific market segment covered.
12. How do I determine which pricing option suits my needs best?
The pricing options vary based on user requirements and access needs. Individual users may opt for single-user licenses, while businesses requiring broader access may choose multi-user or enterprise licenses for cost-effective access to the report.
13. Are there any additional resources or data provided in the Wind Power Gearbox Market report?
While the report offers comprehensive insights, it's advisable to review the specific contents or supplementary materials provided to ascertain if additional resources or data are available.
14. How can I stay updated on further developments or reports in the Wind Power Gearbox Market?
To stay informed about further developments, trends, and reports in the Wind Power Gearbox Market, consider subscribing to industry newsletters, following relevant companies and organizations, or regularly checking reputable industry news sources and publications.
Methodology
Step 1 - Identification of Relevant Samples Size from Population Database


Step 2 - Approaches for Defining Global Market Size (Value, Volume* & Price*)

Note*: In applicable scenarios
Step 3 - Data Sources
Primary Research
- Web Analytics
- Survey Reports
- Research Institute
- Latest Research Reports
- Opinion Leaders
Secondary Research
- Annual Reports
- White Paper
- Latest Press Release
- Industry Association
- Paid Database
- Investor Presentations

Step 4 - Data Triangulation
Involves using different sources of information in order to increase the validity of a study
These sources are likely to be stakeholders in a program - participants, other researchers, program staff, other community members, and so on.
Then we put all data in single framework & apply various statistical tools to find out the dynamic on the market.
During the analysis stage, feedback from the stakeholder groups would be compared to determine areas of agreement as well as areas of divergence


