Key Insights
The Wi-Fi 6 Mobile Hotspot market is poised for significant expansion, driven by the escalating global demand for high-speed, reliable mobile internet. Key growth catalysts include the widespread adoption of mobile devices, the surge in remote work and online education, and the increasing popularity of bandwidth-intensive applications such as video streaming and online gaming. The inherent performance advantages of Wi-Fi 6 technology, including enhanced speed and efficiency over previous generations, are crucial drivers of market growth. The market is projected to reach a size of $1.5 billion by 2033, with a robust Compound Annual Growth Rate (CAGR) of 15% from a 2025 base year. While pricing strategies and the availability of alternative connectivity solutions may present challenges, the persistent need for seamless mobile internet access ensures a positive market trajectory. Market segmentation includes device type, application, and geography, with prominent players like Netgear, D-Link, and Linksys fostering innovation and competition.
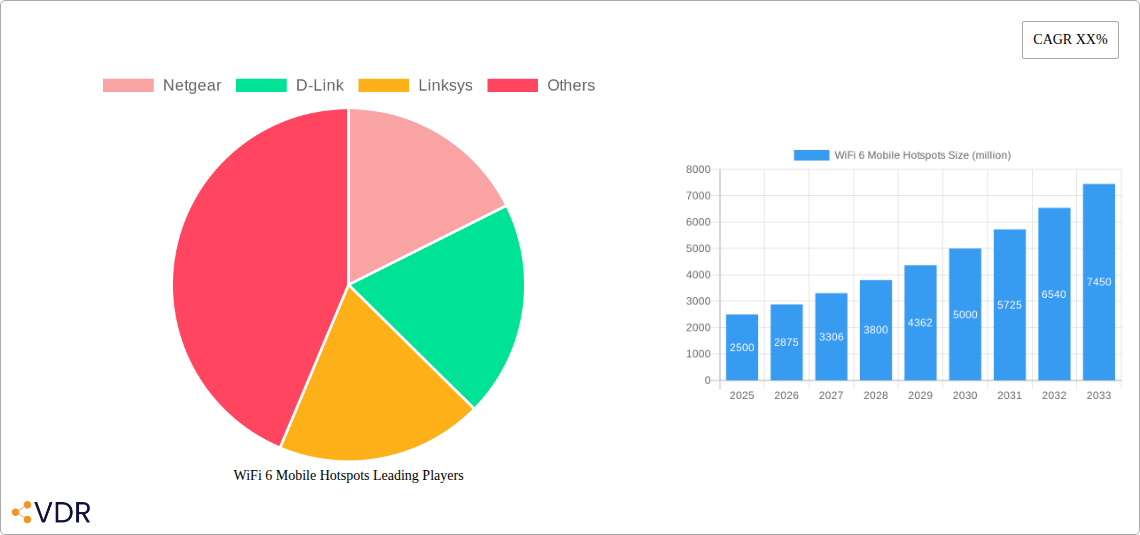
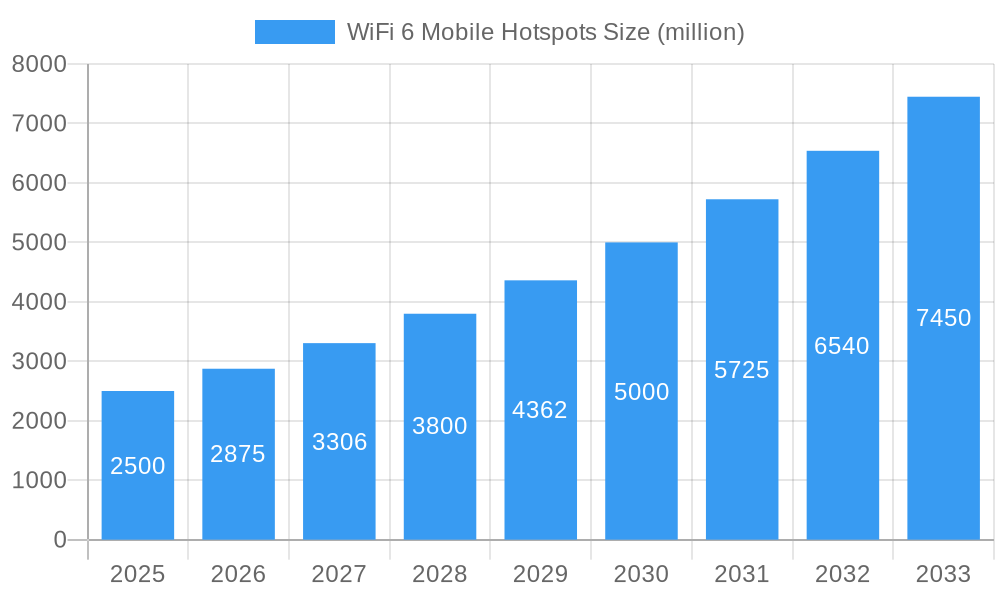
WiFi 6 Mobile Hotspots Market Size (In Billion)
The forecast period, from 2025 to 2033, anticipates sustained growth fueled by continuous technological advancements, enhanced device portability, and the development of novel applications demanding high-speed mobile connectivity. The introduction of more efficient and cost-effective Wi-Fi 6 mobile hotspots is expected to broaden market penetration, especially in emerging economies characterized by rising mobile internet usage. Competitive strategies are centered on improving battery life, bolstering data security, and expanding network coverage to satisfy evolving consumer and business demands. While certain regions exhibit higher market saturation, substantial untapped growth potential exists in markets with rapidly increasing smartphone adoption and improving internet infrastructure.
WiFi 6 Mobile Hotspots Company Market Share
WiFi 6 Mobile Hotspots Market Report: 2019-2033
This comprehensive report provides an in-depth analysis of the WiFi 6 Mobile Hotspots market, encompassing market dynamics, growth trends, regional dominance, product landscape, challenges, opportunities, and key players. The study period covers 2019-2033, with a base year of 2025 and a forecast period of 2025-2033. The report offers crucial insights for industry professionals, investors, and businesses seeking to navigate this rapidly evolving sector. The parent market is Mobile Hotspots and the child market is WiFi 6 Mobile Hotspots.
WiFi 6 Mobile Hotspots Market Dynamics & Structure
This section analyzes the competitive landscape, technological advancements, and regulatory influences shaping the WiFi 6 Mobile Hotspots market. The market is experiencing moderate concentration, with key players such as Netgear, D-Link, and Linksys holding significant market share. Technological innovation, driven by increasing demand for faster speeds and greater capacity, is a key driver. Regulatory frameworks concerning spectrum allocation and data privacy impact market growth. The emergence of 5G technology presents a significant competitive substitute, while the increasing adoption of mobile devices fuels demand. Mergers and acquisitions (M&A) activity within the sector remains relatively low, with approximately xx M&A deals recorded during the historical period (2019-2024).
- Market Concentration: Moderately concentrated, with top 3 players holding approximately xx% of market share in 2025.
- Technological Innovation: Driven by advancements in chipsets, antenna technology, and power management.
- Regulatory Frameworks: Impacting spectrum allocation and data security standards.
- Competitive Substitutes: 5G mobile networks and other cellular technologies.
- End-User Demographics: Predominantly consumers and businesses requiring high-speed mobile internet access.
- M&A Trends: Low M&A activity during 2019-2024, with an estimated xx deals.
WiFi 6 Mobile Hotspots Growth Trends & Insights
The WiFi 6 Mobile Hotspots market exhibits robust growth, driven by increasing demand for high-bandwidth connectivity and the proliferation of mobile devices. Market size experienced a CAGR of xx% during the historical period (2019-2024), reaching an estimated xx million units in 2025. The market is projected to reach xx million units by 2033, exhibiting a CAGR of xx% during the forecast period (2025-2033). This growth is fueled by advancements in WiFi 6 technology, offering faster speeds, lower latency, and increased capacity compared to previous generations. Consumer behavior shifts towards greater reliance on mobile internet access further accelerates market expansion. Adoption rates are increasing steadily, with xx% market penetration in 2025, projected to reach xx% by 2033. Technological disruptions, such as the integration of AI and IoT features, are enhancing product functionality and driving demand.
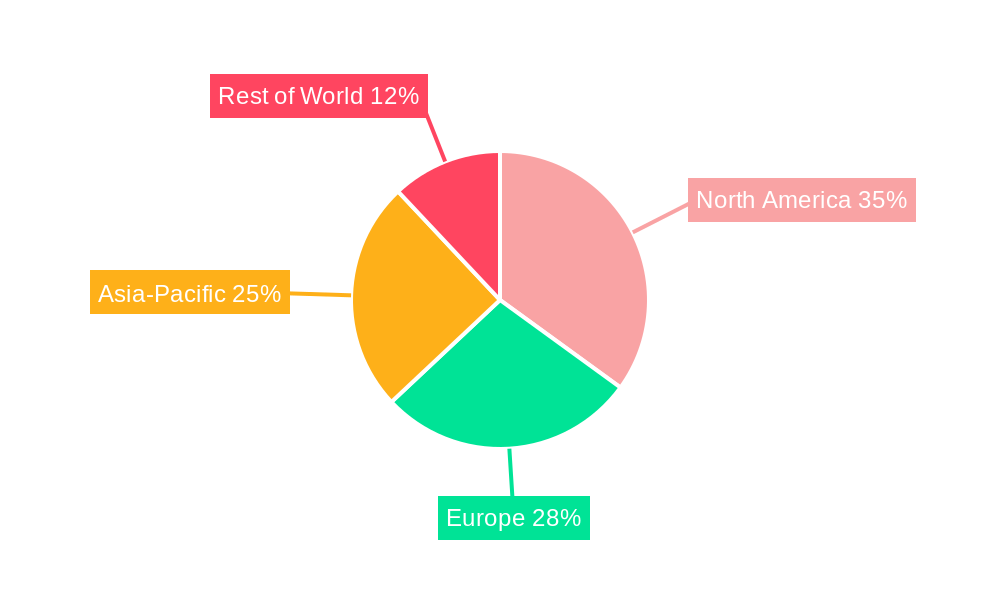
Dominant Regions, Countries, or Segments in WiFi 6 Mobile Hotspots
North America holds the dominant position in the WiFi 6 Mobile Hotspots market, accounting for approximately xx% of the global market share in 2025. This dominance stems from high consumer spending power, advanced infrastructure, and early adoption of new technologies. Europe and Asia Pacific follow as significant markets, with growth fueled by increasing smartphone penetration and expanding mobile broadband coverage.
- North America: High consumer spending, advanced infrastructure, early adoption of new technologies.
- Europe: Growing mobile broadband penetration, increasing demand for high-speed internet.
- Asia Pacific: Rapid smartphone adoption, expanding mobile infrastructure investments.
WiFi 6 Mobile Hotspots Product Landscape
WiFi 6 mobile hotspots offer significant improvements in speed, capacity, and efficiency compared to previous generations. Key product innovations include enhanced power management, improved battery life, and seamless roaming capabilities. Applications range from personal use to enterprise deployments, supporting various connectivity needs. Unique selling propositions (USPs) include superior performance, compact designs, and user-friendly interfaces. Technological advancements encompass the implementation of OFDMA and MU-MIMO technologies for enhanced efficiency and throughput.
Key Drivers, Barriers & Challenges in WiFi 6 Mobile Hotspots
Key Drivers: Increasing demand for high-speed mobile internet, advancements in WiFi 6 technology, proliferation of mobile devices, growing adoption of IoT devices.
Challenges: Competition from 5G mobile networks, price sensitivity of consumers, supply chain disruptions potentially impacting component availability (estimated xx% impact on production in 2025), regulatory hurdles regarding spectrum allocation and data security, and potential standardization issues.
Emerging Opportunities in WiFi 6 Mobile Hotspots
Emerging opportunities lie in untapped markets in developing economies, integration with IoT devices and smart home technologies, and the development of specialized hotspots for niche applications like enterprise-grade connectivity or mobile gaming. Growing demand for secure and reliable mobile connectivity across various sectors also presents significant opportunities.
Growth Accelerators in the WiFi 6 Mobile Hotspots Industry
Technological breakthroughs in WiFi 6E and next-generation WiFi standards promise enhanced speed and capacity, furthering market expansion. Strategic partnerships between mobile network operators and hotspot providers can drive broader adoption. Expansion into underserved markets presents significant growth potential, and the growing demand for secure and reliable internet connectivity across various sectors is expected to fuel long-term growth.
Notable Milestones in WiFi 6 Mobile Hotspots Sector
- 2020: Significant advancements in WiFi 6 chipset technology.
- 2021: Launch of several new WiFi 6 mobile hotspots by major players.
- 2022: Increased focus on security and privacy features in WiFi 6 hotspots.
- 2023: Growing adoption of WiFi 6 hotspots in enterprise settings.
- 2024: Introduction of WiFi 6E mobile hotspots offering broader spectrum access.
In-Depth WiFi 6 Mobile Hotspots Market Outlook
The WiFi 6 Mobile Hotspots market is poised for continued strong growth, driven by technological advancements, increasing demand for high-speed connectivity, and expansion into new markets. Strategic opportunities exist in developing innovative applications, forging strategic partnerships, and targeting niche market segments. The market's future potential is significant, with the forecast suggesting substantial market expansion over the next decade.
WiFi 6 Mobile Hotspots Segmentation
-
1. Application
- 1.1. Online Sales
- 1.2. Offline Sales
-
2. Types
- 2.1. 2.5 Gbps
- 2.2. 8 Gbps
- 2.3. Others
WiFi 6 Mobile Hotspots Segmentation By Geography
-
1. North America
- 1.1. United States
- 1.2. Canada
- 1.3. Mexico
-
2. South America
- 2.1. Brazil
- 2.2. Argentina
- 2.3. Rest of South America
-
3. Europe
- 3.1. United Kingdom
- 3.2. Germany
- 3.3. France
- 3.4. Italy
- 3.5. Spain
- 3.6. Russia
- 3.7. Benelux
- 3.8. Nordics
- 3.9. Rest of Europe
-
4. Middle East & Africa
- 4.1. Turkey
- 4.2. Israel
- 4.3. GCC
- 4.4. North Africa
- 4.5. South Africa
- 4.6. Rest of Middle East & Africa
-
5. Asia Pacific
- 5.1. China
- 5.2. India
- 5.3. Japan
- 5.4. South Korea
- 5.5. ASEAN
- 5.6. Oceania
- 5.7. Rest of Asia Pacific
WiFi 6 Mobile Hotspots Regional Market Share
Geographic Coverage of WiFi 6 Mobile Hotspots
WiFi 6 Mobile Hotspots REPORT HIGHLIGHTS
| Aspects | Details |
|---|---|
| Study Period | 2020-2034 |
| Base Year | 2025 |
| Estimated Year | 2026 |
| Forecast Period | 2026-2034 |
| Historical Period | 2020-2025 |
| Growth Rate | CAGR of 15% from 2020-2034 |
| Segmentation |
|
Table of Contents
- 1. Introduction
- 1.1. Research Scope
- 1.2. Market Segmentation
- 1.3. Research Objective
- 1.4. Definitions and Assumptions
- 2. Executive Summary
- 2.1. Market Snapshot
- 3. Market Dynamics
- 3.1. Market Drivers
- 3.2. Market Restrains
- 3.3. Market Trends
- 3.4. Market Opportunities
- 4. Market Factor Analysis
- 4.1. Porters Five Forces
- 4.1.1. Bargaining Power of Suppliers
- 4.1.2. Bargaining Power of Buyers
- 4.1.3. Threat of New Entrants
- 4.1.4. Threat of Substitutes
- 4.1.5. Competitive Rivalry
- 4.2. PESTEL analysis
- 4.3. BCG Analysis
- 4.3.1. Stars (High Growth, High Market Share)
- 4.3.2. Cash Cows (Low Growth, High Market Share)
- 4.3.3. Question Mark (High Growth, Low Market Share)
- 4.3.4. Dogs (Low Growth, Low Market Share)
- 4.4. Ansoff Matrix Analysis
- 4.5. Supply Chain Analysis
- 4.6. Regulatory Landscape
- 4.7. Current Market Potential and Opportunity Assessment (TAM–SAM–SOM Framework)
- 4.8. VDR Analyst Note
- 4.1. Porters Five Forces
- 5. Market Analysis, Insights and Forecast 2021-2033
- 5.1. Market Analysis, Insights and Forecast - by Application
- 5.1.1. Online Sales
- 5.1.2. Offline Sales
- 5.2. Market Analysis, Insights and Forecast - by Types
- 5.2.1. 2.5 Gbps
- 5.2.2. 8 Gbps
- 5.2.3. Others
- 5.3. Market Analysis, Insights and Forecast - by Region
- 5.3.1. North America
- 5.3.2. South America
- 5.3.3. Europe
- 5.3.4. Middle East & Africa
- 5.3.5. Asia Pacific
- 5.1. Market Analysis, Insights and Forecast - by Application
- 6. Global WiFi 6 Mobile Hotspots Analysis, Insights and Forecast, 2021-2033
- 6.1. Market Analysis, Insights and Forecast - by Application
- 6.1.1. Online Sales
- 6.1.2. Offline Sales
- 6.2. Market Analysis, Insights and Forecast - by Types
- 6.2.1. 2.5 Gbps
- 6.2.2. 8 Gbps
- 6.2.3. Others
- 6.1. Market Analysis, Insights and Forecast - by Application
- 7. North America WiFi 6 Mobile Hotspots Analysis, Insights and Forecast, 2021-2033
- 7.1. Market Analysis, Insights and Forecast - by Application
- 7.1.1. Online Sales
- 7.1.2. Offline Sales
- 7.2. Market Analysis, Insights and Forecast - by Types
- 7.2.1. 2.5 Gbps
- 7.2.2. 8 Gbps
- 7.2.3. Others
- 7.1. Market Analysis, Insights and Forecast - by Application
- 8. South America WiFi 6 Mobile Hotspots Analysis, Insights and Forecast, 2021-2033
- 8.1. Market Analysis, Insights and Forecast - by Application
- 8.1.1. Online Sales
- 8.1.2. Offline Sales
- 8.2. Market Analysis, Insights and Forecast - by Types
- 8.2.1. 2.5 Gbps
- 8.2.2. 8 Gbps
- 8.2.3. Others
- 8.1. Market Analysis, Insights and Forecast - by Application
- 9. Europe WiFi 6 Mobile Hotspots Analysis, Insights and Forecast, 2021-2033
- 9.1. Market Analysis, Insights and Forecast - by Application
- 9.1.1. Online Sales
- 9.1.2. Offline Sales
- 9.2. Market Analysis, Insights and Forecast - by Types
- 9.2.1. 2.5 Gbps
- 9.2.2. 8 Gbps
- 9.2.3. Others
- 9.1. Market Analysis, Insights and Forecast - by Application
- 10. Middle East & Africa WiFi 6 Mobile Hotspots Analysis, Insights and Forecast, 2021-2033
- 10.1. Market Analysis, Insights and Forecast - by Application
- 10.1.1. Online Sales
- 10.1.2. Offline Sales
- 10.2. Market Analysis, Insights and Forecast - by Types
- 10.2.1. 2.5 Gbps
- 10.2.2. 8 Gbps
- 10.2.3. Others
- 10.1. Market Analysis, Insights and Forecast - by Application
- 11. Asia Pacific WiFi 6 Mobile Hotspots Analysis, Insights and Forecast, 2021-2033
- 11.1. Market Analysis, Insights and Forecast - by Application
- 11.1.1. Online Sales
- 11.1.2. Offline Sales
- 11.2. Market Analysis, Insights and Forecast - by Types
- 11.2.1. 2.5 Gbps
- 11.2.2. 8 Gbps
- 11.2.3. Others
- 11.1. Market Analysis, Insights and Forecast - by Application
- 12. Competitive Analysis
- 12.1. Company Profiles
- 12.1.1 Netgear
- 12.1.1.1. Company Overview
- 12.1.1.2. Products
- 12.1.1.3. Company Financials
- 12.1.1.4. SWOT Analysis
- 12.1.2 D-Link
- 12.1.2.1. Company Overview
- 12.1.2.2. Products
- 12.1.2.3. Company Financials
- 12.1.2.4. SWOT Analysis
- 12.1.3 Linksys
- 12.1.3.1. Company Overview
- 12.1.3.2. Products
- 12.1.3.3. Company Financials
- 12.1.3.4. SWOT Analysis
- 12.1.1 Netgear
- 12.2. Market Entropy
- 12.2.1 Company's Key Areas Served
- 12.2.2 Recent Developments
- 12.3. Company Market Share Analysis 2025
- 12.3.1 Top 5 Companies Market Share Analysis
- 12.3.2 Top 3 Companies Market Share Analysis
- 12.4. List of Potential Customers
- 13. Research Methodology
List of Figures
- Figure 1: Global WiFi 6 Mobile Hotspots Revenue Breakdown (billion, %) by Region 2025 & 2033
- Figure 2: Global WiFi 6 Mobile Hotspots Volume Breakdown (K, %) by Region 2025 & 2033
- Figure 3: North America WiFi 6 Mobile Hotspots Revenue (billion), by Application 2025 & 2033
- Figure 4: North America WiFi 6 Mobile Hotspots Volume (K), by Application 2025 & 2033
- Figure 5: North America WiFi 6 Mobile Hotspots Revenue Share (%), by Application 2025 & 2033
- Figure 6: North America WiFi 6 Mobile Hotspots Volume Share (%), by Application 2025 & 2033
- Figure 7: North America WiFi 6 Mobile Hotspots Revenue (billion), by Types 2025 & 2033
- Figure 8: North America WiFi 6 Mobile Hotspots Volume (K), by Types 2025 & 2033
- Figure 9: North America WiFi 6 Mobile Hotspots Revenue Share (%), by Types 2025 & 2033
- Figure 10: North America WiFi 6 Mobile Hotspots Volume Share (%), by Types 2025 & 2033
- Figure 11: North America WiFi 6 Mobile Hotspots Revenue (billion), by Country 2025 & 2033
- Figure 12: North America WiFi 6 Mobile Hotspots Volume (K), by Country 2025 & 2033
- Figure 13: North America WiFi 6 Mobile Hotspots Revenue Share (%), by Country 2025 & 2033
- Figure 14: North America WiFi 6 Mobile Hotspots Volume Share (%), by Country 2025 & 2033
- Figure 15: South America WiFi 6 Mobile Hotspots Revenue (billion), by Application 2025 & 2033
- Figure 16: South America WiFi 6 Mobile Hotspots Volume (K), by Application 2025 & 2033
- Figure 17: South America WiFi 6 Mobile Hotspots Revenue Share (%), by Application 2025 & 2033
- Figure 18: South America WiFi 6 Mobile Hotspots Volume Share (%), by Application 2025 & 2033
- Figure 19: South America WiFi 6 Mobile Hotspots Revenue (billion), by Types 2025 & 2033
- Figure 20: South America WiFi 6 Mobile Hotspots Volume (K), by Types 2025 & 2033
- Figure 21: South America WiFi 6 Mobile Hotspots Revenue Share (%), by Types 2025 & 2033
- Figure 22: South America WiFi 6 Mobile Hotspots Volume Share (%), by Types 2025 & 2033
- Figure 23: South America WiFi 6 Mobile Hotspots Revenue (billion), by Country 2025 & 2033
- Figure 24: South America WiFi 6 Mobile Hotspots Volume (K), by Country 2025 & 2033
- Figure 25: South America WiFi 6 Mobile Hotspots Revenue Share (%), by Country 2025 & 2033
- Figure 26: South America WiFi 6 Mobile Hotspots Volume Share (%), by Country 2025 & 2033
- Figure 27: Europe WiFi 6 Mobile Hotspots Revenue (billion), by Application 2025 & 2033
- Figure 28: Europe WiFi 6 Mobile Hotspots Volume (K), by Application 2025 & 2033
- Figure 29: Europe WiFi 6 Mobile Hotspots Revenue Share (%), by Application 2025 & 2033
- Figure 30: Europe WiFi 6 Mobile Hotspots Volume Share (%), by Application 2025 & 2033
- Figure 31: Europe WiFi 6 Mobile Hotspots Revenue (billion), by Types 2025 & 2033
- Figure 32: Europe WiFi 6 Mobile Hotspots Volume (K), by Types 2025 & 2033
- Figure 33: Europe WiFi 6 Mobile Hotspots Revenue Share (%), by Types 2025 & 2033
- Figure 34: Europe WiFi 6 Mobile Hotspots Volume Share (%), by Types 2025 & 2033
- Figure 35: Europe WiFi 6 Mobile Hotspots Revenue (billion), by Country 2025 & 2033
- Figure 36: Europe WiFi 6 Mobile Hotspots Volume (K), by Country 2025 & 2033
- Figure 37: Europe WiFi 6 Mobile Hotspots Revenue Share (%), by Country 2025 & 2033
- Figure 38: Europe WiFi 6 Mobile Hotspots Volume Share (%), by Country 2025 & 2033
- Figure 39: Middle East & Africa WiFi 6 Mobile Hotspots Revenue (billion), by Application 2025 & 2033
- Figure 40: Middle East & Africa WiFi 6 Mobile Hotspots Volume (K), by Application 2025 & 2033
- Figure 41: Middle East & Africa WiFi 6 Mobile Hotspots Revenue Share (%), by Application 2025 & 2033
- Figure 42: Middle East & Africa WiFi 6 Mobile Hotspots Volume Share (%), by Application 2025 & 2033
- Figure 43: Middle East & Africa WiFi 6 Mobile Hotspots Revenue (billion), by Types 2025 & 2033
- Figure 44: Middle East & Africa WiFi 6 Mobile Hotspots Volume (K), by Types 2025 & 2033
- Figure 45: Middle East & Africa WiFi 6 Mobile Hotspots Revenue Share (%), by Types 2025 & 2033
- Figure 46: Middle East & Africa WiFi 6 Mobile Hotspots Volume Share (%), by Types 2025 & 2033
- Figure 47: Middle East & Africa WiFi 6 Mobile Hotspots Revenue (billion), by Country 2025 & 2033
- Figure 48: Middle East & Africa WiFi 6 Mobile Hotspots Volume (K), by Country 2025 & 2033
- Figure 49: Middle East & Africa WiFi 6 Mobile Hotspots Revenue Share (%), by Country 2025 & 2033
- Figure 50: Middle East & Africa WiFi 6 Mobile Hotspots Volume Share (%), by Country 2025 & 2033
- Figure 51: Asia Pacific WiFi 6 Mobile Hotspots Revenue (billion), by Application 2025 & 2033
- Figure 52: Asia Pacific WiFi 6 Mobile Hotspots Volume (K), by Application 2025 & 2033
- Figure 53: Asia Pacific WiFi 6 Mobile Hotspots Revenue Share (%), by Application 2025 & 2033
- Figure 54: Asia Pacific WiFi 6 Mobile Hotspots Volume Share (%), by Application 2025 & 2033
- Figure 55: Asia Pacific WiFi 6 Mobile Hotspots Revenue (billion), by Types 2025 & 2033
- Figure 56: Asia Pacific WiFi 6 Mobile Hotspots Volume (K), by Types 2025 & 2033
- Figure 57: Asia Pacific WiFi 6 Mobile Hotspots Revenue Share (%), by Types 2025 & 2033
- Figure 58: Asia Pacific WiFi 6 Mobile Hotspots Volume Share (%), by Types 2025 & 2033
- Figure 59: Asia Pacific WiFi 6 Mobile Hotspots Revenue (billion), by Country 2025 & 2033
- Figure 60: Asia Pacific WiFi 6 Mobile Hotspots Volume (K), by Country 2025 & 2033
- Figure 61: Asia Pacific WiFi 6 Mobile Hotspots Revenue Share (%), by Country 2025 & 2033
- Figure 62: Asia Pacific WiFi 6 Mobile Hotspots Volume Share (%), by Country 2025 & 2033
List of Tables
- Table 1: Global WiFi 6 Mobile Hotspots Revenue billion Forecast, by Application 2020 & 2033
- Table 2: Global WiFi 6 Mobile Hotspots Volume K Forecast, by Application 2020 & 2033
- Table 3: Global WiFi 6 Mobile Hotspots Revenue billion Forecast, by Types 2020 & 2033
- Table 4: Global WiFi 6 Mobile Hotspots Volume K Forecast, by Types 2020 & 2033
- Table 5: Global WiFi 6 Mobile Hotspots Revenue billion Forecast, by Region 2020 & 2033
- Table 6: Global WiFi 6 Mobile Hotspots Volume K Forecast, by Region 2020 & 2033
- Table 7: Global WiFi 6 Mobile Hotspots Revenue billion Forecast, by Application 2020 & 2033
- Table 8: Global WiFi 6 Mobile Hotspots Volume K Forecast, by Application 2020 & 2033
- Table 9: Global WiFi 6 Mobile Hotspots Revenue billion Forecast, by Types 2020 & 2033
- Table 10: Global WiFi 6 Mobile Hotspots Volume K Forecast, by Types 2020 & 2033
- Table 11: Global WiFi 6 Mobile Hotspots Revenue billion Forecast, by Country 2020 & 2033
- Table 12: Global WiFi 6 Mobile Hotspots Volume K Forecast, by Country 2020 & 2033
- Table 13: United States WiFi 6 Mobile Hotspots Revenue (billion) Forecast, by Application 2020 & 2033
- Table 14: United States WiFi 6 Mobile Hotspots Volume (K) Forecast, by Application 2020 & 2033
- Table 15: Canada WiFi 6 Mobile Hotspots Revenue (billion) Forecast, by Application 2020 & 2033
- Table 16: Canada WiFi 6 Mobile Hotspots Volume (K) Forecast, by Application 2020 & 2033
- Table 17: Mexico WiFi 6 Mobile Hotspots Revenue (billion) Forecast, by Application 2020 & 2033
- Table 18: Mexico WiFi 6 Mobile Hotspots Volume (K) Forecast, by Application 2020 & 2033
- Table 19: Global WiFi 6 Mobile Hotspots Revenue billion Forecast, by Application 2020 & 2033
- Table 20: Global WiFi 6 Mobile Hotspots Volume K Forecast, by Application 2020 & 2033
- Table 21: Global WiFi 6 Mobile Hotspots Revenue billion Forecast, by Types 2020 & 2033
- Table 22: Global WiFi 6 Mobile Hotspots Volume K Forecast, by Types 2020 & 2033
- Table 23: Global WiFi 6 Mobile Hotspots Revenue billion Forecast, by Country 2020 & 2033
- Table 24: Global WiFi 6 Mobile Hotspots Volume K Forecast, by Country 2020 & 2033
- Table 25: Brazil WiFi 6 Mobile Hotspots Revenue (billion) Forecast, by Application 2020 & 2033
- Table 26: Brazil WiFi 6 Mobile Hotspots Volume (K) Forecast, by Application 2020 & 2033
- Table 27: Argentina WiFi 6 Mobile Hotspots Revenue (billion) Forecast, by Application 2020 & 2033
- Table 28: Argentina WiFi 6 Mobile Hotspots Volume (K) Forecast, by Application 2020 & 2033
- Table 29: Rest of South America WiFi 6 Mobile Hotspots Revenue (billion) Forecast, by Application 2020 & 2033
- Table 30: Rest of South America WiFi 6 Mobile Hotspots Volume (K) Forecast, by Application 2020 & 2033
- Table 31: Global WiFi 6 Mobile Hotspots Revenue billion Forecast, by Application 2020 & 2033
- Table 32: Global WiFi 6 Mobile Hotspots Volume K Forecast, by Application 2020 & 2033
- Table 33: Global WiFi 6 Mobile Hotspots Revenue billion Forecast, by Types 2020 & 2033
- Table 34: Global WiFi 6 Mobile Hotspots Volume K Forecast, by Types 2020 & 2033
- Table 35: Global WiFi 6 Mobile Hotspots Revenue billion Forecast, by Country 2020 & 2033
- Table 36: Global WiFi 6 Mobile Hotspots Volume K Forecast, by Country 2020 & 2033
- Table 37: United Kingdom WiFi 6 Mobile Hotspots Revenue (billion) Forecast, by Application 2020 & 2033
- Table 38: United Kingdom WiFi 6 Mobile Hotspots Volume (K) Forecast, by Application 2020 & 2033
- Table 39: Germany WiFi 6 Mobile Hotspots Revenue (billion) Forecast, by Application 2020 & 2033
- Table 40: Germany WiFi 6 Mobile Hotspots Volume (K) Forecast, by Application 2020 & 2033
- Table 41: France WiFi 6 Mobile Hotspots Revenue (billion) Forecast, by Application 2020 & 2033
- Table 42: France WiFi 6 Mobile Hotspots Volume (K) Forecast, by Application 2020 & 2033
- Table 43: Italy WiFi 6 Mobile Hotspots Revenue (billion) Forecast, by Application 2020 & 2033
- Table 44: Italy WiFi 6 Mobile Hotspots Volume (K) Forecast, by Application 2020 & 2033
- Table 45: Spain WiFi 6 Mobile Hotspots Revenue (billion) Forecast, by Application 2020 & 2033
- Table 46: Spain WiFi 6 Mobile Hotspots Volume (K) Forecast, by Application 2020 & 2033
- Table 47: Russia WiFi 6 Mobile Hotspots Revenue (billion) Forecast, by Application 2020 & 2033
- Table 48: Russia WiFi 6 Mobile Hotspots Volume (K) Forecast, by Application 2020 & 2033
- Table 49: Benelux WiFi 6 Mobile Hotspots Revenue (billion) Forecast, by Application 2020 & 2033
- Table 50: Benelux WiFi 6 Mobile Hotspots Volume (K) Forecast, by Application 2020 & 2033
- Table 51: Nordics WiFi 6 Mobile Hotspots Revenue (billion) Forecast, by Application 2020 & 2033
- Table 52: Nordics WiFi 6 Mobile Hotspots Volume (K) Forecast, by Application 2020 & 2033
- Table 53: Rest of Europe WiFi 6 Mobile Hotspots Revenue (billion) Forecast, by Application 2020 & 2033
- Table 54: Rest of Europe WiFi 6 Mobile Hotspots Volume (K) Forecast, by Application 2020 & 2033
- Table 55: Global WiFi 6 Mobile Hotspots Revenue billion Forecast, by Application 2020 & 2033
- Table 56: Global WiFi 6 Mobile Hotspots Volume K Forecast, by Application 2020 & 2033
- Table 57: Global WiFi 6 Mobile Hotspots Revenue billion Forecast, by Types 2020 & 2033
- Table 58: Global WiFi 6 Mobile Hotspots Volume K Forecast, by Types 2020 & 2033
- Table 59: Global WiFi 6 Mobile Hotspots Revenue billion Forecast, by Country 2020 & 2033
- Table 60: Global WiFi 6 Mobile Hotspots Volume K Forecast, by Country 2020 & 2033
- Table 61: Turkey WiFi 6 Mobile Hotspots Revenue (billion) Forecast, by Application 2020 & 2033
- Table 62: Turkey WiFi 6 Mobile Hotspots Volume (K) Forecast, by Application 2020 & 2033
- Table 63: Israel WiFi 6 Mobile Hotspots Revenue (billion) Forecast, by Application 2020 & 2033
- Table 64: Israel WiFi 6 Mobile Hotspots Volume (K) Forecast, by Application 2020 & 2033
- Table 65: GCC WiFi 6 Mobile Hotspots Revenue (billion) Forecast, by Application 2020 & 2033
- Table 66: GCC WiFi 6 Mobile Hotspots Volume (K) Forecast, by Application 2020 & 2033
- Table 67: North Africa WiFi 6 Mobile Hotspots Revenue (billion) Forecast, by Application 2020 & 2033
- Table 68: North Africa WiFi 6 Mobile Hotspots Volume (K) Forecast, by Application 2020 & 2033
- Table 69: South Africa WiFi 6 Mobile Hotspots Revenue (billion) Forecast, by Application 2020 & 2033
- Table 70: South Africa WiFi 6 Mobile Hotspots Volume (K) Forecast, by Application 2020 & 2033
- Table 71: Rest of Middle East & Africa WiFi 6 Mobile Hotspots Revenue (billion) Forecast, by Application 2020 & 2033
- Table 72: Rest of Middle East & Africa WiFi 6 Mobile Hotspots Volume (K) Forecast, by Application 2020 & 2033
- Table 73: Global WiFi 6 Mobile Hotspots Revenue billion Forecast, by Application 2020 & 2033
- Table 74: Global WiFi 6 Mobile Hotspots Volume K Forecast, by Application 2020 & 2033
- Table 75: Global WiFi 6 Mobile Hotspots Revenue billion Forecast, by Types 2020 & 2033
- Table 76: Global WiFi 6 Mobile Hotspots Volume K Forecast, by Types 2020 & 2033
- Table 77: Global WiFi 6 Mobile Hotspots Revenue billion Forecast, by Country 2020 & 2033
- Table 78: Global WiFi 6 Mobile Hotspots Volume K Forecast, by Country 2020 & 2033
- Table 79: China WiFi 6 Mobile Hotspots Revenue (billion) Forecast, by Application 2020 & 2033
- Table 80: China WiFi 6 Mobile Hotspots Volume (K) Forecast, by Application 2020 & 2033
- Table 81: India WiFi 6 Mobile Hotspots Revenue (billion) Forecast, by Application 2020 & 2033
- Table 82: India WiFi 6 Mobile Hotspots Volume (K) Forecast, by Application 2020 & 2033
- Table 83: Japan WiFi 6 Mobile Hotspots Revenue (billion) Forecast, by Application 2020 & 2033
- Table 84: Japan WiFi 6 Mobile Hotspots Volume (K) Forecast, by Application 2020 & 2033
- Table 85: South Korea WiFi 6 Mobile Hotspots Revenue (billion) Forecast, by Application 2020 & 2033
- Table 86: South Korea WiFi 6 Mobile Hotspots Volume (K) Forecast, by Application 2020 & 2033
- Table 87: ASEAN WiFi 6 Mobile Hotspots Revenue (billion) Forecast, by Application 2020 & 2033
- Table 88: ASEAN WiFi 6 Mobile Hotspots Volume (K) Forecast, by Application 2020 & 2033
- Table 89: Oceania WiFi 6 Mobile Hotspots Revenue (billion) Forecast, by Application 2020 & 2033
- Table 90: Oceania WiFi 6 Mobile Hotspots Volume (K) Forecast, by Application 2020 & 2033
- Table 91: Rest of Asia Pacific WiFi 6 Mobile Hotspots Revenue (billion) Forecast, by Application 2020 & 2033
- Table 92: Rest of Asia Pacific WiFi 6 Mobile Hotspots Volume (K) Forecast, by Application 2020 & 2033
Frequently Asked Questions
1. What is the projected Compound Annual Growth Rate (CAGR) of the WiFi 6 Mobile Hotspots?
The projected CAGR is approximately 15%.
2. Which companies are prominent players in the WiFi 6 Mobile Hotspots?
Key companies in the market include Netgear, D-Link, Linksys.
3. What are the main segments of the WiFi 6 Mobile Hotspots?
The market segments include Application, Types.
4. Can you provide details about the market size?
The market size is estimated to be USD 1.5 billion as of 2022.
5. What are some drivers contributing to market growth?
N/A
6. What are the notable trends driving market growth?
N/A
7. Are there any restraints impacting market growth?
N/A
8. Can you provide examples of recent developments in the market?
N/A
9. What pricing options are available for accessing the report?
Pricing options include single-user, multi-user, and enterprise licenses priced at USD 3950.00, USD 5925.00, and USD 7900.00 respectively.
10. Is the market size provided in terms of value or volume?
The market size is provided in terms of value, measured in billion and volume, measured in K.
11. Are there any specific market keywords associated with the report?
Yes, the market keyword associated with the report is "WiFi 6 Mobile Hotspots," which aids in identifying and referencing the specific market segment covered.
12. How do I determine which pricing option suits my needs best?
The pricing options vary based on user requirements and access needs. Individual users may opt for single-user licenses, while businesses requiring broader access may choose multi-user or enterprise licenses for cost-effective access to the report.
13. Are there any additional resources or data provided in the WiFi 6 Mobile Hotspots report?
While the report offers comprehensive insights, it's advisable to review the specific contents or supplementary materials provided to ascertain if additional resources or data are available.
14. How can I stay updated on further developments or reports in the WiFi 6 Mobile Hotspots?
To stay informed about further developments, trends, and reports in the WiFi 6 Mobile Hotspots, consider subscribing to industry newsletters, following relevant companies and organizations, or regularly checking reputable industry news sources and publications.
Methodology
Step 1 - Identification of Relevant Samples Size from Population Database


Step 2 - Approaches for Defining Global Market Size (Value, Volume* & Price*)

Note*: In applicable scenarios
Step 3 - Data Sources
Primary Research
- Web Analytics
- Survey Reports
- Research Institute
- Latest Research Reports
- Opinion Leaders
Secondary Research
- Annual Reports
- White Paper
- Latest Press Release
- Industry Association
- Paid Database
- Investor Presentations

Step 4 - Data Triangulation
Involves using different sources of information in order to increase the validity of a study
These sources are likely to be stakeholders in a program - participants, other researchers, program staff, other community members, and so on.
Then we put all data in single framework & apply various statistical tools to find out the dynamic on the market.
During the analysis stage, feedback from the stakeholder groups would be compared to determine areas of agreement as well as areas of divergence

